Denver Metro/North Front Range Ozone Nonattainment Area WEP/AOI Analysis
December 1, 2023
Denver Metro/North Front Range Ozone Nonattainment Area: Evaluation of 2026 O3 Precursor Emission Source Sectors using Weighted Emissions Potential and Potential Source Contributions Analysis
Motivation
Currently, there are two ozone National Ambient Air Quality Standard (NAAQS) that the Denver Metro/North Front Range (DM/NFR) ozone nonattainment area (NAA) is required to attain: (1) the 70 parts per billion (ppb) ozone NAAQS promulgated in 2015; and (2) the 75 ppb ozone NAAQS promulgated in 2008. The attainment of the ozone NAAQS is based on the ozone design value (DV) that is defined as a three-year average of the fourth highest maximum daily average 8-hour (MDA8) ozone concentration.
Photochemical Grid Model (PGM) platforms are used for DM/NFR ozone State Implementation Plan (SIP) future year (FY) attainment demonstration modeling following EPA's ozone SIP modeling guidance. A PGM 2016 36/12/4-km modeling platform was used for three recent ozone SIPs that used the Comprehensive Air-quality Model with extensions (CAMx) model:
However, PGM platforms are time- and resource-intensive to develop. Additionally, the DM/NFR area exhibits lots of year-to-year variability in ozone concentrations that are driven primarily by differences in meteorology with the contributions of emissions from wildfires also exhibiting a lot of year-to-year variability. Therefore, a method is needed to quickly screen the effects of proposed emission control strategies on the transport of ozone precursor emissions to locations of observed high ozone concentrations using multiple years of meteorology in order to account for the year-to-year variability.
Background and Objectives
This project pilots a new approach to estimate potential ozone precursor (i.e., oxides of nitrogen [NOx] and volatile organic compounds [VOC]) source contributions to monitoring sites and the times of observed elevated ozone concentrations (e.g., greater than or equal to 70 ppb) in the DM/NFR ozone NAA. The approach uses the Hybrid Single-Particle Lagrangian Integrated Trajectory (HYSPLIT) back trajectory model[1][2] and 2026 emissions to perform an empirical analysis of the transport of NOx and VOC emissions to evaluate the potential relative contributions of emissions from different source sectors and regions in the NAA that arrive at monitoring sites when observed high ozone concentrations occur.
This analysis aims to 1) estimate the potential contributions of NOx and VOC emissions from various source sectors that arrive at key monitoring sites in the 2015 Colorado DM/NFR ozone NAA 9-county region at times of observed elevated O3 concentrations, and 2) evaluate the potential effects of 2026 alternative emission control strategies on estimated source contributions. This is a screening tool designed to complement full chemistry PGM modeling using multiple years of meteorology.
Overview of Approach
There are five main steps in the approach, listed in Figure 1. More details on each step are discussed in the following sections.
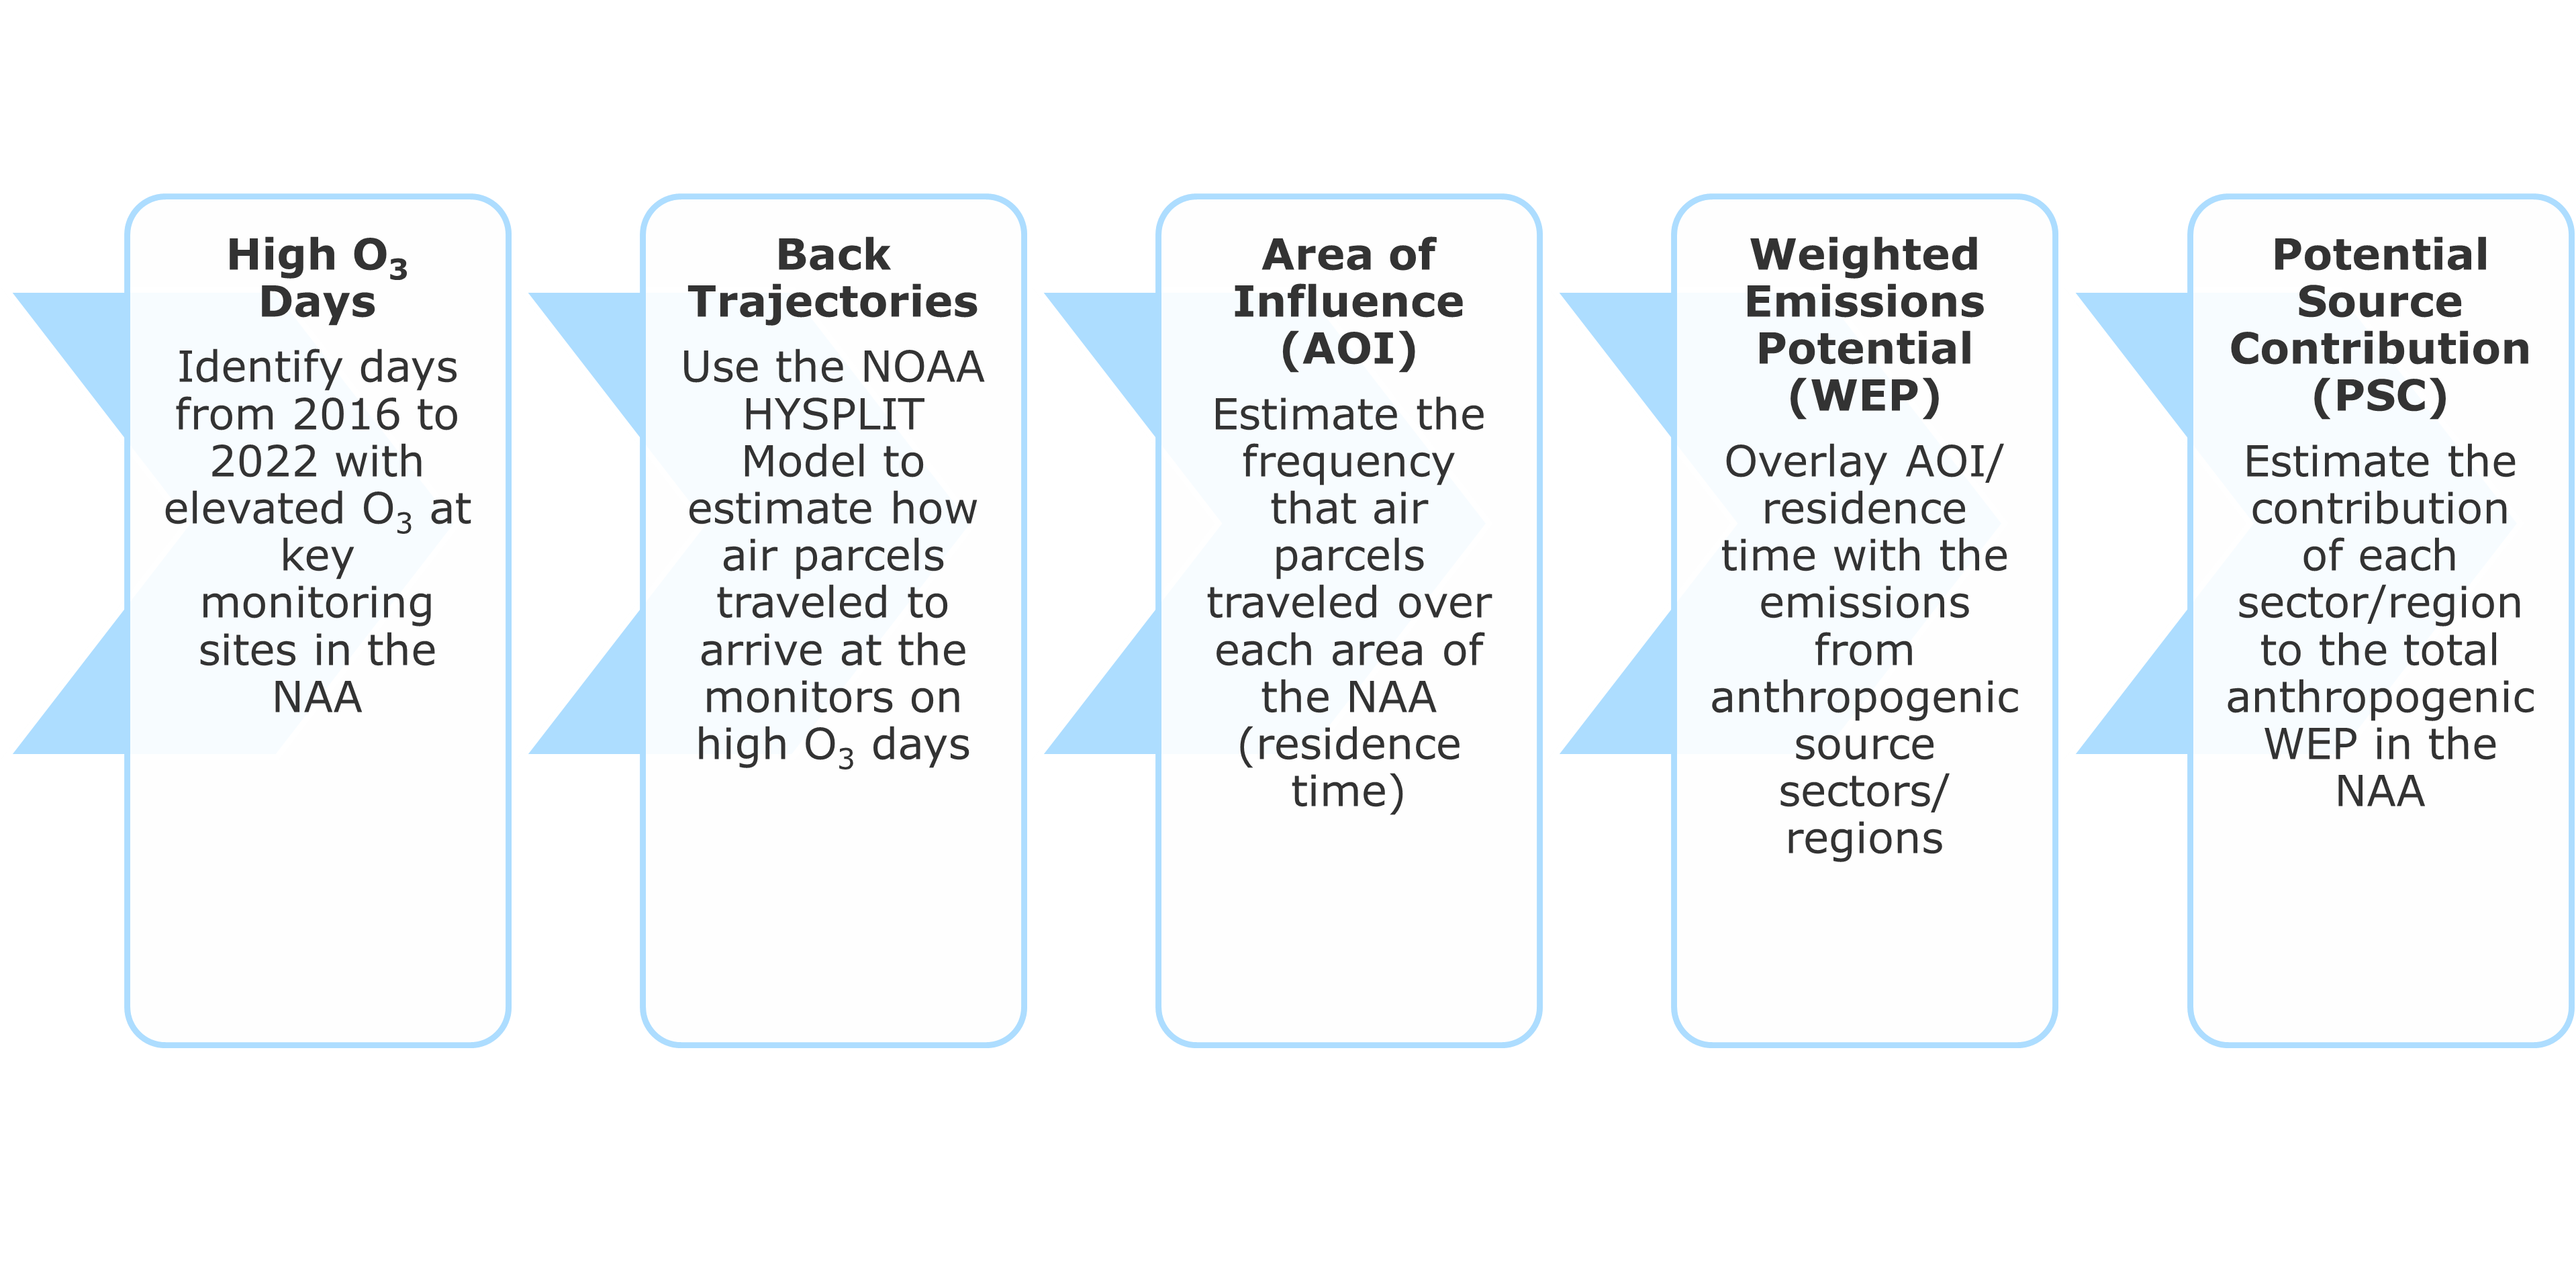
Figure 1.Flowchart of the approach for estimating contributions of emissions from source sectors in the DM/NFR NAA to ozone precursors at monitors during high observed ozone concentrations.
Analysis Domain and Monitoring Sites
The analysis was performed using the 4-kilometer (km) domain of DM/NFR modeling platform for Colorado, zoomed to the Denver NAA. Eleven ozone monitors inside the Denver NAA were selected for the analysis. Trajectory endpoints located outside the analysis domain were dropped from the analysis. The analysis domain and ozone monitors included in the analysis are shown in Figure 2.
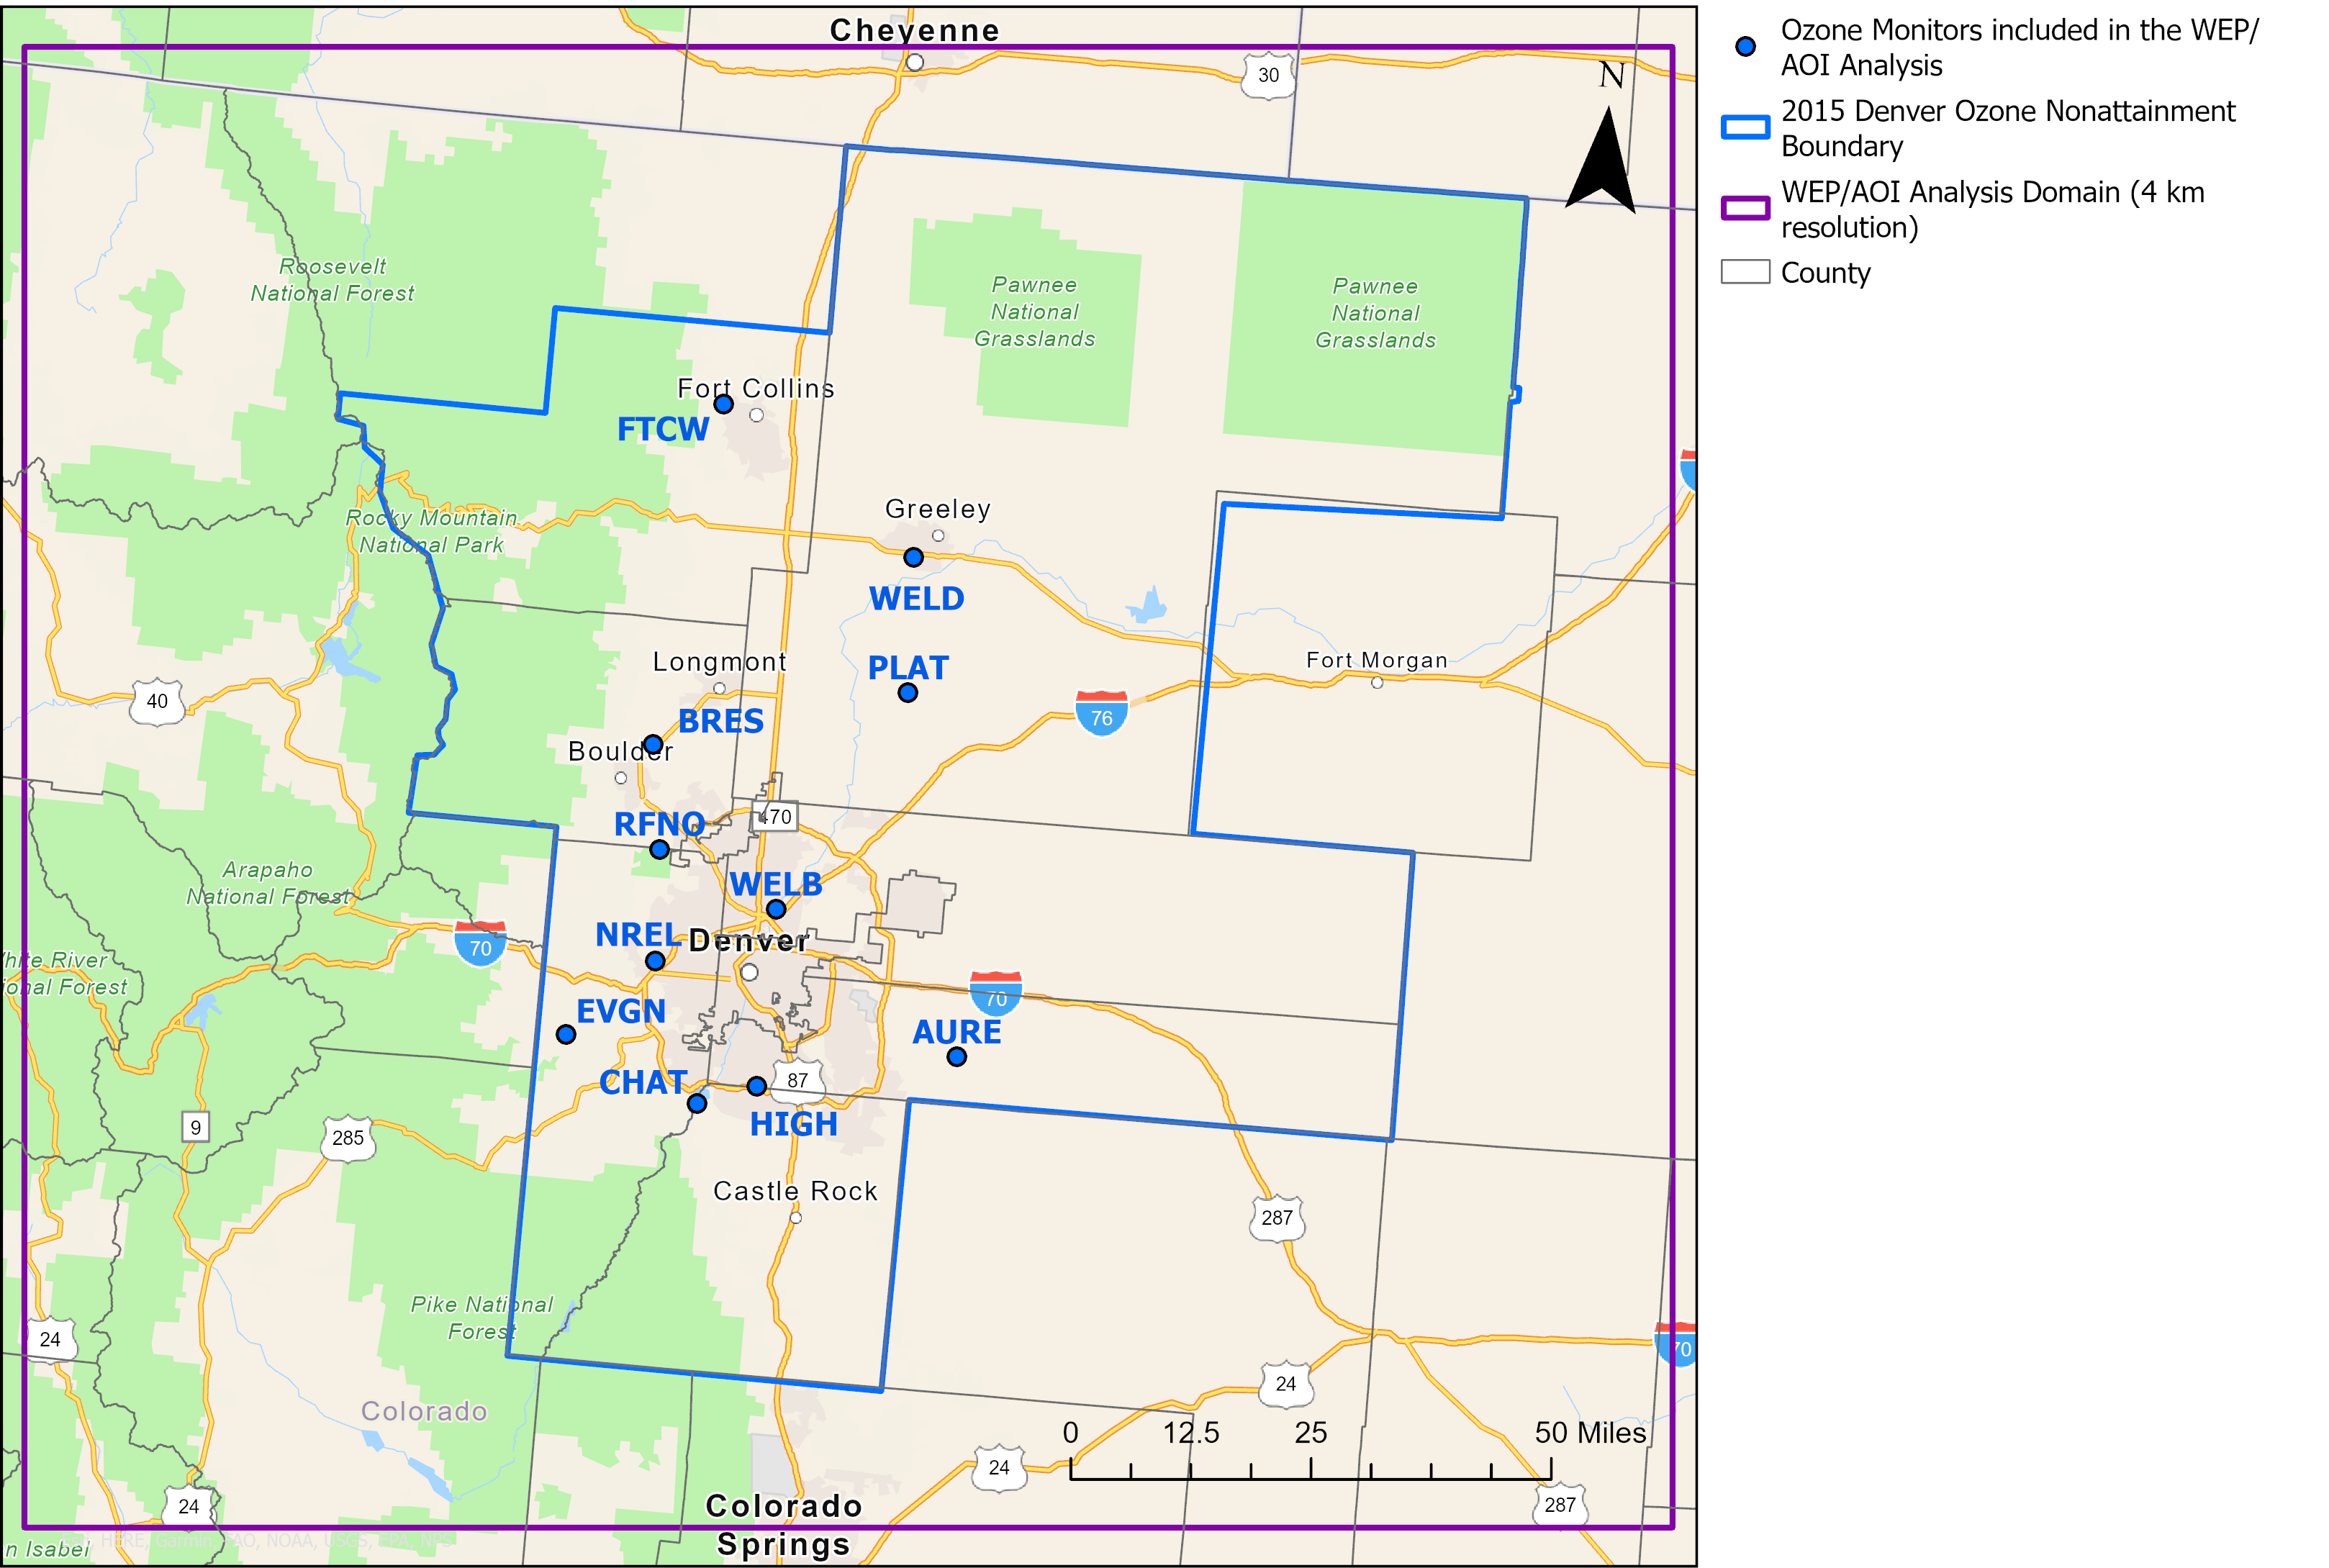
Figure 2.Map of the analysis domain and ozone monitors.
Selection of Elevated Ozone Days
The ozone monitoring data collected and quality assured by the Colorado APCD was obtained from the Environmental Protection Agency's (EPA) Air Quality System (AQS) to identify high ozone days. The days with MDA8 greater than or equal to 70 ppb at each site during June to August each year between 2016 and 2022 were identified and selected for analysis. Table 1lists the number of high ozone days for each monitoring site. PLAT started on June 12, 2020 and EVGN started on October 7, 2020.
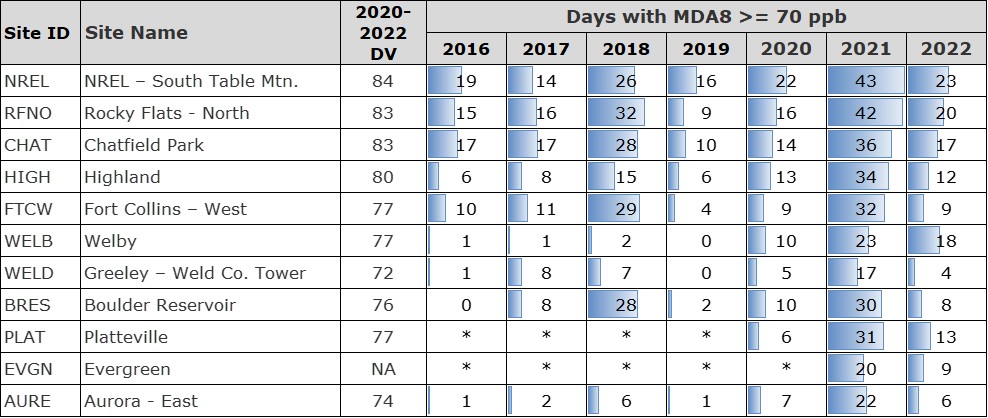
Table 1.Number of high ozone days for each ozone monitor in each year (June to August) from 2016 to 2022.
HYSPLIT Back Trajectory Modeling
The HYSPLIT model was used to calculate 48-hour back trajectories arriving on each of the high ozone days at three times per day (13:00, 15:00, and 17:00 local standard time) and at three heights above the ground (10 meter (m), 100 m, and 300 m). The High-Resolution Rapid Refresh (HRRR) meteorological data was downloaded for 2016 to 2022 from the National Oceanic and Atmospheric Administration (NOAA) Air Resources Laboratory FTP server for use in the HYSPLIT model. The HRRR data is output hourly and covers CONUS at 3 km grid resolution. The HYPSLIT model was configured to provide trajectory endpoints every 10 minutes of the simulation period that were accumulated in the 4-km grid cells to generate a residence time (RT) analysis.
Weighted Emissions Potential (WEP)/Area of Influence (AOI) Analysis
The WEP/AOI analysis products are provided for the combined analysis in which data from all three trajectory heights (i.e., 10, 100 and 300 m) are aggregated. Colorado Department of Public Health & Environment (CDPHE) provided a list of days flagged as influenced by wildfire smoke from 2016-2022 in the Denver non-attainment area. For high ozone days with MDA8 greater than or equal to 70 ppb, analysis was done for each year and all years combined, and an additional analysis that excluded days with smoke flags was conducted. Different MDA8 threshold analysis (i.e., 71 ppb, 76 ppb, and 80 ppb) was performed for days from 2016-2022 combined.
The products include:
-
Plots of residence time (RT) and WEP for each monitor
- MDA8 ≥ 70 ppb, individual year and all years combined (with and without smoke-flagged days)
- MDA8 ≥ 71 ppb, all years combined
- MDA8 ≥ 76 ppb, all years combined
- MDA8 ≥ 80 ppb, all years combined
- Plots of the gridded 2026 NOx and VOC emissions used in the WEP analysis for each of the source sectors described below.
Descriptions of each analysis product are provided in the following sections.
Residence Time (RT)
The RT folder contains plots showing the AOI that back trajectories of air parcels traveling from a given location arrived at an ozone monitor on high ozone days from 2016 to 2022. HYSPLIT 48-hour back trajectories are calculated to arrive on each of the ozone monitors three times a day (13:00, 15:00, and 17:00 local standard time) and at three heights above the ground (10, 100 and 300 m). Residence time is calculated as the percent of the total residence time across all trajectories in each grid cell.
Plots are provided for the combined analysis in which data from all trajectory heights are aggregated (All height). RT plots for the high ozone days (MDA8 ≥ 70 ppb) in 2016 and all years combined at NREL are provided as examples in Figures 3 and 4, respectively. The blue star indicates the site location. All results for Residence Time and Weighted Emission Potential are available at the link immediately below:
Residence Time and Weighted Emissions Potential Plots
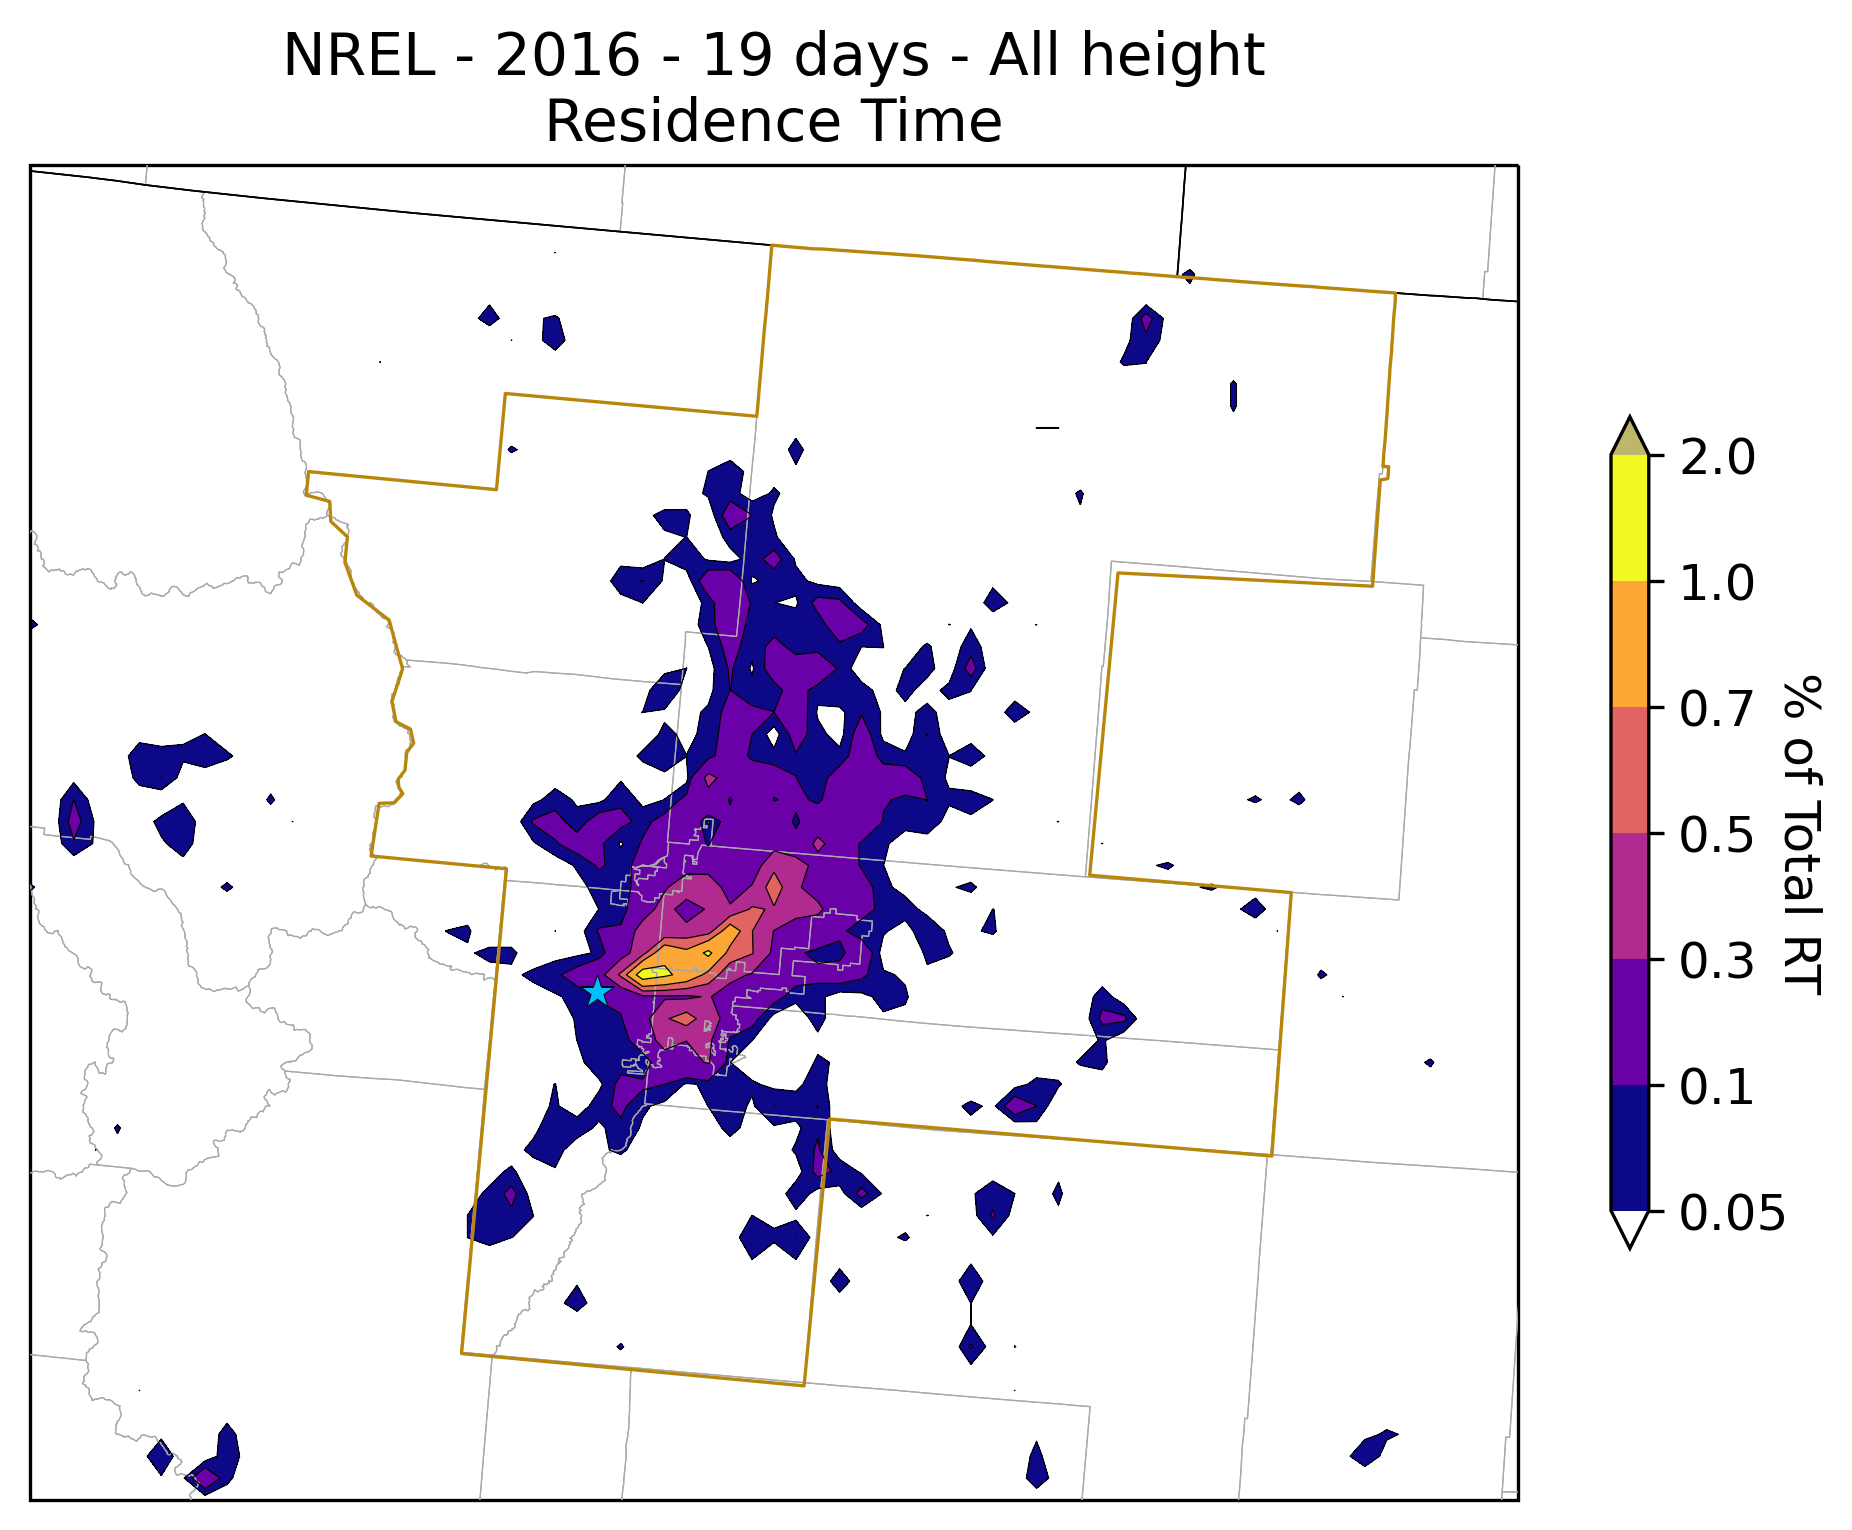
Figure 3.RT analysis for NREL monitoring site and back trajectories that arrive at the site on MDA8 ≥ 70 ppb days for 2016.
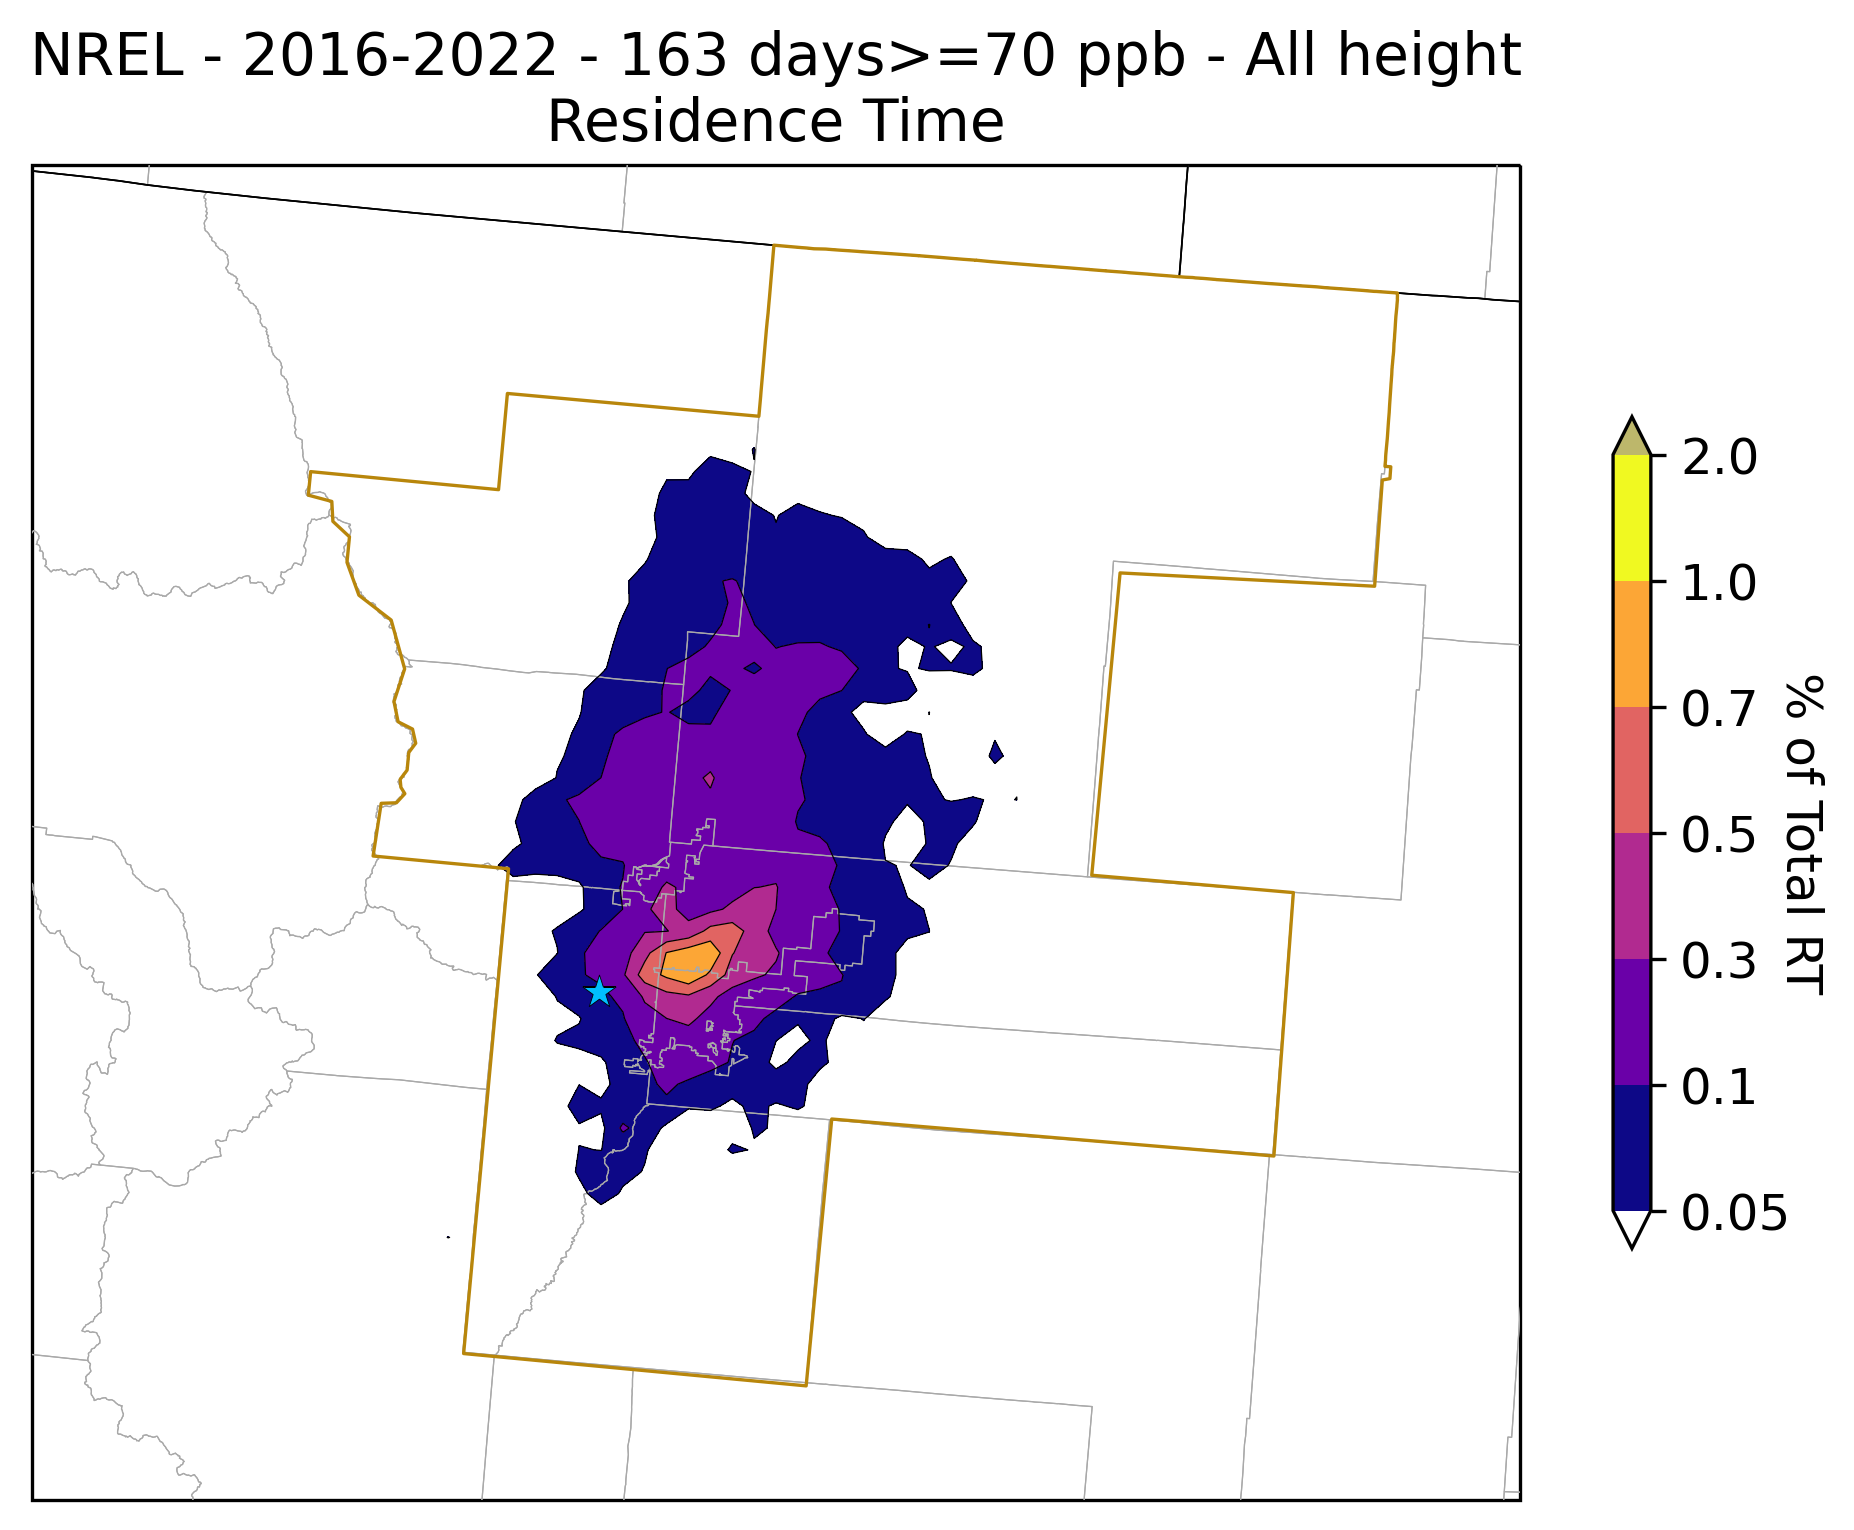
Figure 4.RT analysis for NREL monitoring site and back trajectories that arrive at the site on MDA8 ≥ 70 ppb days for 2016-2022 combined.
Emissions
The WEP analysis was performed using gridded anthropogenic NOx and VOC emissions from Colorado 2026 "On the Books" (OTB) base case emissions, which included reformulated gasoline (RFG) and electric vehicle (EV) sales in model year 2018 and newer years that were not accounted for in the MOVES mobile source emissions model. The modeling episode is from mid-May to August 20, 2016. Emissions were expressed in the unit of tons per day (tpd). The anthropogenic emissions from the nine whole county DM/NFR NAA were aggregated into the following 10 source sectors. Oil and Gas (O&G) Area, O&G Point, and O&G Pre-production that can be combined into Total O&G and all the source sectors would be combined into Total Anthropogenic in the following analysis.
Emissions Plots
- Lawn & Garden Equipment
- Other Non-road Mobile
- On-road Mobile
- Rail
- O&G Area
- O&G Point
- O&G Pre-production
- EGU Point
- Non-EGU Point
- Non-Point
Figure 5 shows gridded 2026 episode NOx emissions from the on-road mobile source sector as an example. All maps of emissions are provided in the Emissions folder.
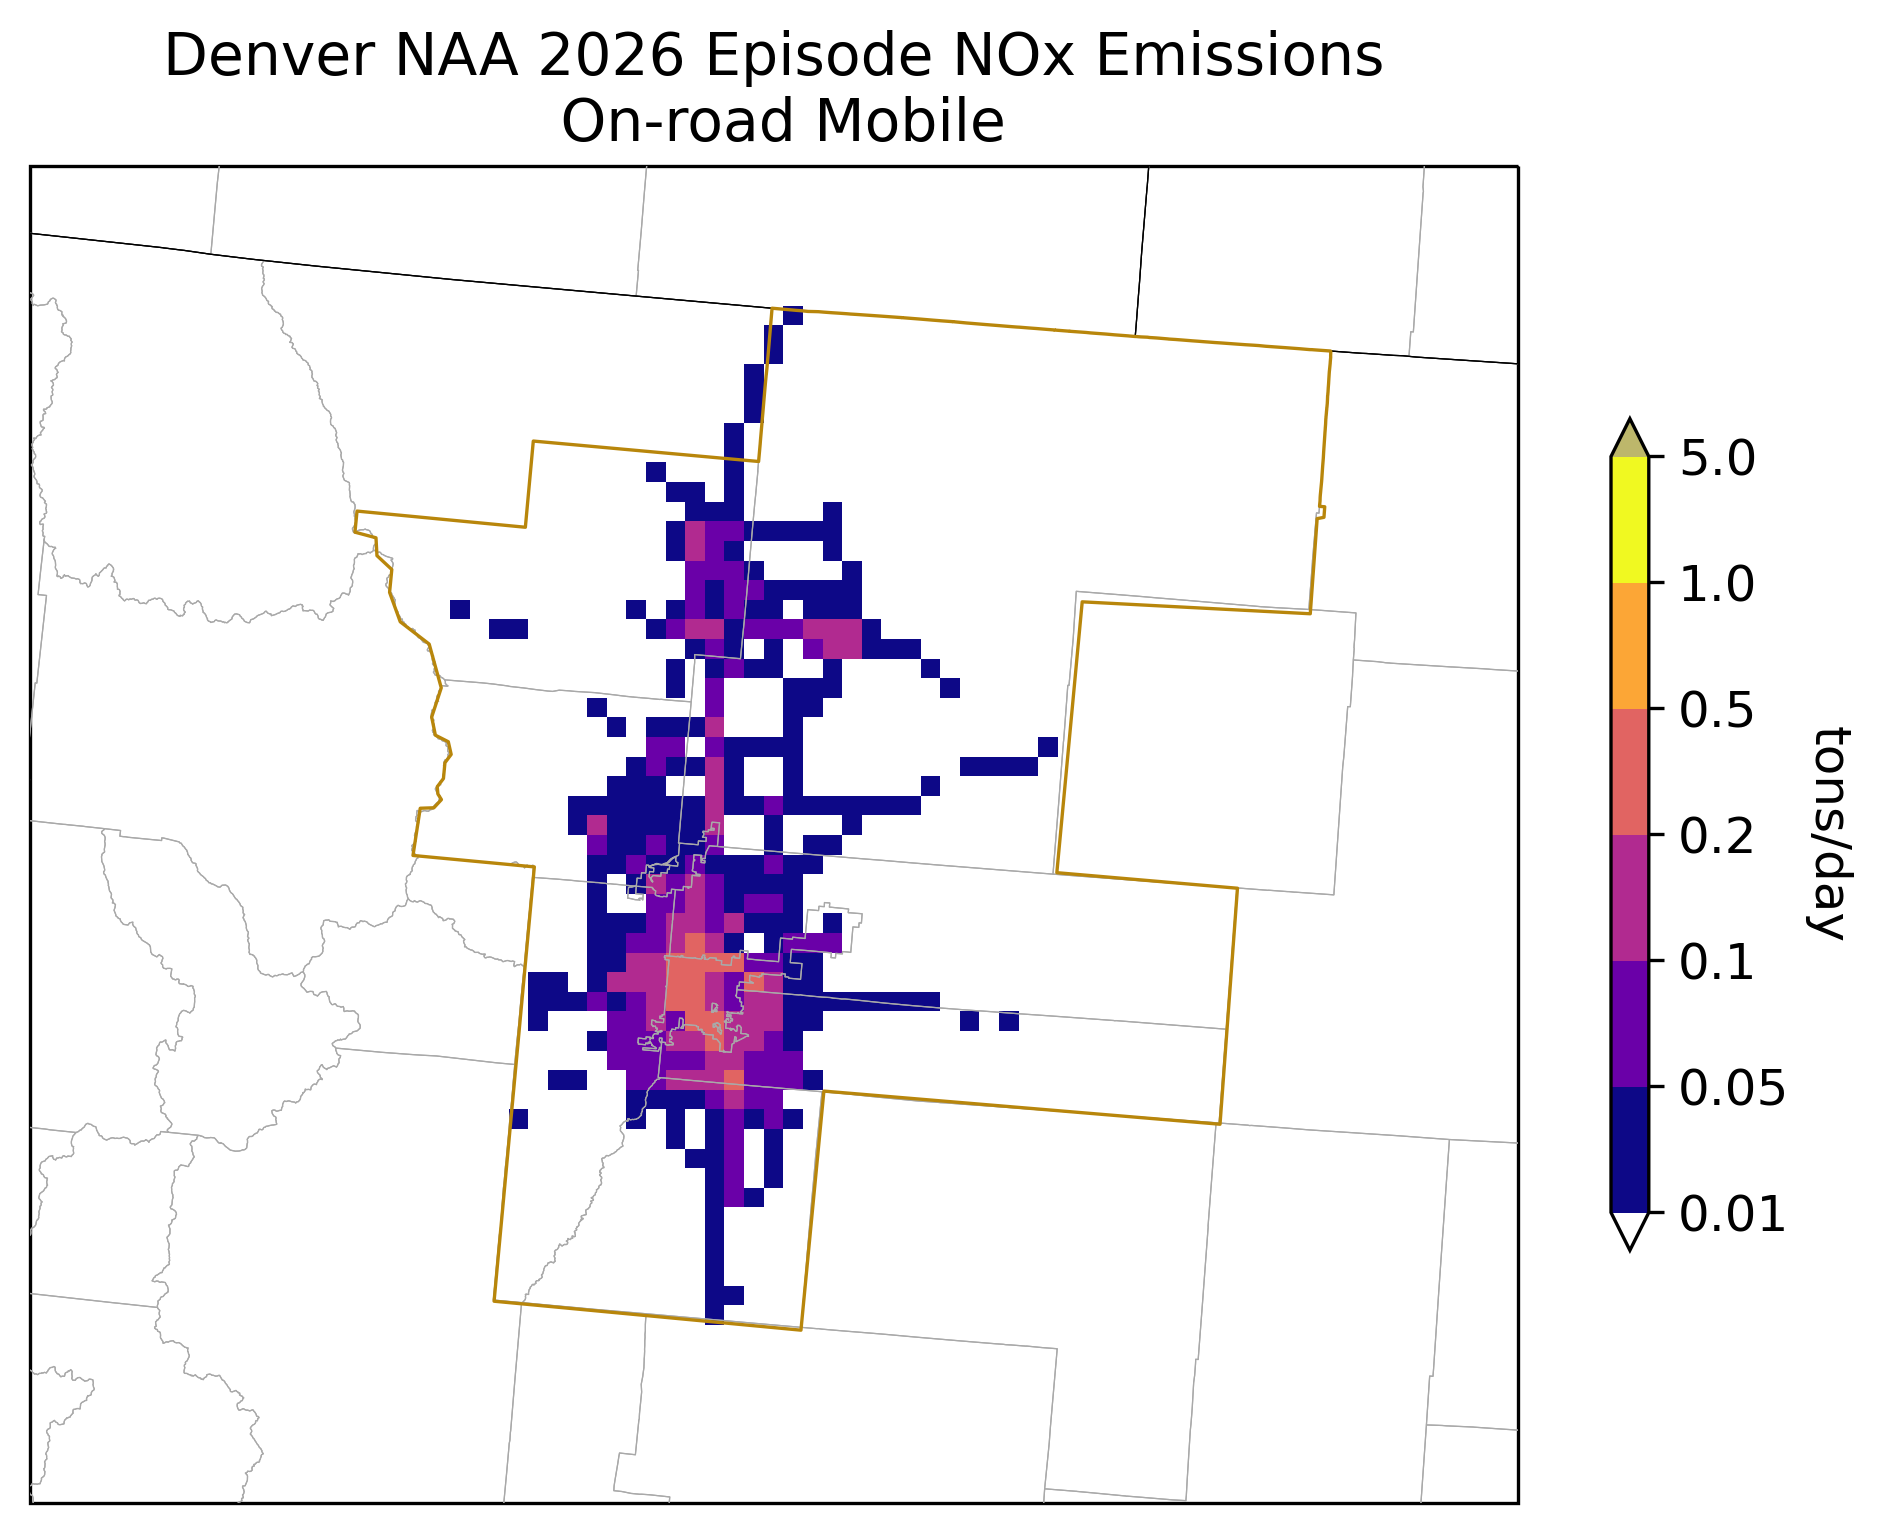
Figure 5.Map of 2026 episode gridded on-road mobile NOx emissions.
Weighted Emissions Potential (WEP)
WEP is obtained by overlaying the RT results with the 2026 NOx or VOC emissions in each grid cell. The gridded WEP values for each source sector are then normalized by the sum of the WEP for the total anthropogenic emissions (Total Anthro) across all grid cells. Using the sum of the total anthropogenic values as a common denominator allows for the WEP results to be compared across source sectors. The WEP folder contains two subfolders corresponding to the two ozone emission precursors: NOx and VOC.
Example plots for NREL and different source sectors are shown in Figures 6, 7, and 8. The dark green and light green isopleths in the WEP plots correspond to the, respectively, 0.5 and 0.1 percent frequency from the corresponding RT results.
Residence Time and Weighted Emissions Potential Plots
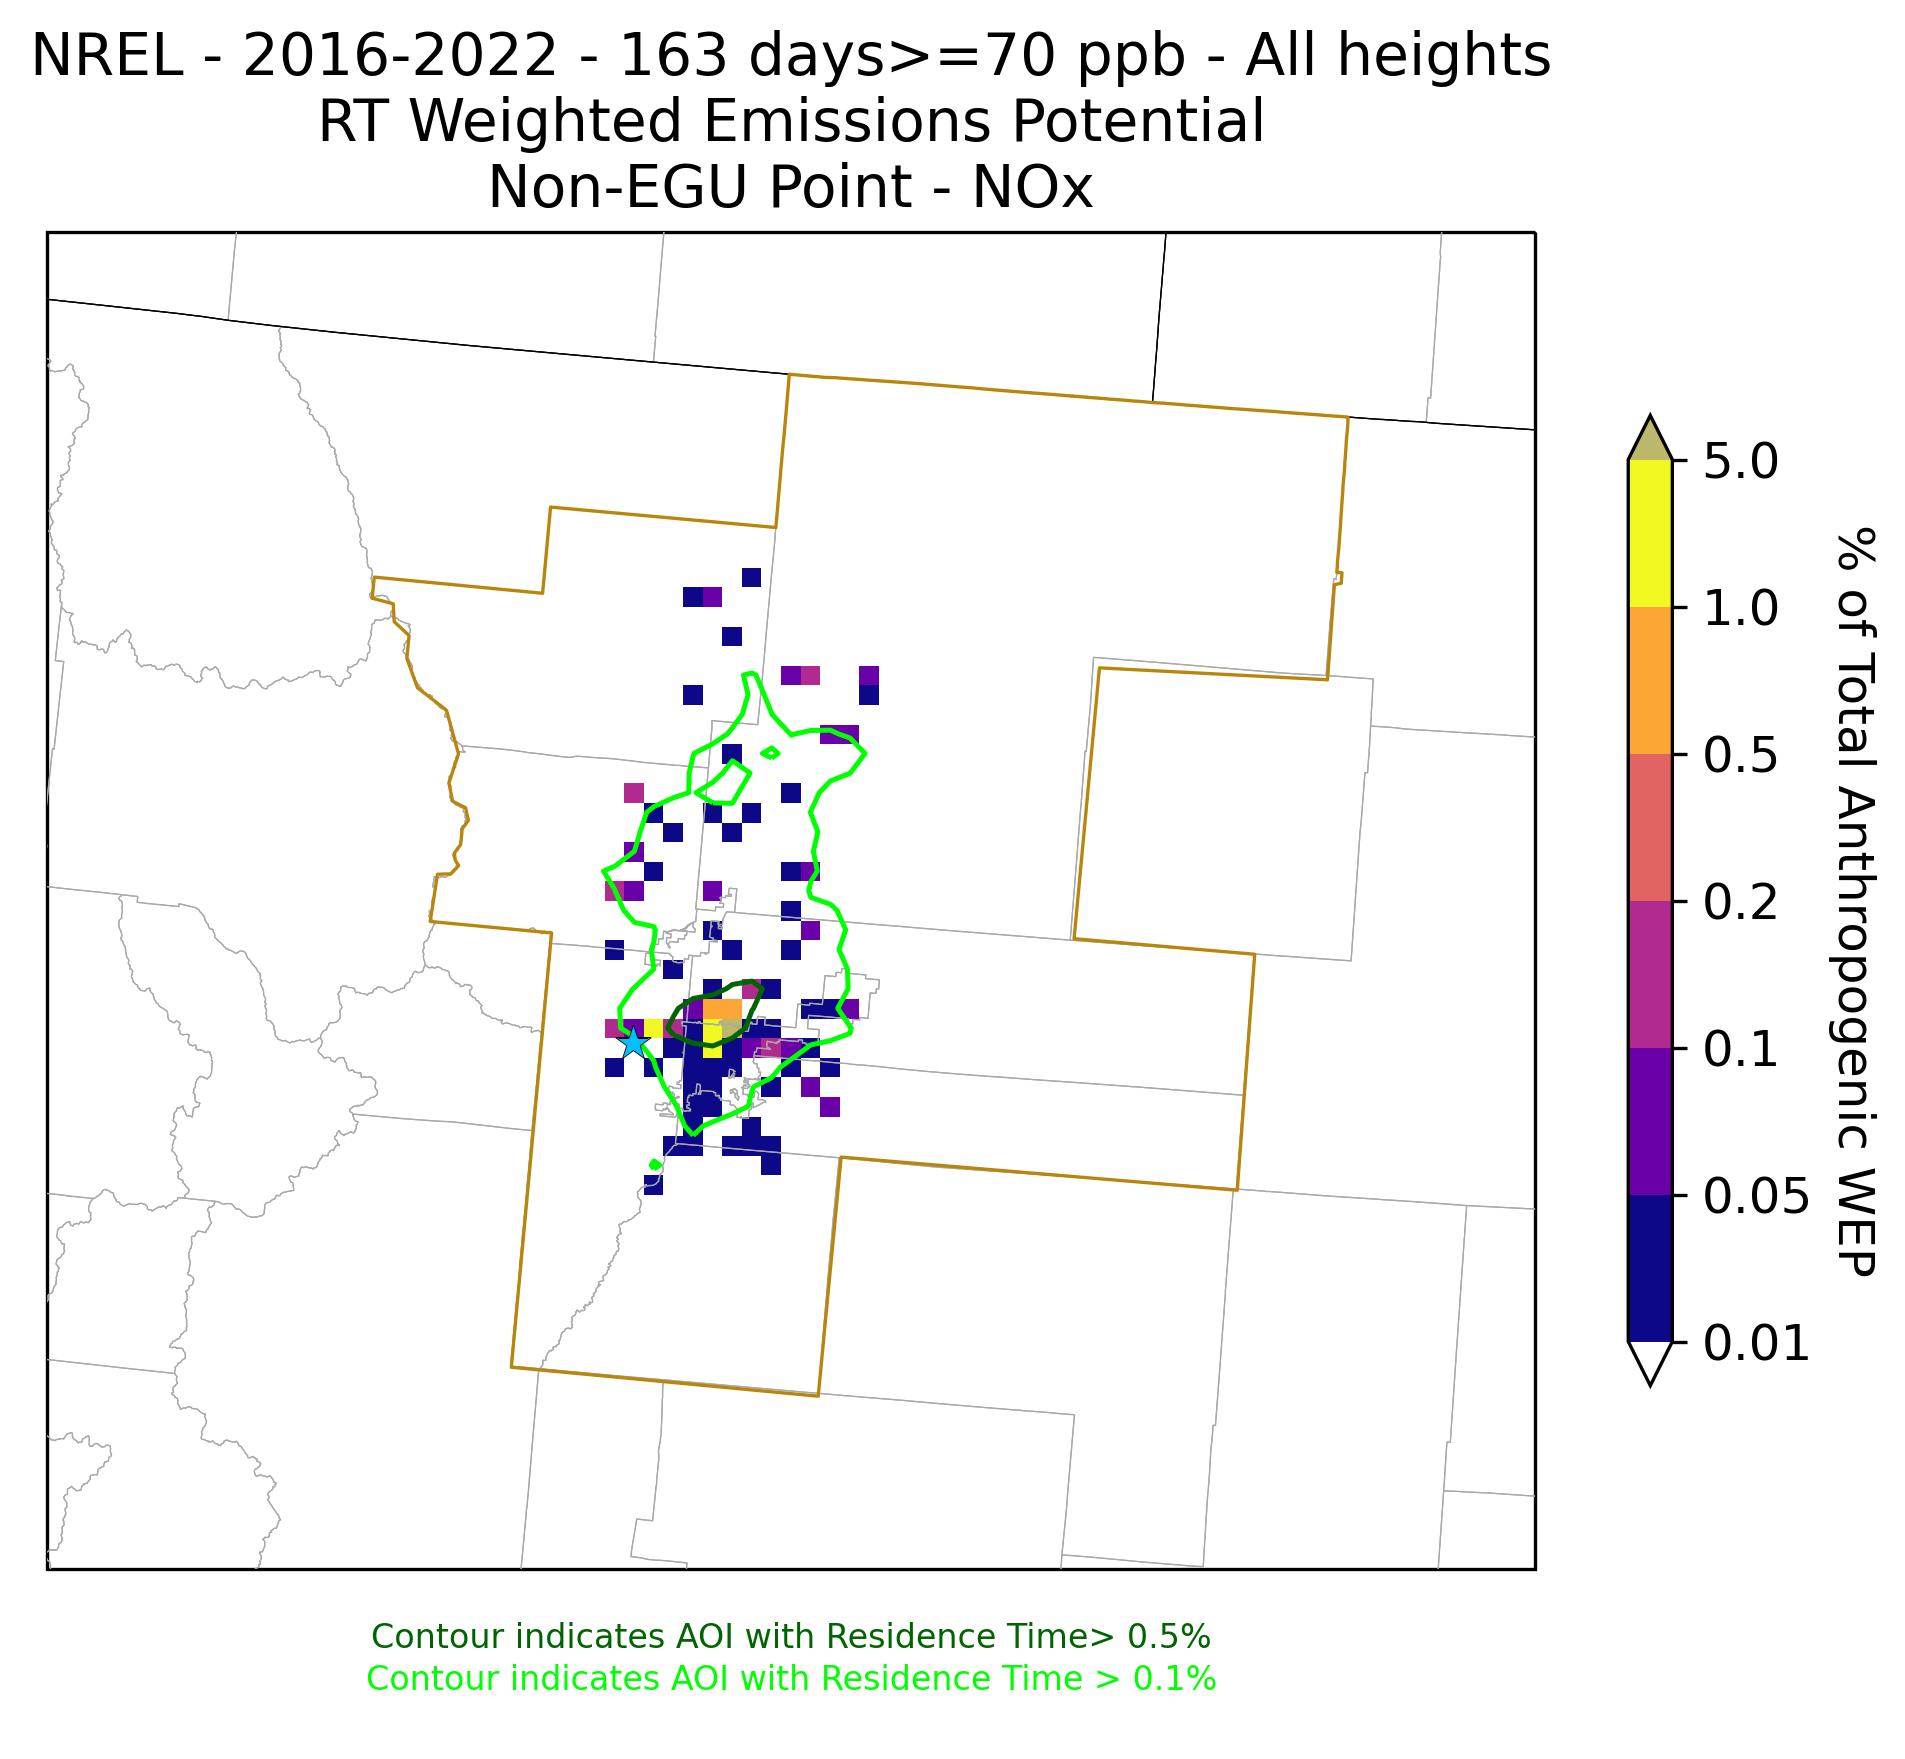
Figure 6.WEP analysis for MDA8 ≥ 70 ppb days during 2016 -2022 at the NREL monitoring site for NOx emissions from Non-EGU Point source sector.
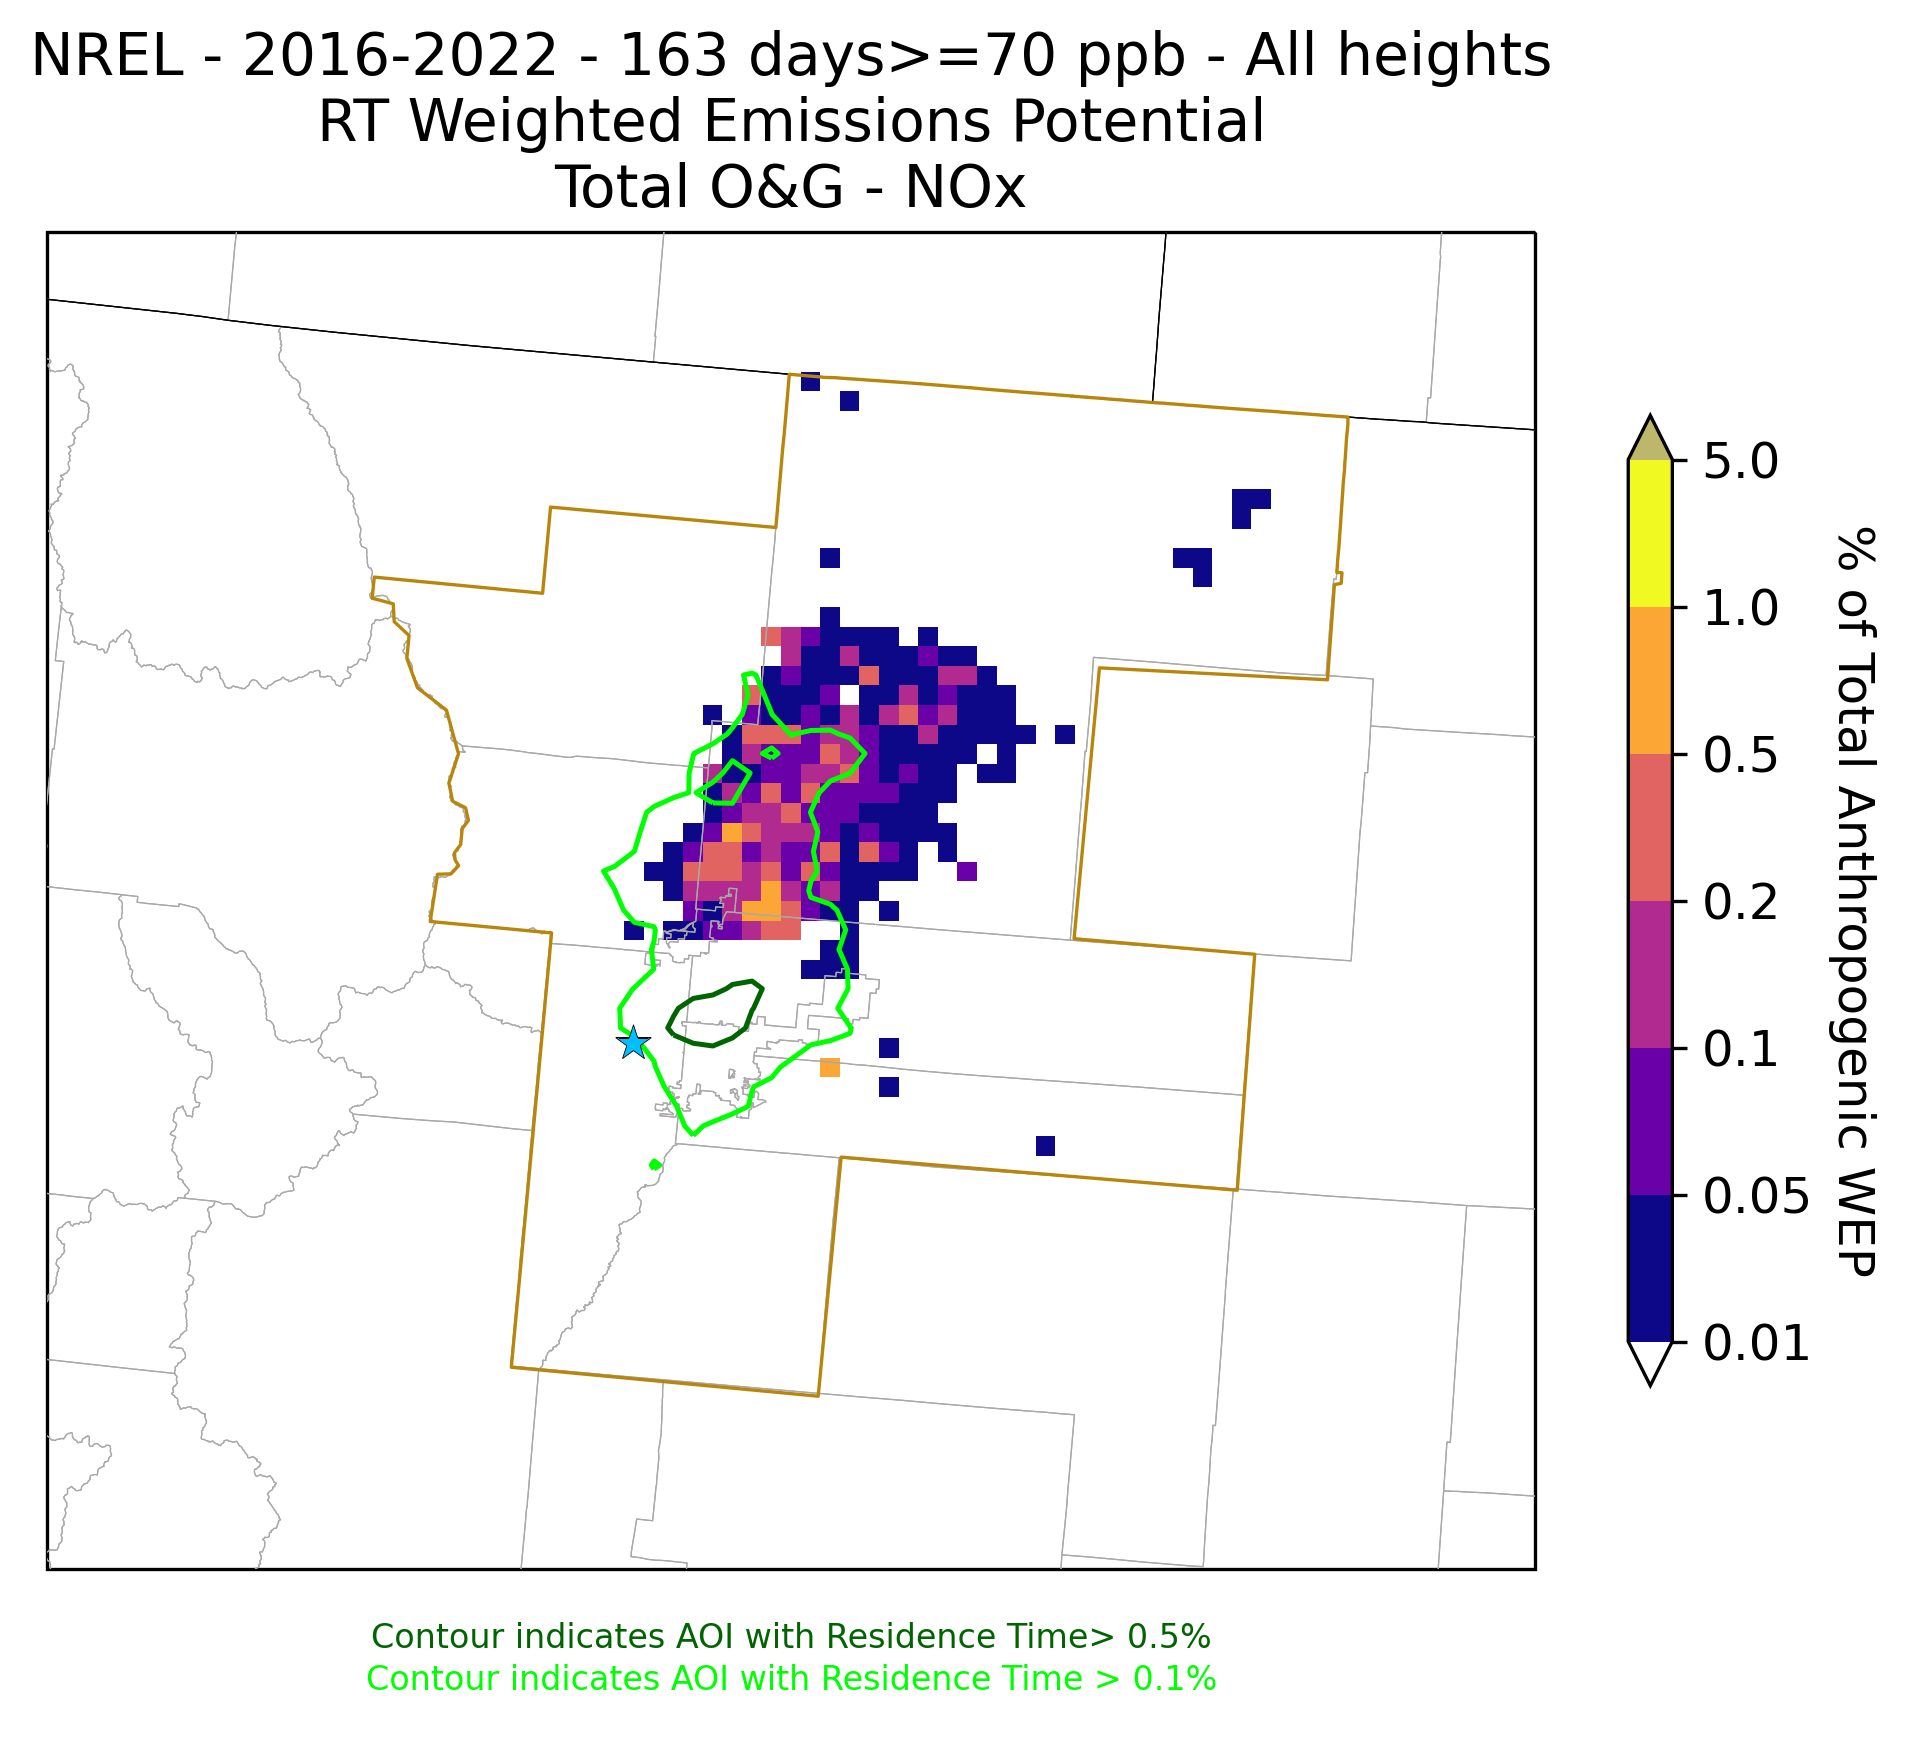
Figure 7.WEP analysis for MDA8 ≥ 70 ppb days during 2016 -2022 at the NREL monitoring site for NOx emissions from Total O&G source sector.
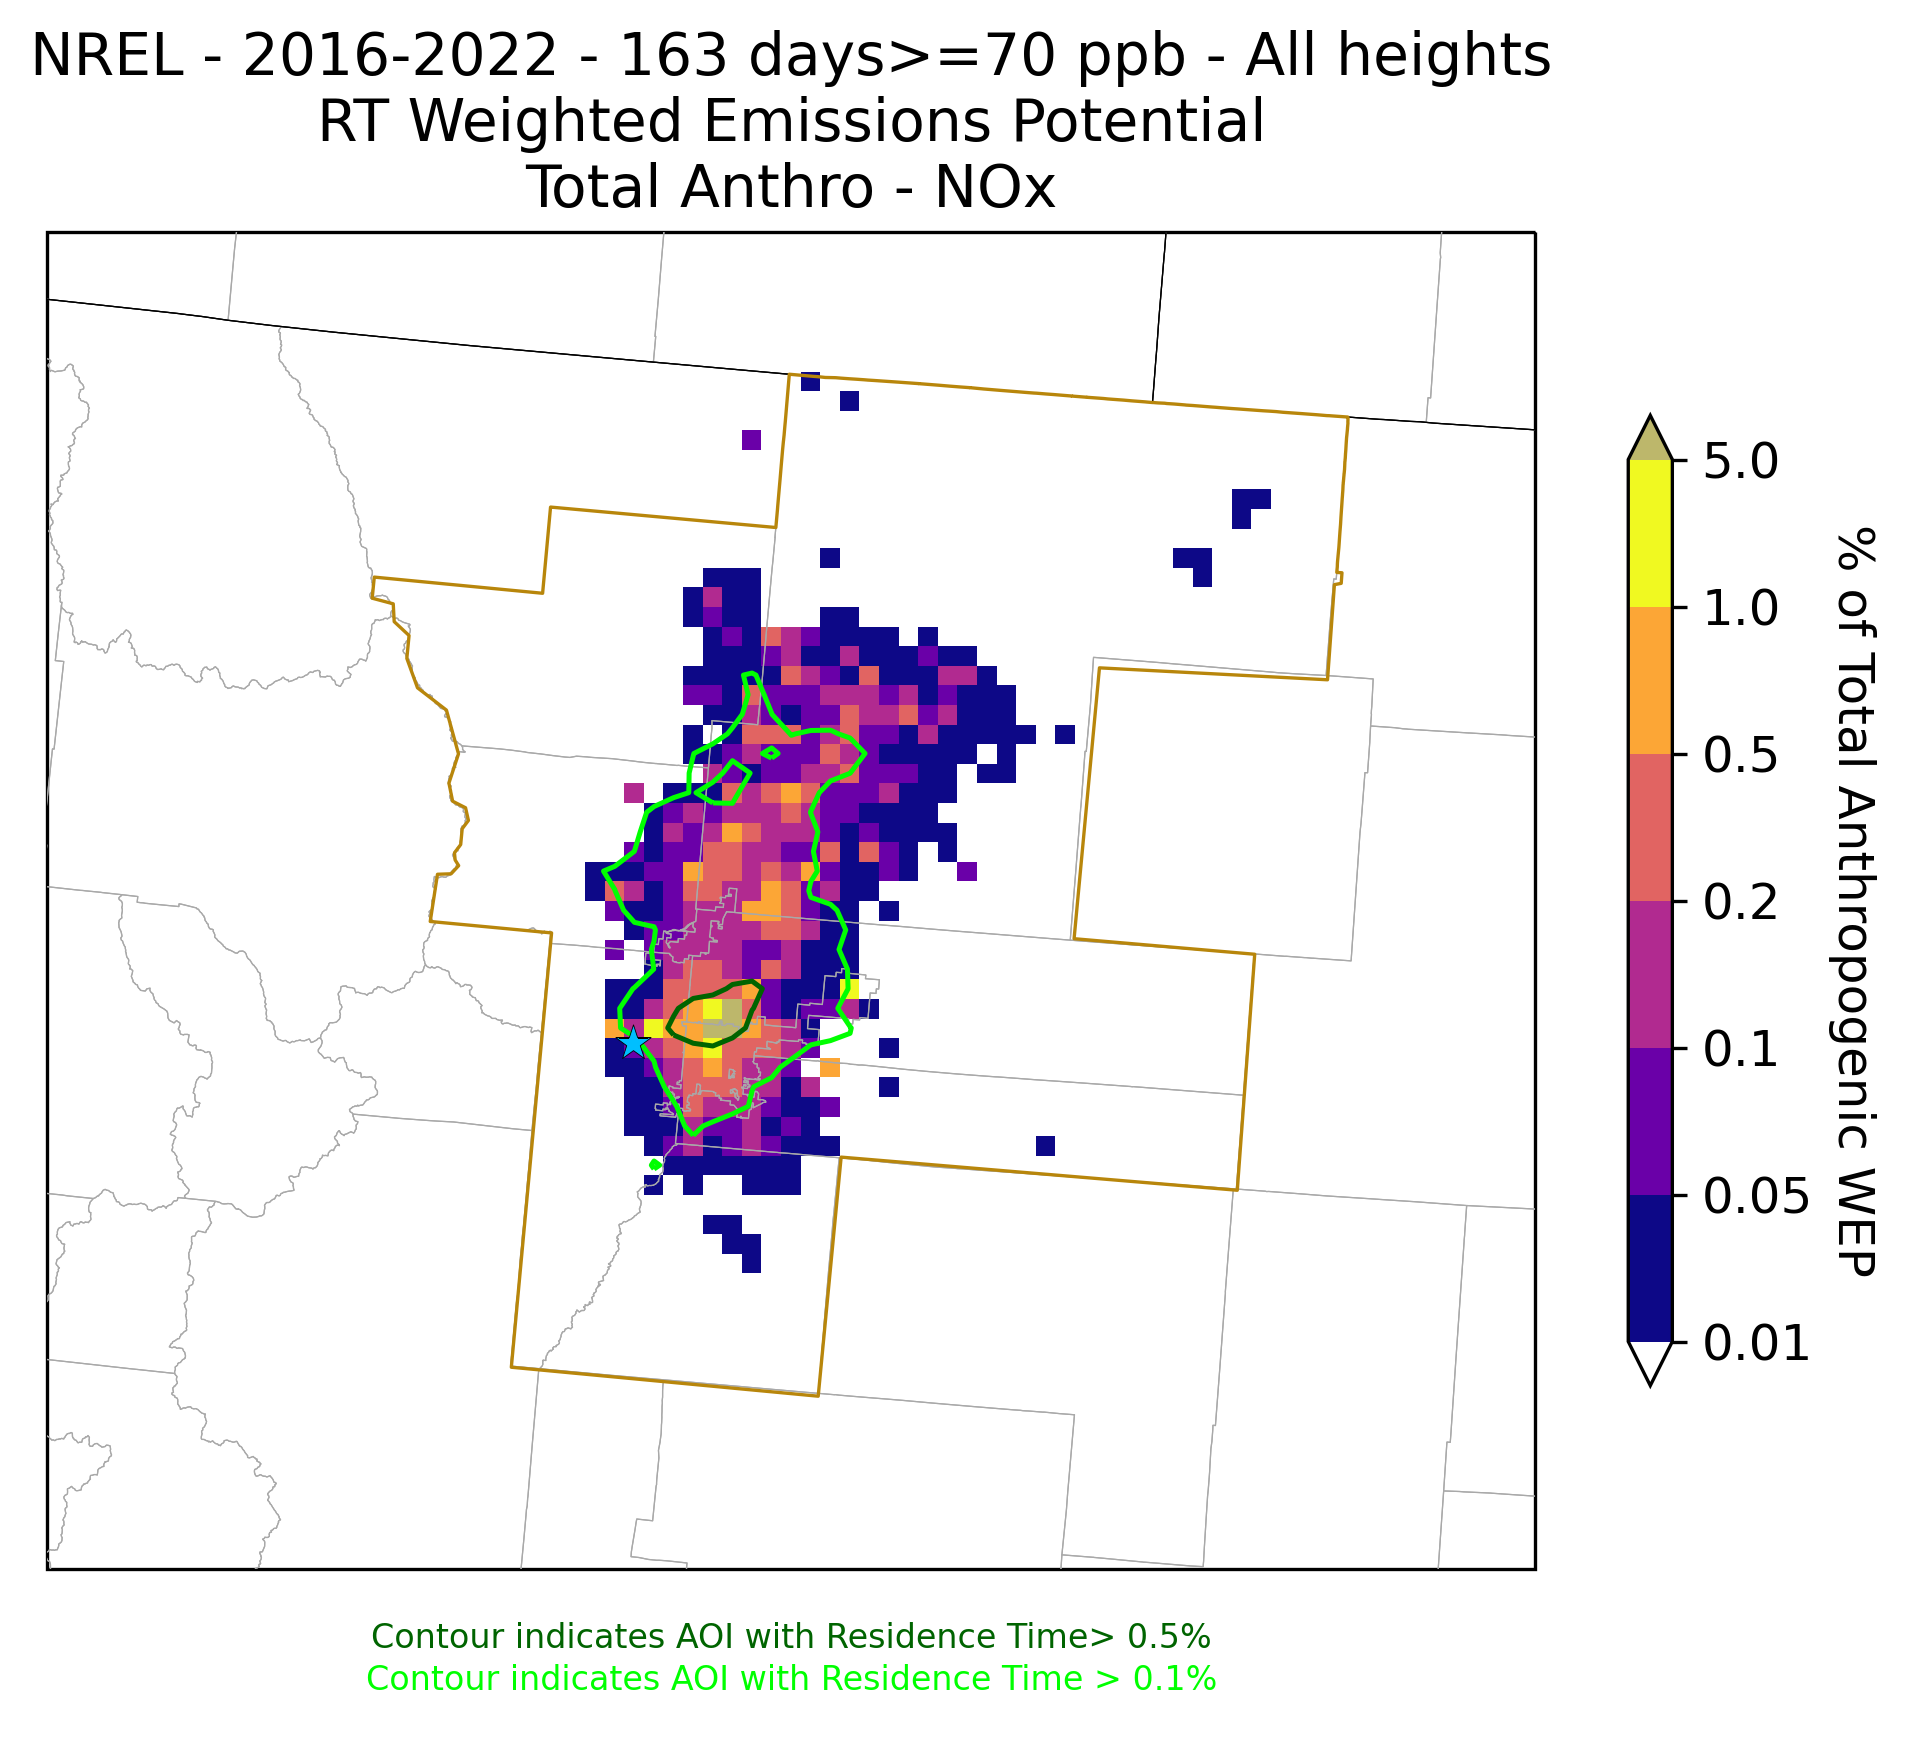
Figure 8.WEP analysis for MDA8 ≥ 70 ppb days during 2016 -2022 at the NREL monitoring site for NOx emissions from Total Anthropogenic source sector.
Potential Source Contributions (PSC) Analysis
A PSC analysis was performed to assess the relative potential contributions of anthropogenic emission source groups within the analysis domain. PSC was calculated by integrating (i.e., summing) the WEP for each source group across the analysis domain. It shows the potential contribution of each source sector relative to the total anthropogenic contribution. The same 2026 emissions were used in the PSC analysis. An evaluation of potential control scenarios will also be performed to assess potential impacts of strategies once they are more clearly defined.
Pie charts showing the PSC for each source group as a percentage of the total are provided in spreadsheets. Figure 9 shows an example of a pie chart for the NREL monitoring site on high ozone days in 2022. All results for Potential Source Contributions are available at the link below:
Potential Source Contribution (PSC) Spreadsheets
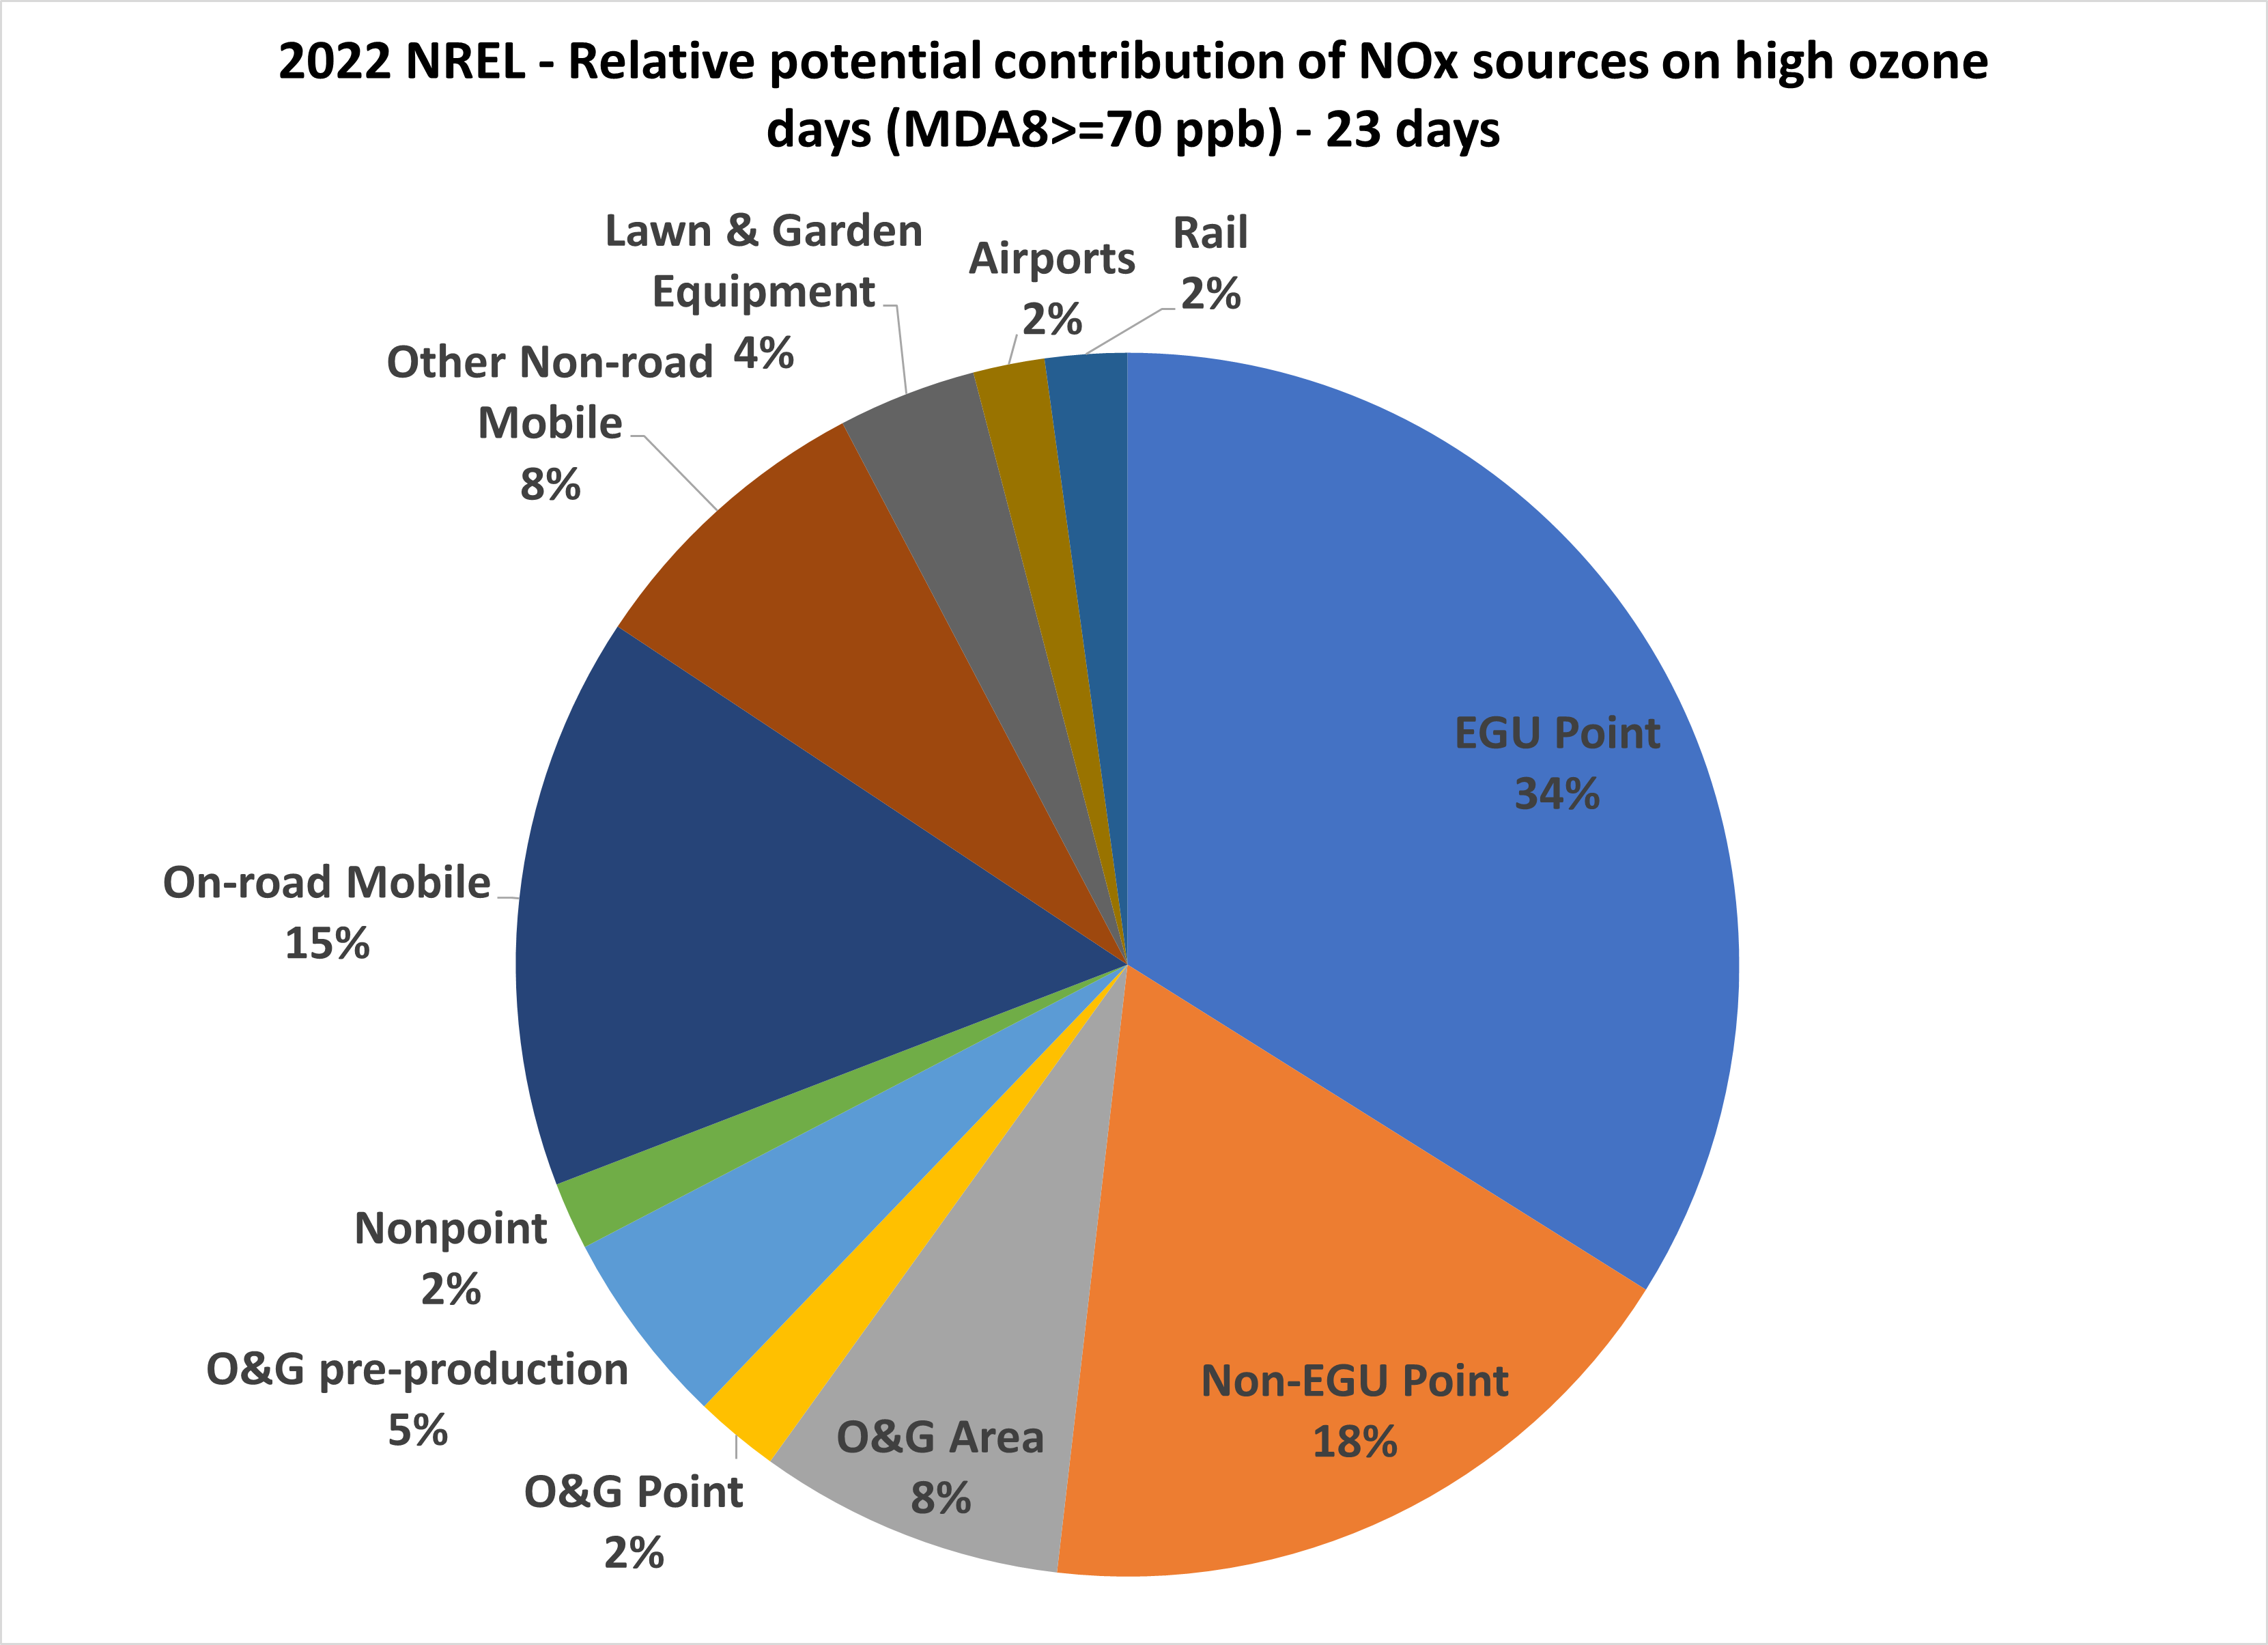
Figure 9.PSC by source sector for the NREL monitoring site on MDA8 ≥ 70 ppb days in 2022.
Directory Structure
The RT, WEP, and Emissions plots, and PSC spreadsheets are provided at the link below using the directory structure shown below with CHAT as an example.
├──Emissions
│ ├──NOX
│ └──VOC
├──Figures
├──PSC
├──RT_WEP
│ ├──MDA8_70ppb
│ │ └──CHAT
│ │ ├──2016
│ │ │ ├──RT
│ │ │ └──WEP
│ │ │ ├──NOX
│ │ │ └──VOC
│ │ ├──2017
│ │ ├──2018
│ │ ├──2019
│ │ ├──2020
│ │ ├──2021
│ │ ├──2022
│ │ ├──All_years
│ ├──MDA8_71ppb
│ │ └──CHAT
│ │ ├──All_years
│ │ │ ├──RT
│ │ │ └──WEP
│ │ │ ├──NOX
│ │ │ └──VOC
│ ├──MDA8_76ppb
│ ├──MDA8_80ppb
Denver WEP-AOI 2023 — All Resources
- Stein, A.F., Draxler, R.R, Rolph, G.D., Stunder, B.J.B., Cohen, M.D., and Ngan, F., (2015). NOAA's HYSPLIT atmospheric transport and dispersion modeling system, Bull. Amer. Meteor. Soc., 96, 2059-2077,http://dx.doi.org/10.1175/BAMS-D-14-00110.1
- Rolph, G., Stein, A., and Stunder, B., (2017). Real-time Environmental Applications and Display sYstem: READY. Environmental Modelling & Software, 95, 210-228,https://doi.org/10.1016/j.envsoft.2017.06.025