WAQS Phase II Source Apportionment Modeling
WAQS Phase II Source Apportionment (SA) Modeling
Abstract
Phase II of the Western Air Quality Study (WAQS) conducted three rounds of ozone and particulate matter (PM) source apportionment (SA) modeling using the CAMx 2011 modeling platform: (1) geographic region state-specific anthropogenic emissions; (2) source-sector-specific; and (3) “Clean” runs to obtain United States and North American Background (USB and NAB). The ozone and PM SA results were extracted at monitoring sites and across a 36 km resolution virtual monitoring network for the WESTUS in CSV files. A SA visualization tool was developed to display the Round 1 and 2 ozone SA modeling results.Overview
The WAQS Phase II ozone and PM source apportionment (SA) modeling was conducted using the Comprehensive Air-quality Model with extensions (CAMx) photochemical grid model (PGM) Ozone Source Apportionment Technology (OSAT) and Particulate Source Apportionment Technology (PSAT). Three rounds of WAQS ozone and PM SA modeling were conducted following the procedures in the August 28, 2015 SA Modeling Plan with the first two rounds of SA modeling focused on geographic region (state-specific) and source-sector-specific ozone and PM contributions within the continental U.S. (CONUS) 36 km modeling domain. The third round of SA modeling was left open in the SA Modeling Plan and was ultimately used to examine United States and North American Background (USB and NAB) ozone and PM concentrations. A brief description of the CAMx OSAT/PSAT source apportionment tools is provided in the SA Modeling Plan with more details provided in Chapter 7 of the CAMx User’s Guide.The WAQS Rounds 1 and 2 CAMx SA modeling results for Maximum Daily Average 8-Hour (MDA8) ozone and 24-hour fine particulate matter (PM2.5) were extracted at ozone or PM monitoring sites throughout the U.S. In addition, because of the spare monitoring networks in the western U.S. (WESTUS), the MDA8 ozone and 24-hour PM2.5 SA results were extracted across a virtual monitoring network across the WESTUS using a 36 km resolution. The Rounds 1 and 2 SA MDA8 ozone and 24-hour PM2.5 modeling results are available at all sites and days of the 2011 modeling year in CSV files. In addition, the Rounds 1 and 2 MDA8 ozone SA modeling results can be displayed through a web-based SA Visualization Tool.
WAQS Round 1 SA: Geographic Region Source Apportionment Modeling
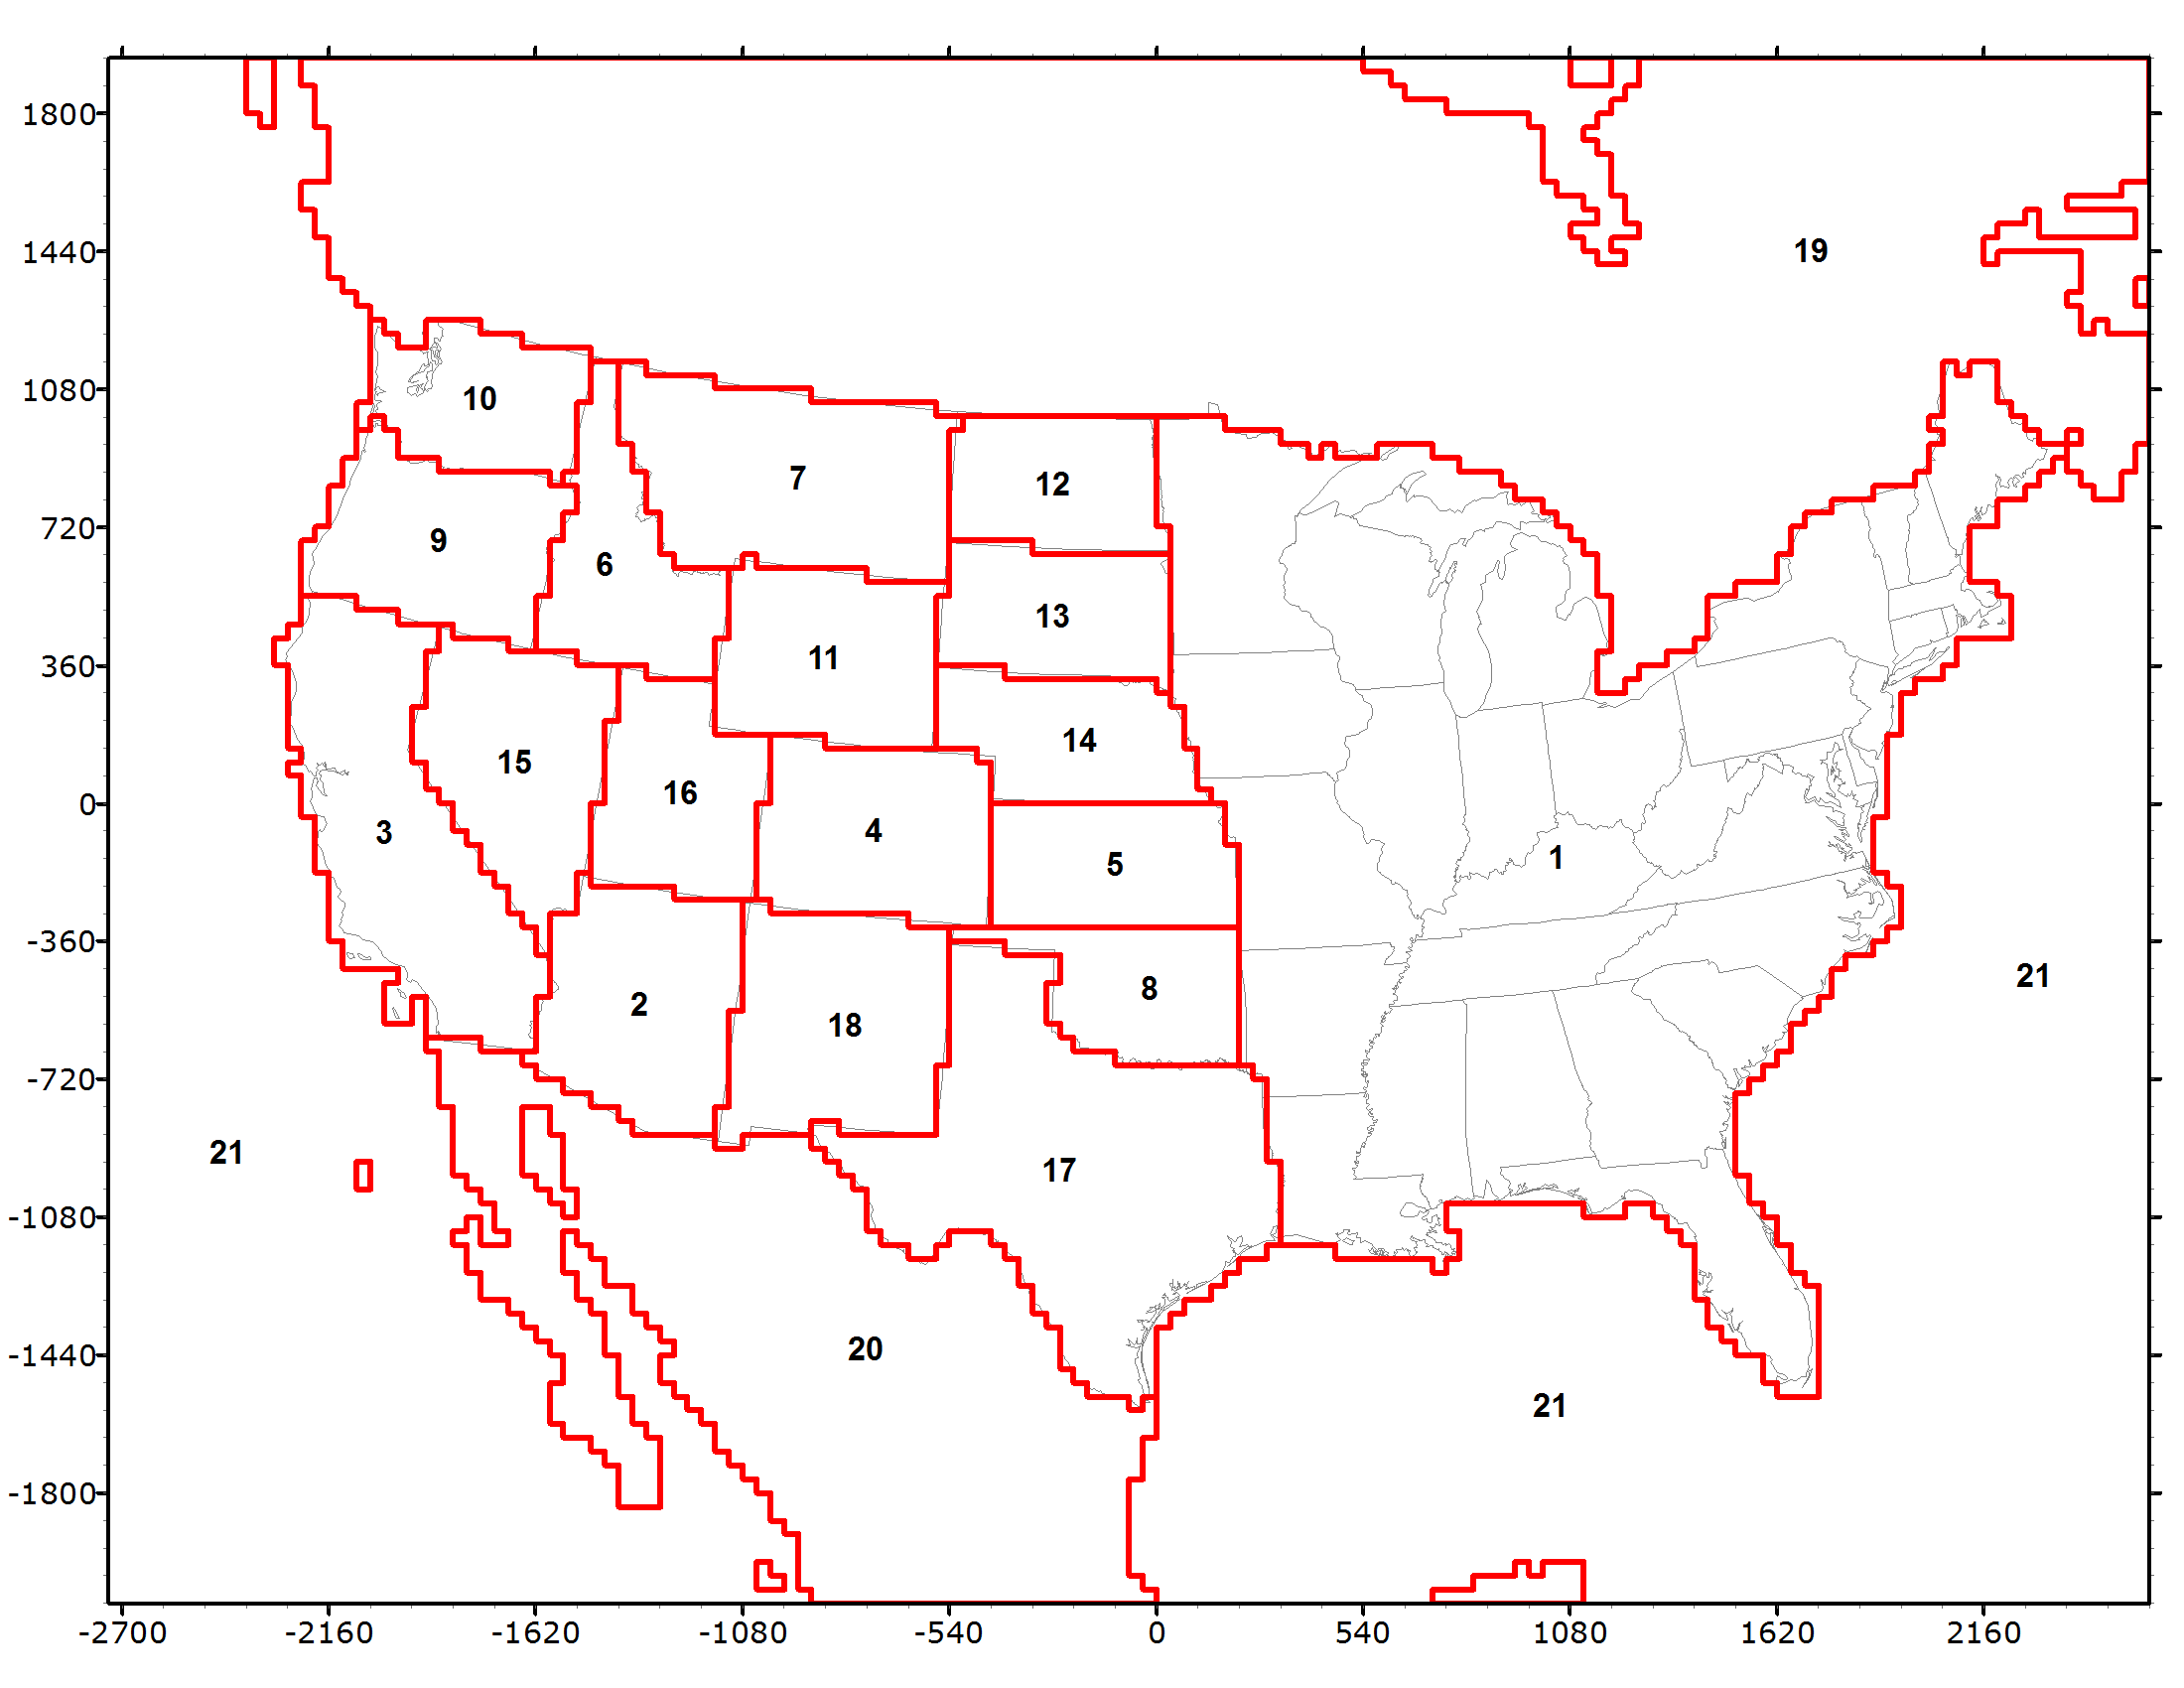
The WAQS Round 1 SA modeling used the WAQS 2011a Modeling Platform to estimate the contributions of western states’ anthropogenic emissions to downwind ozone and PM2.5 concentrations across the CONUS domain in a similar manner to that used by EPA in the Cross State Air Pollutions Rule (CSAPR) only under 2011a base case emission instead of future year emission conditions. The Round 1 Geographic Region SA modeling was run with 21 Source Regions as shown below that corresponding to: (a) grid cell definitions of 17 western states; (b) the remainder of the eastern U.S. states (EUSA); (c) Canada (CAN); (d) Mexico (MEX); and (e) Offshore Shipping and oil and gas sources (OSS). The WAQS Round 1 SA modeling obtained separate contributions for the 21 Source Regions and 4 different Source Sectors as follows:- ANT = Anthropogenic Emissions
- NAT = Natural Emissions (biogenic VOC and NOx, lighting NOx; sea salt and windblown dust PM)
- WF = Wildfires
- RX = Prescribed burns
- AG = Agricultural burning
Source contributions are also obtained for Initial Concentrations (IC) and Boundary Conditions (BC) that are the concentrations around the boundaries of the CONUS 36 km modeling domain that were based on the MOZART Global Chemistry Model (GCM).
/source apportionment/R1_SA_source_regions.png
