WAQS 2011b Platform Future Year Emissions
Introduction
The WAQS 2011b modeling platform includes a future projection year for estimating the impacts of future emissions on air quality in the Intermountain West. Emissions projections are only available for the anthropogenic emissions sectors; the natural emissions sectors, including fires, are held constant at the 2011 levels.Although the projection year for the WAQS 2011b modeling platform is identified as 2025, some of the inventory sectors are projected to other years. This page summarizes the years and data providers of the WAQS 2011b platform future emissions.
2011b Inventory Data
Descriptions of the processing sector abbreviations are available on the WAQS 2011b Base Year Emissions wiki.
3SAQS Phase II Oil and Gas Emissions
WAQS Processing Sectors: arog, ptog
Year(s): 2015, 2020
Data Provider: Ramboll Environ
The majority of the oil and gas basins covered by the 3SAQS Phase II inventory are projected from the year 2011 to 2020. The Williston and Great Plains Basin inventories are projected from 2011 to 2015. These data were developed for the 3SAQS and WAQS by Ramboll Environ.
In December 2015, the Denver-Julesburg Basin projection year inventory was adjusted to reflect recent updates to the activity and control data available from CDPHE. These adjustments lead a net decrease in the 2020 emissions for sources in this D-J Basin, with particularly large decreases in VOC emissions relative to the 3SAQS Phase II projections. Details about the 2020 D-J Basin inventory are available in the Western Air Quality Study 2011b Modeling Platform O&G Emissions Inventory Updates Memo.
Other U.S. Anthropogenic Emissions
WAQS Processing Sectors: c1c2rail, c3marine, fdust, nonpt, ft, lv, rwc, nonroad, onroad, usarog, usptog, ptcem, ptncem, ptsecaYear(s): 2025
Data Provider: US EPA
The rest of the anthropogenic emissions for the WAQS 2011b platform are projected to the year 2025, including oil and gas emissions for the basins outside of the 3SAQS Phase II inventory. These data were taken directly from the EPA 2011v2 modeling platform.
Canada Anthropogenic Emissions
WAQS Processing Sectors: canar, canmb, nusptYear(s): 2010
Data Provider: US EPA/Environment Canada
The Canadian inventories are held constant at 2010 levels because there were no future year Canadian inventories available as part of the NEI platform..
Mexico Anthropogenic Emissions
WAQS Processing Sectors: mexar, mexmb, nusptYear(s): 2025
Data Provider: US EPA/SEMARNAT/ERG, Inc.
The Mexico inventories are projected from 2008 to 2025 and are based on the latest Mexico NEI developed by SEMARNAT and revised by ERG, Inc.
Natural Emissions
WAQS Processing Sectors: biogenic, wbd, seasalt, lightning, firesYear(s): 2011
Data Provider: Ramboll Environ and Air Sciences (Fires)
The natural emissions are estimated with 2011 meteorology and 2010 or earlier landuse/landcover data. These emissions are held constant at 2011 levels.
Ancillary Data
Most of the ancillary emissions data (gridding, temporal, chemical speciation) for the WAQS 2011b modeling came from the 2011a modeling platform.Emissions Summaries
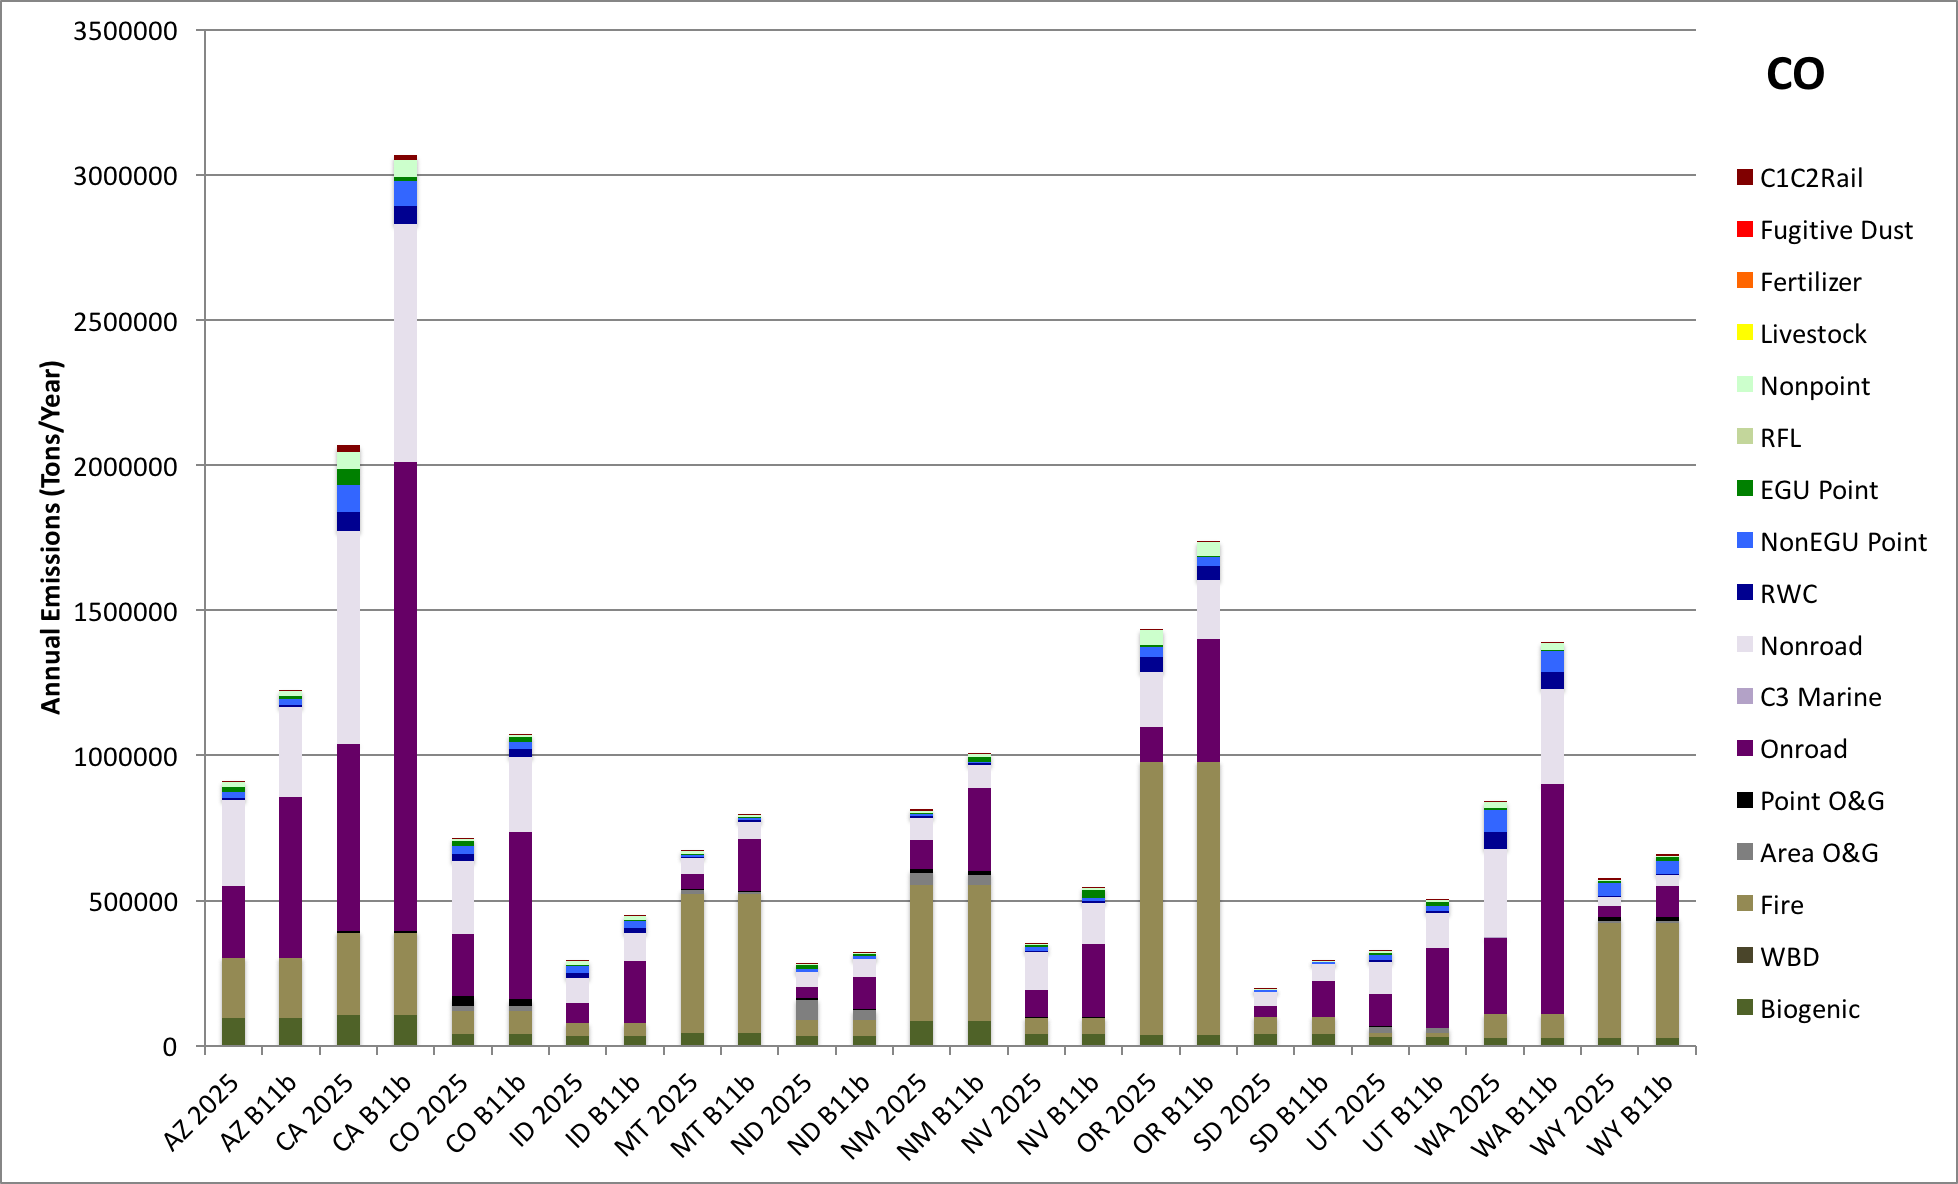
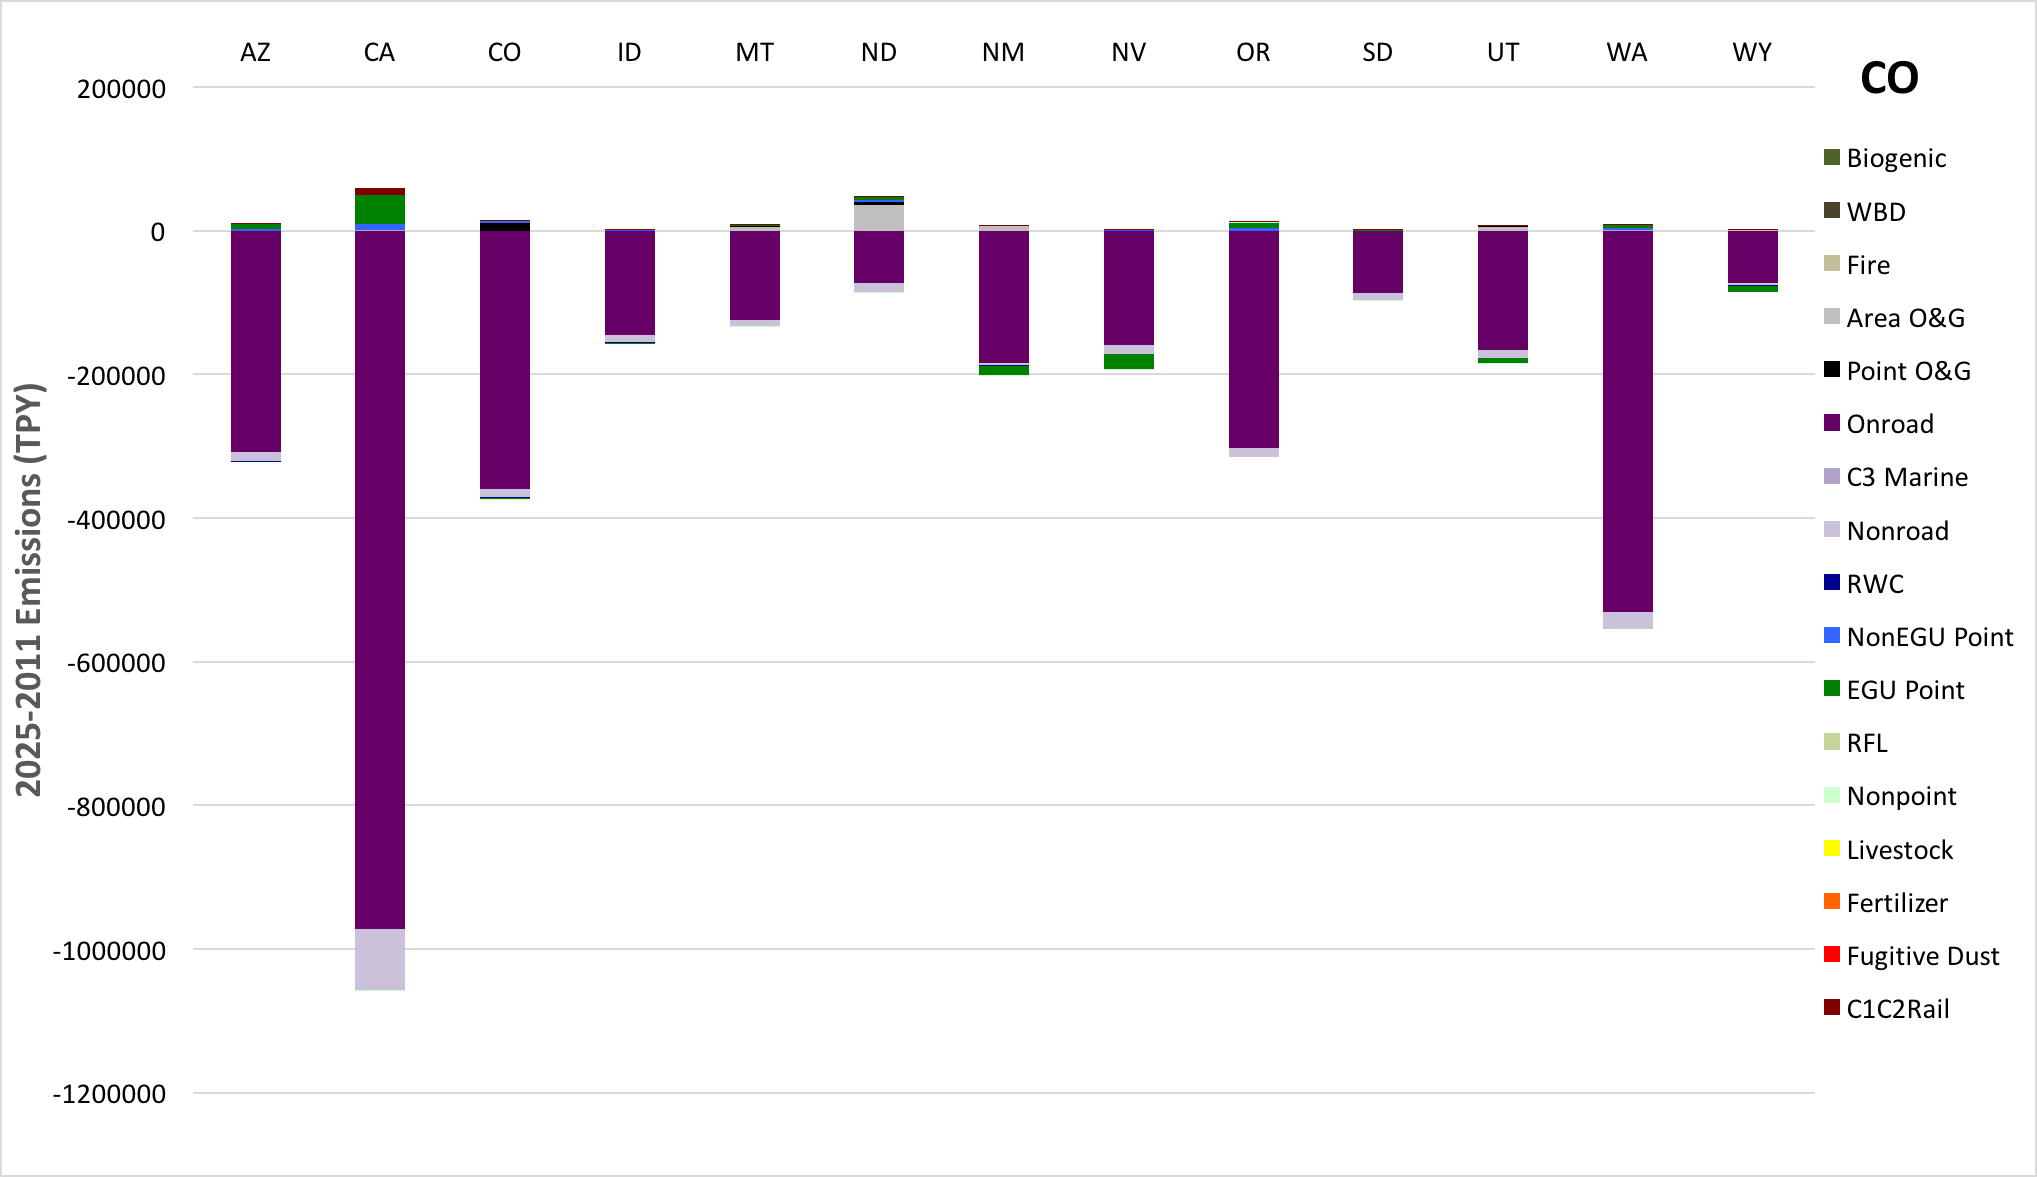
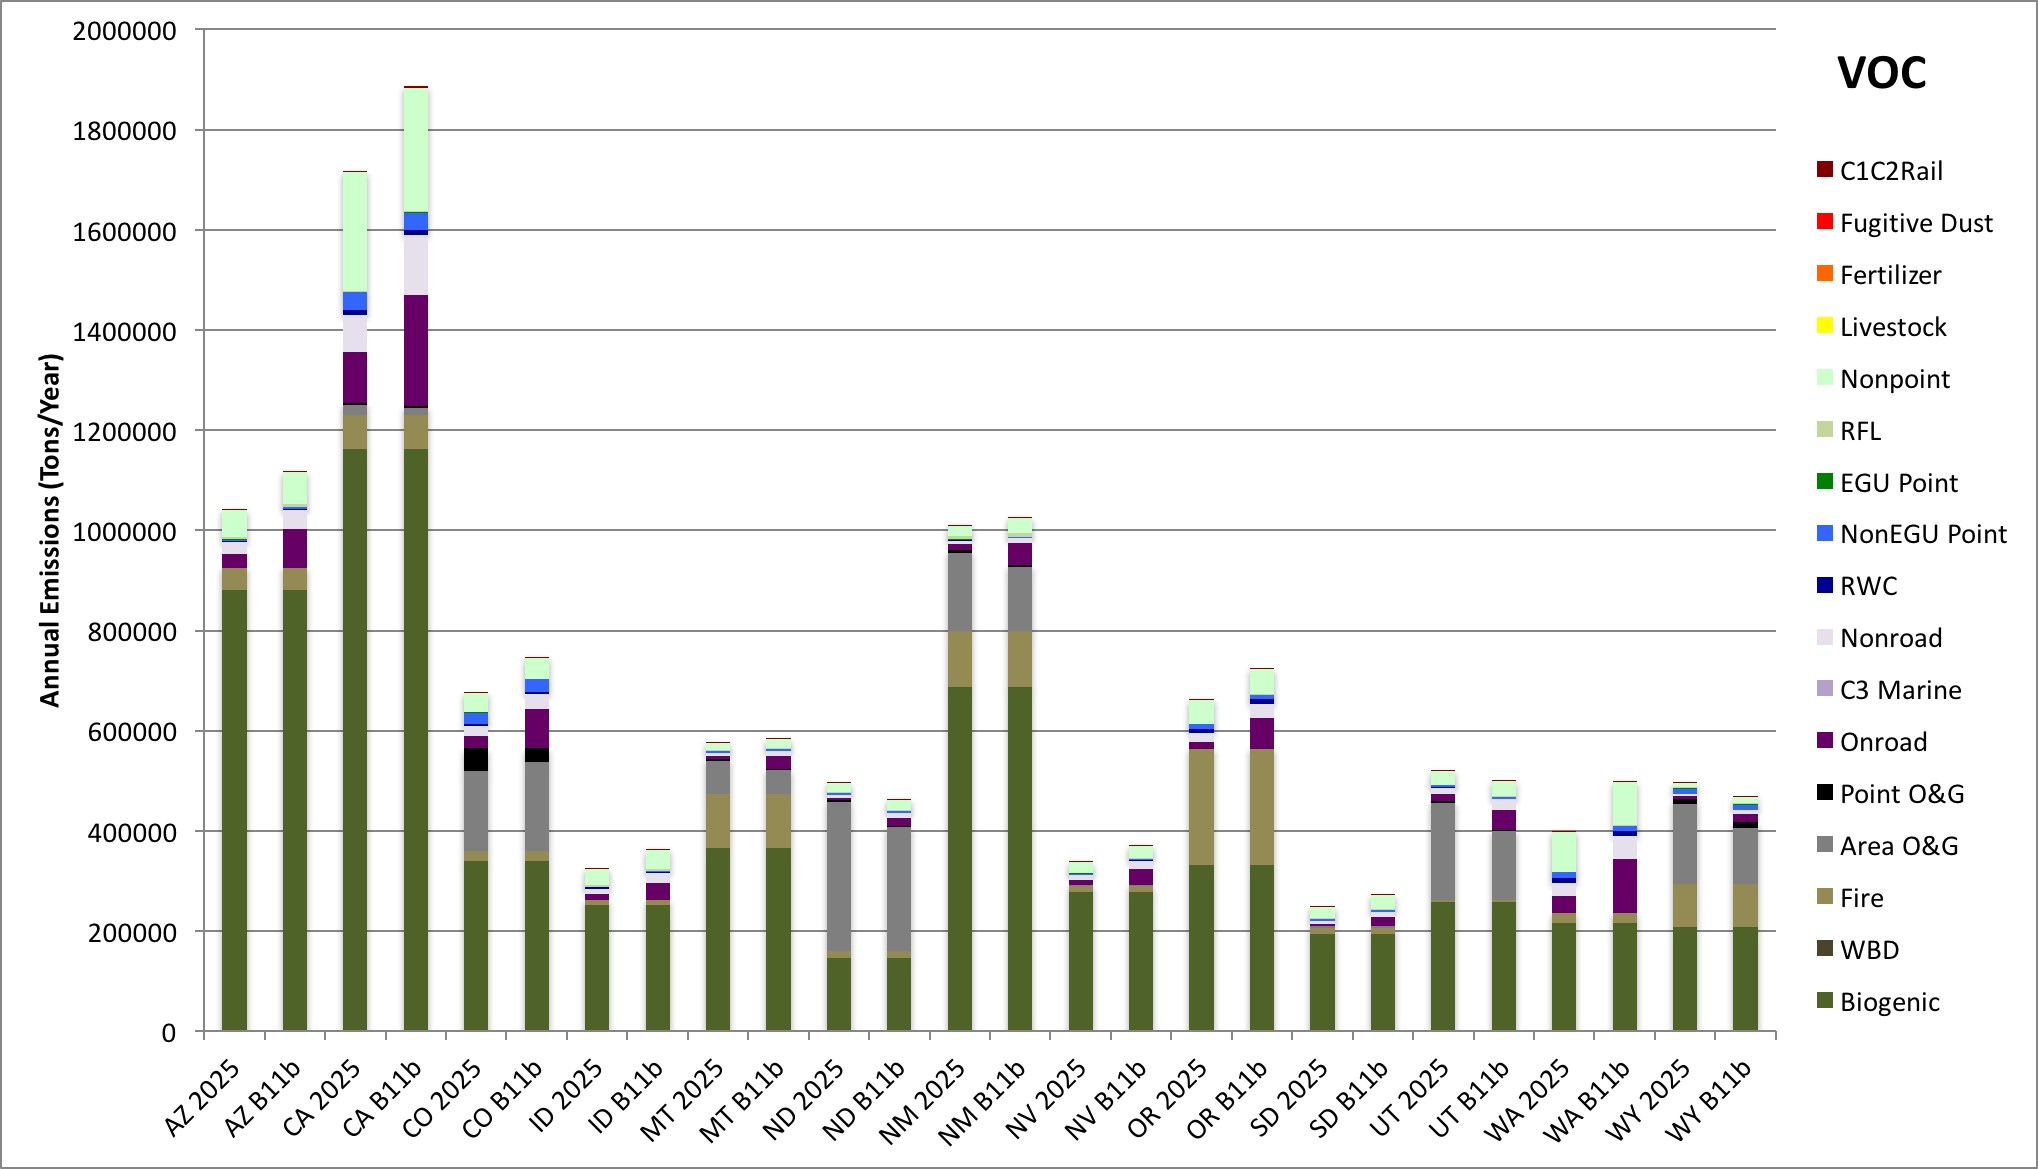
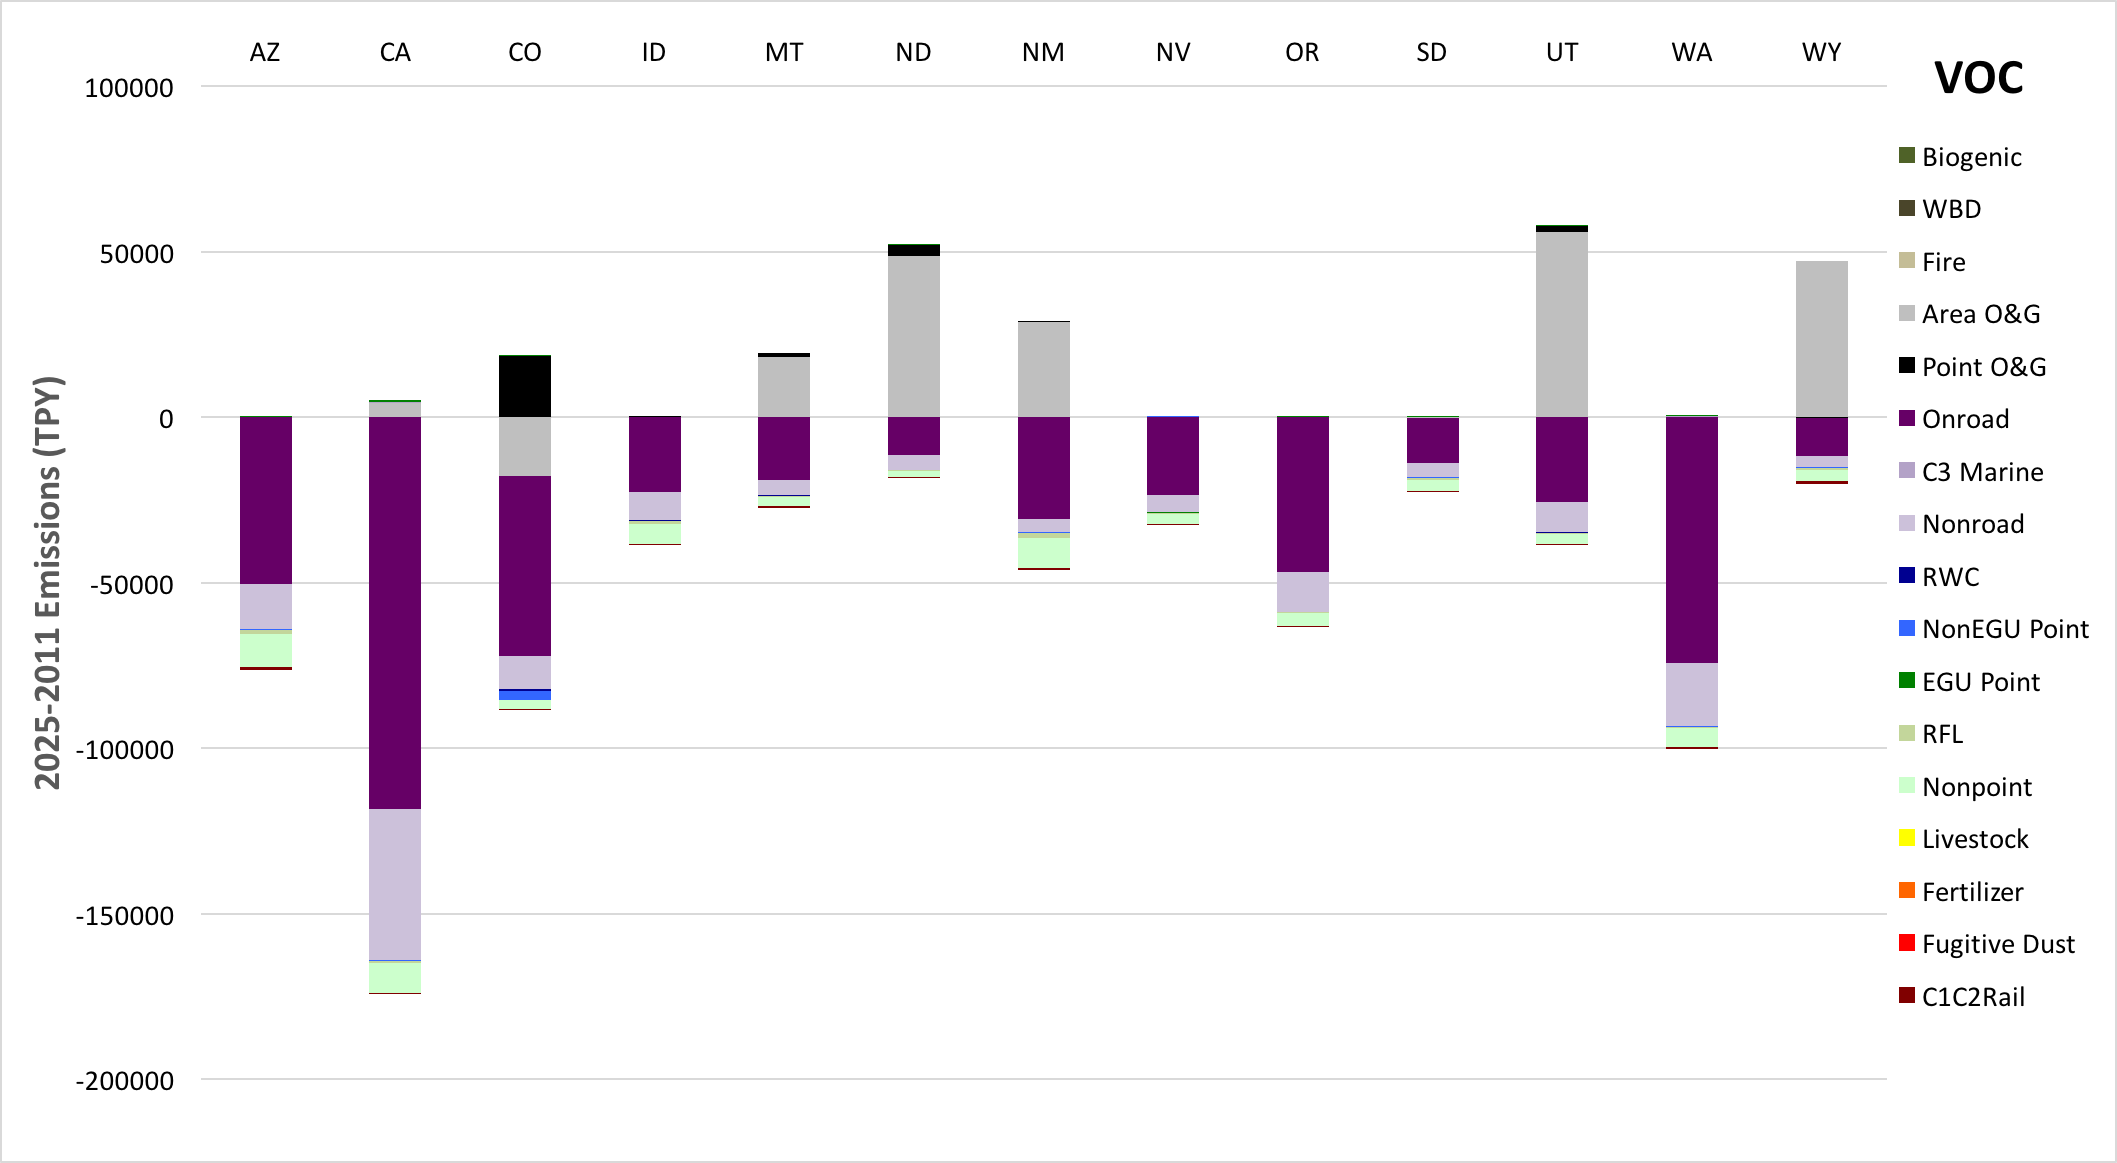
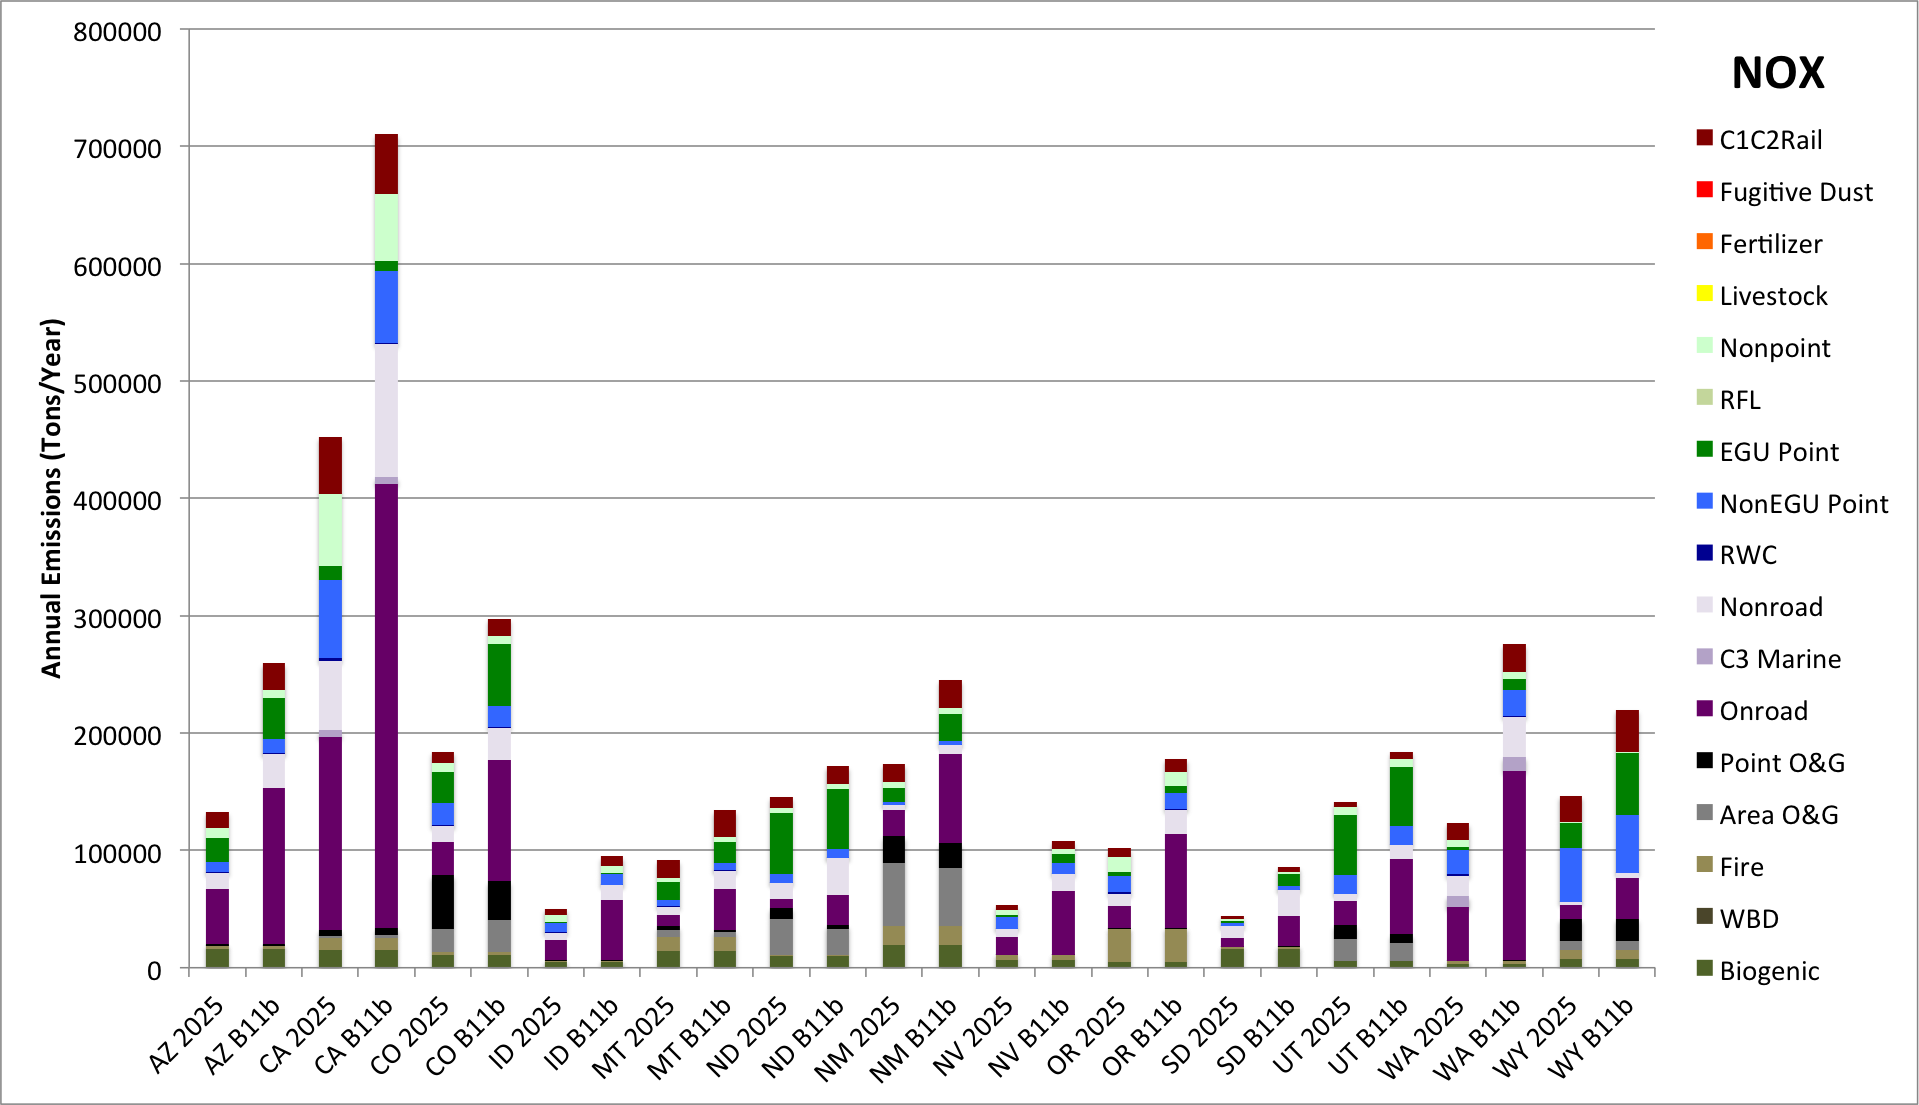
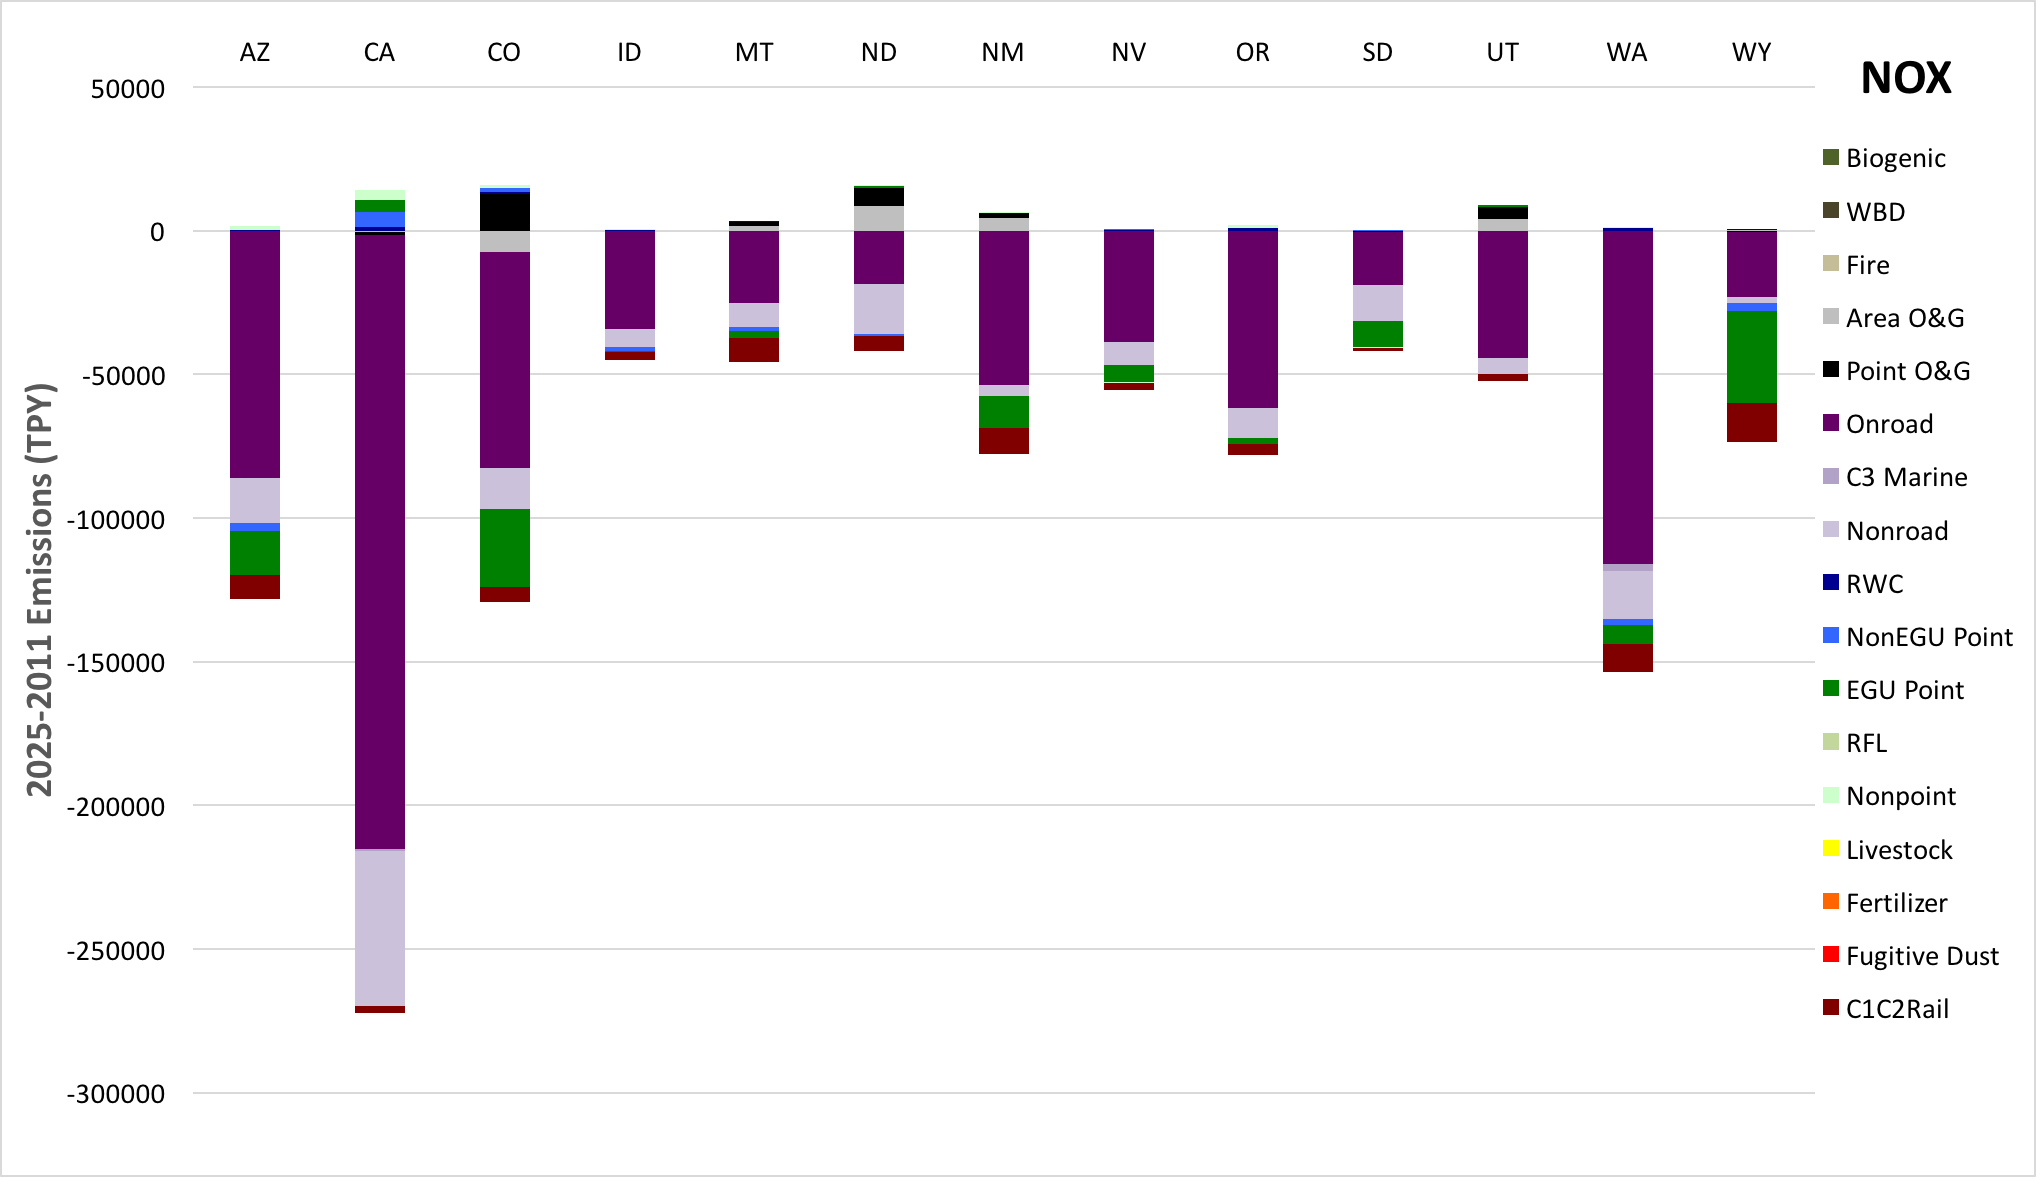
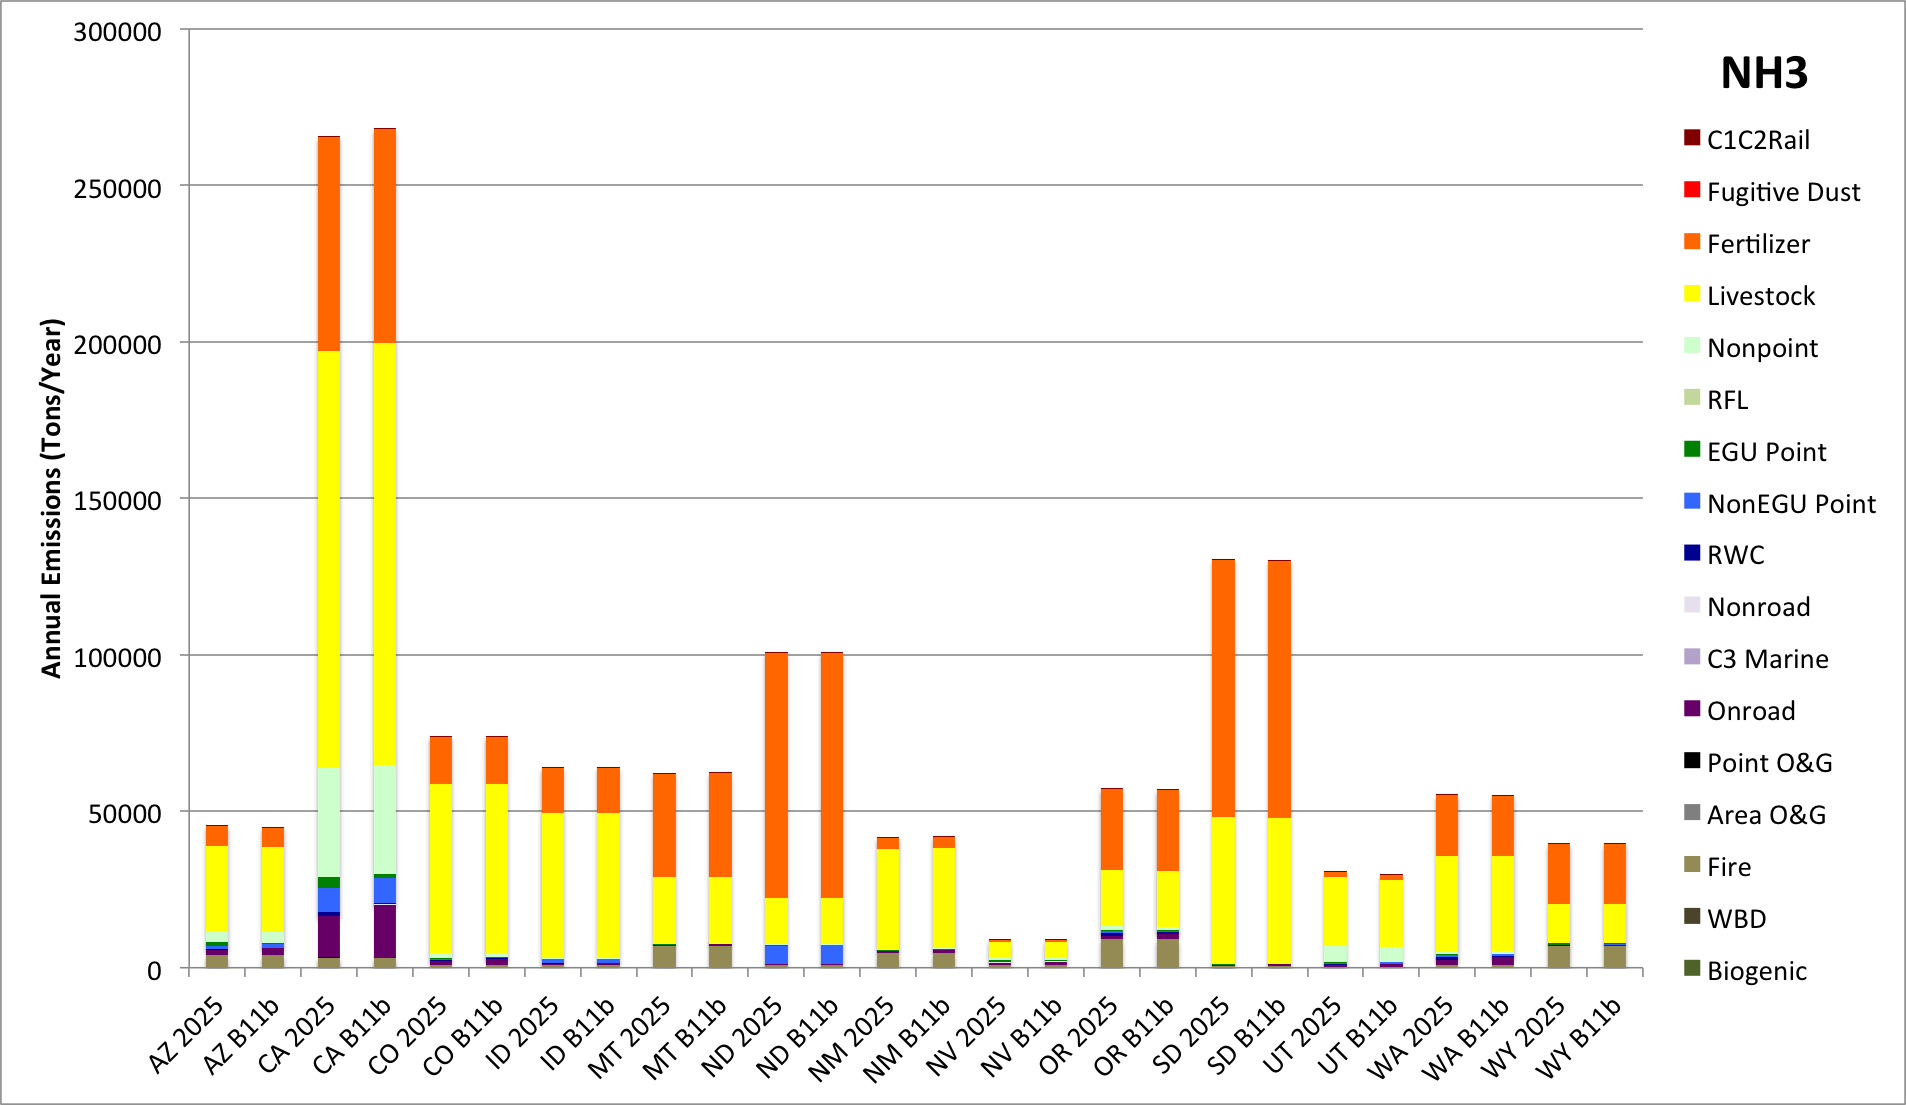
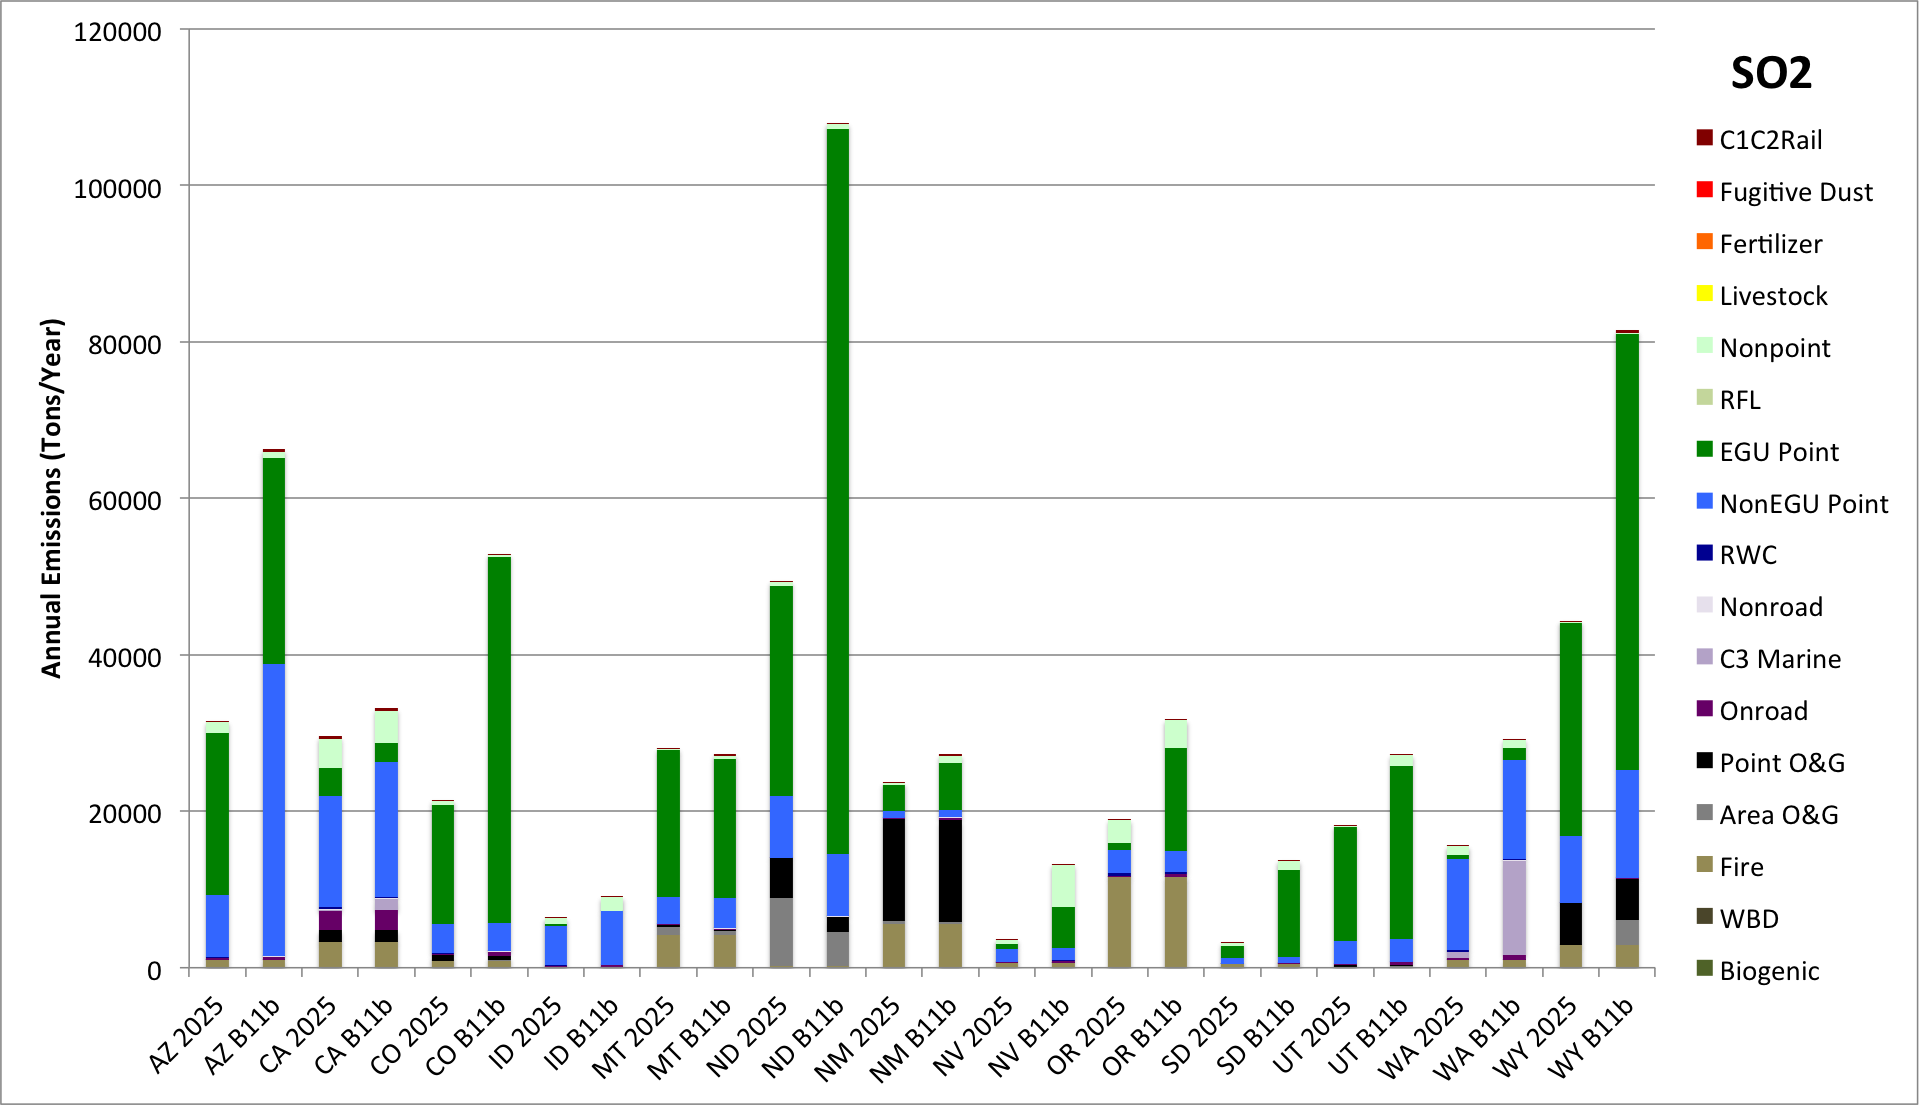
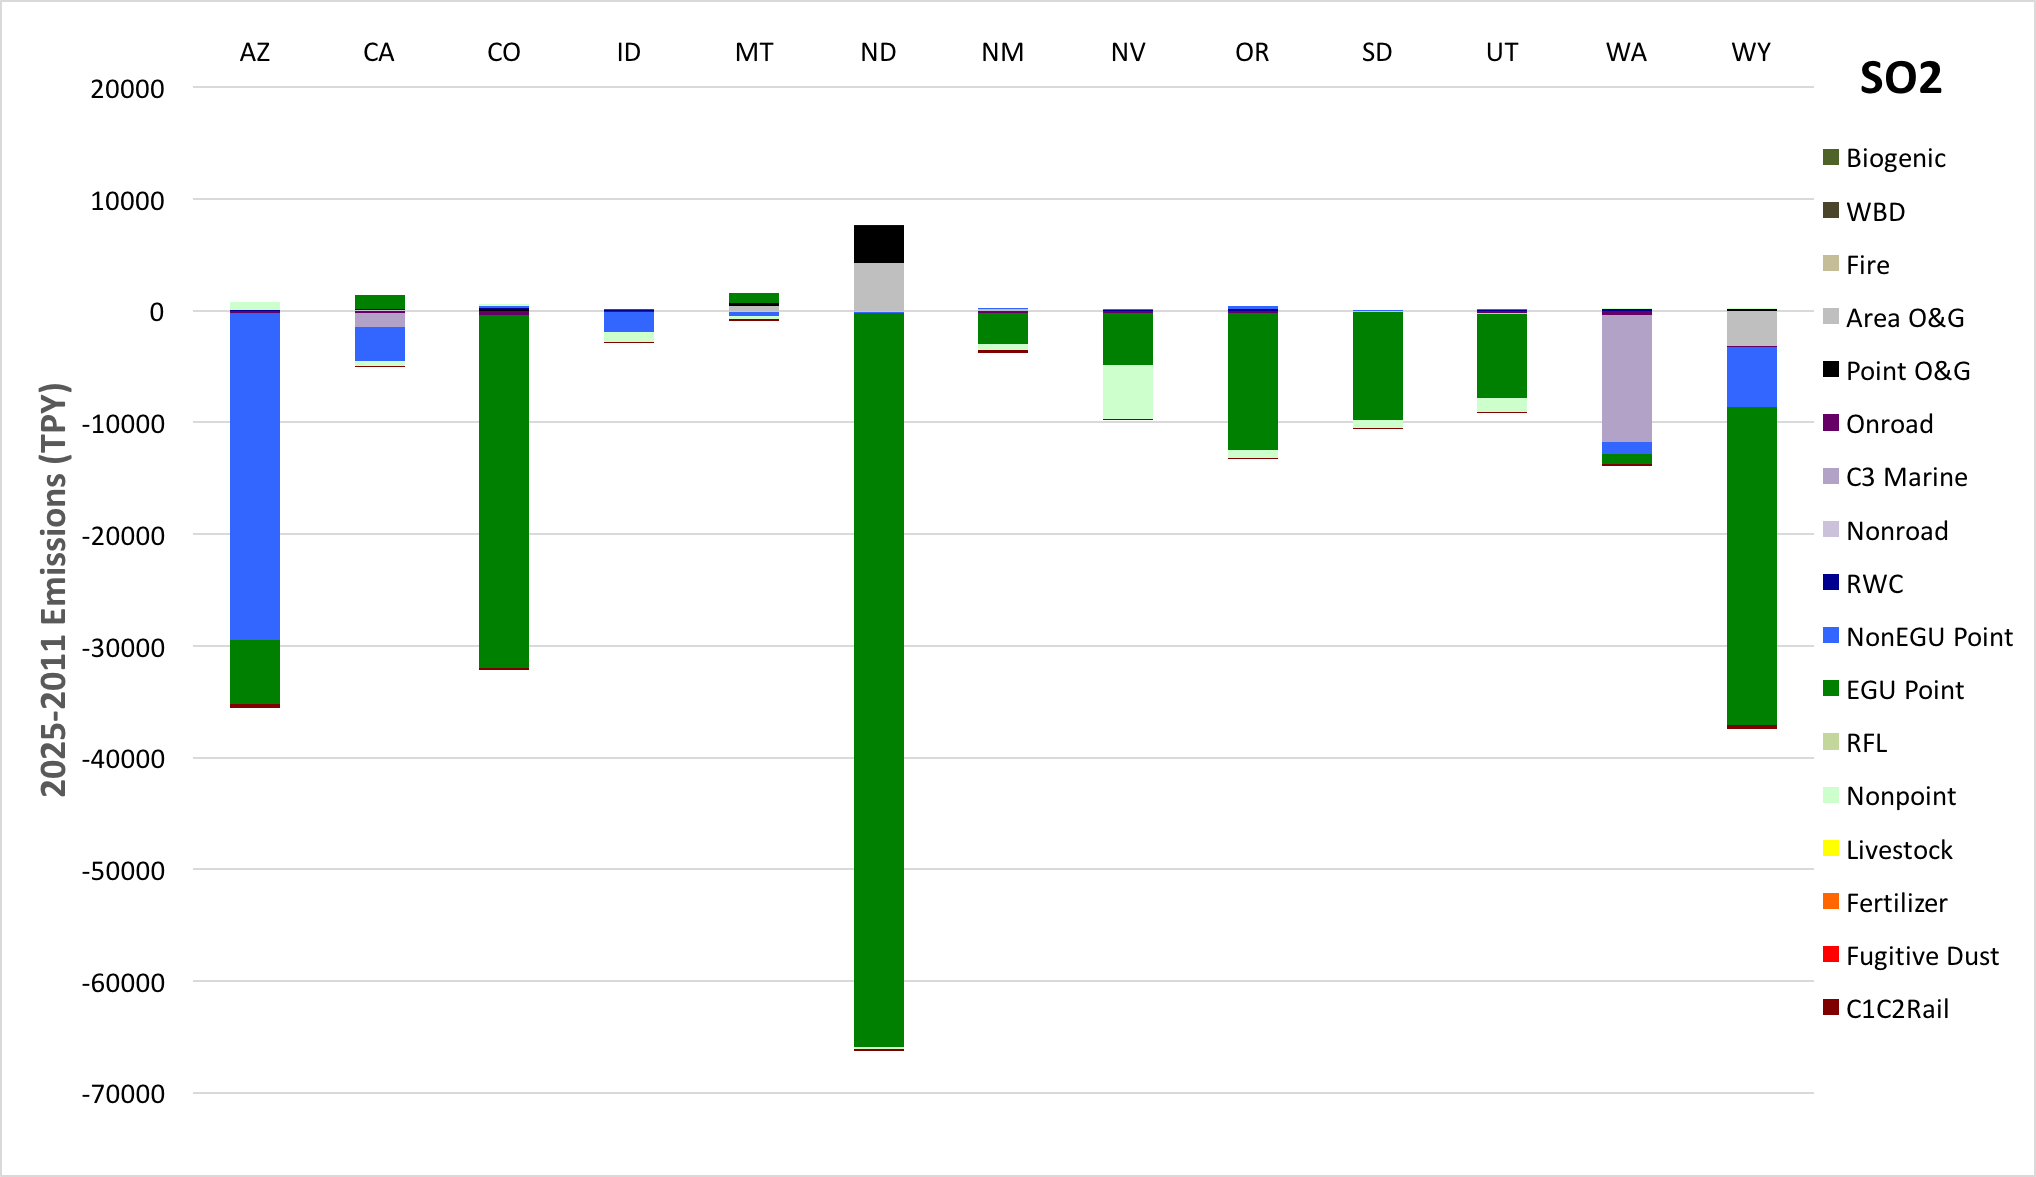
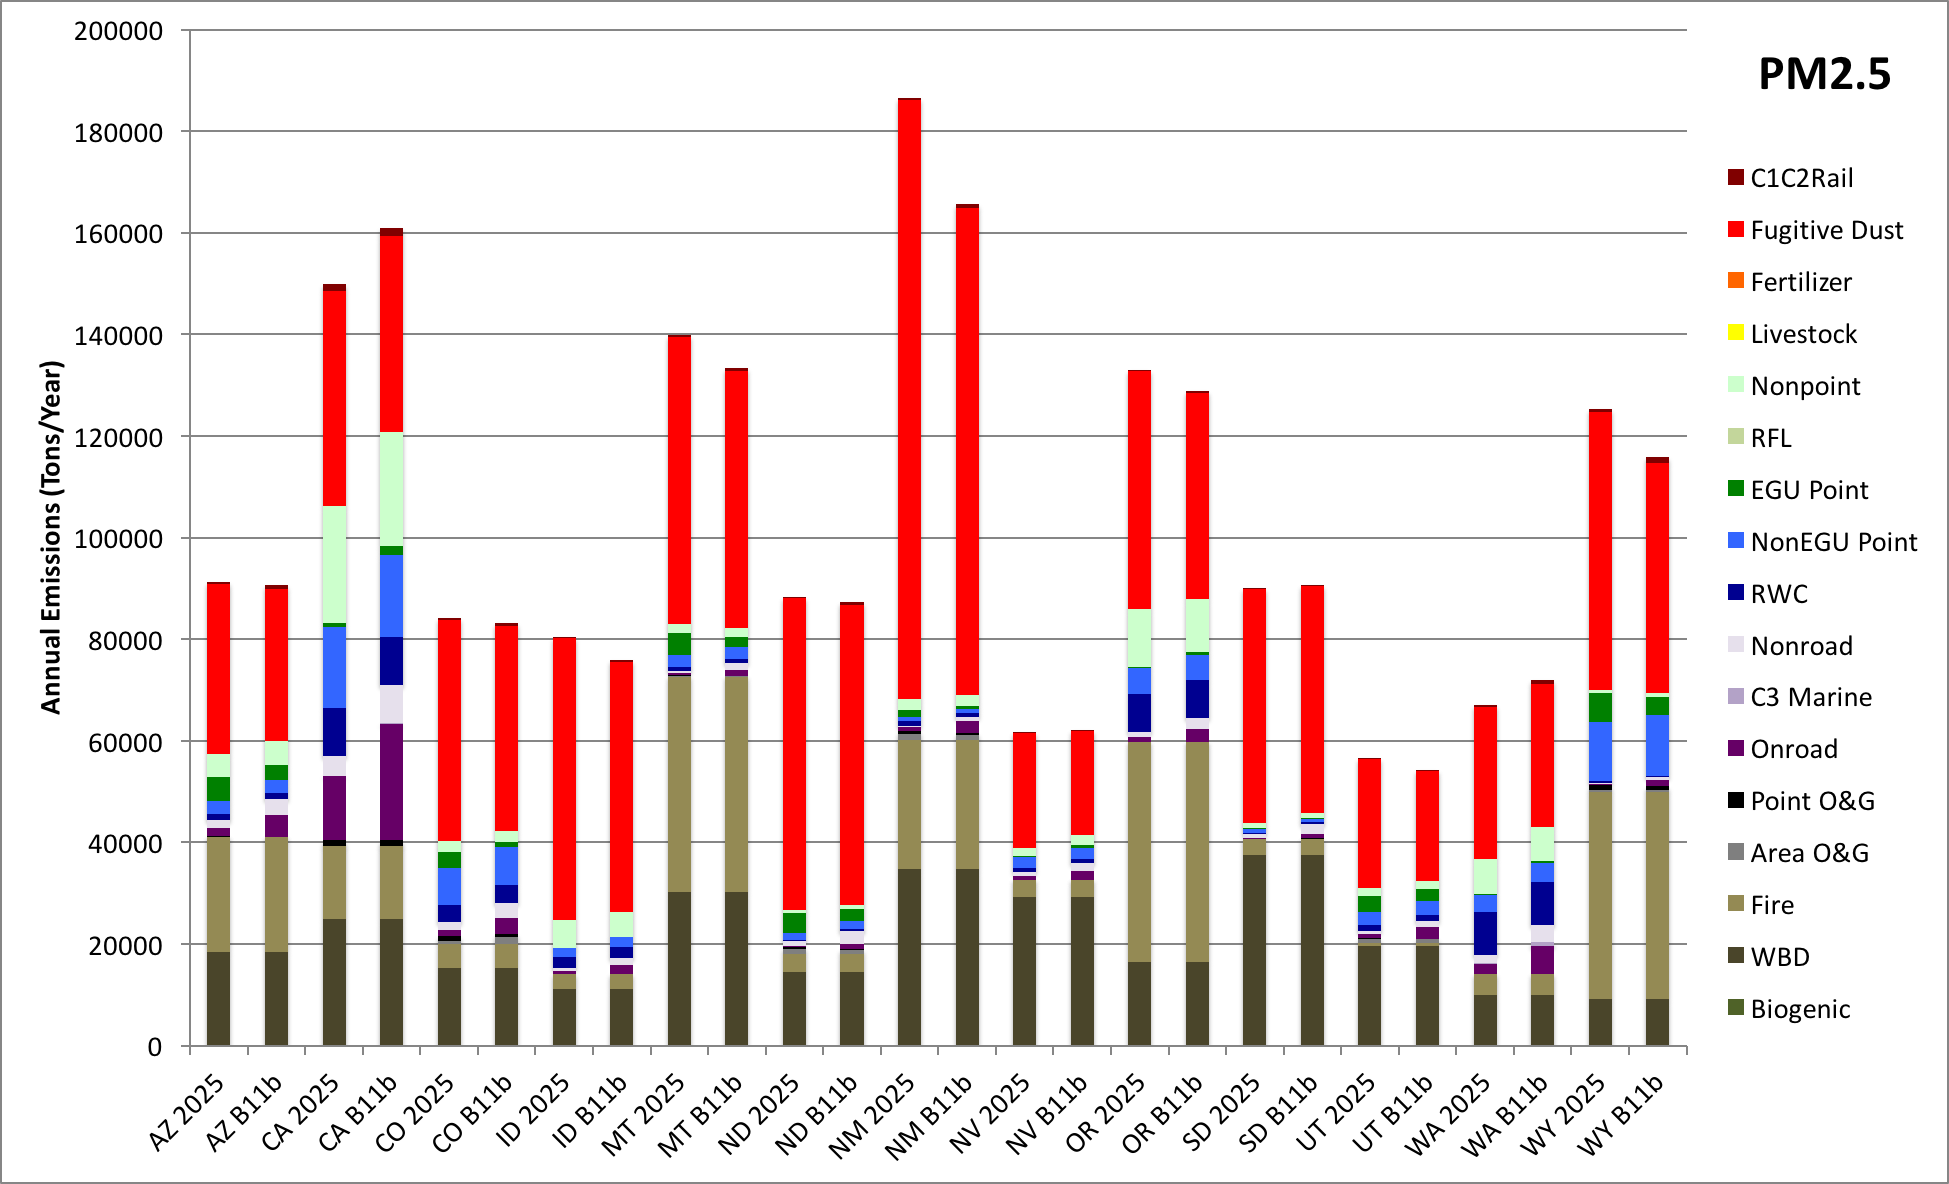
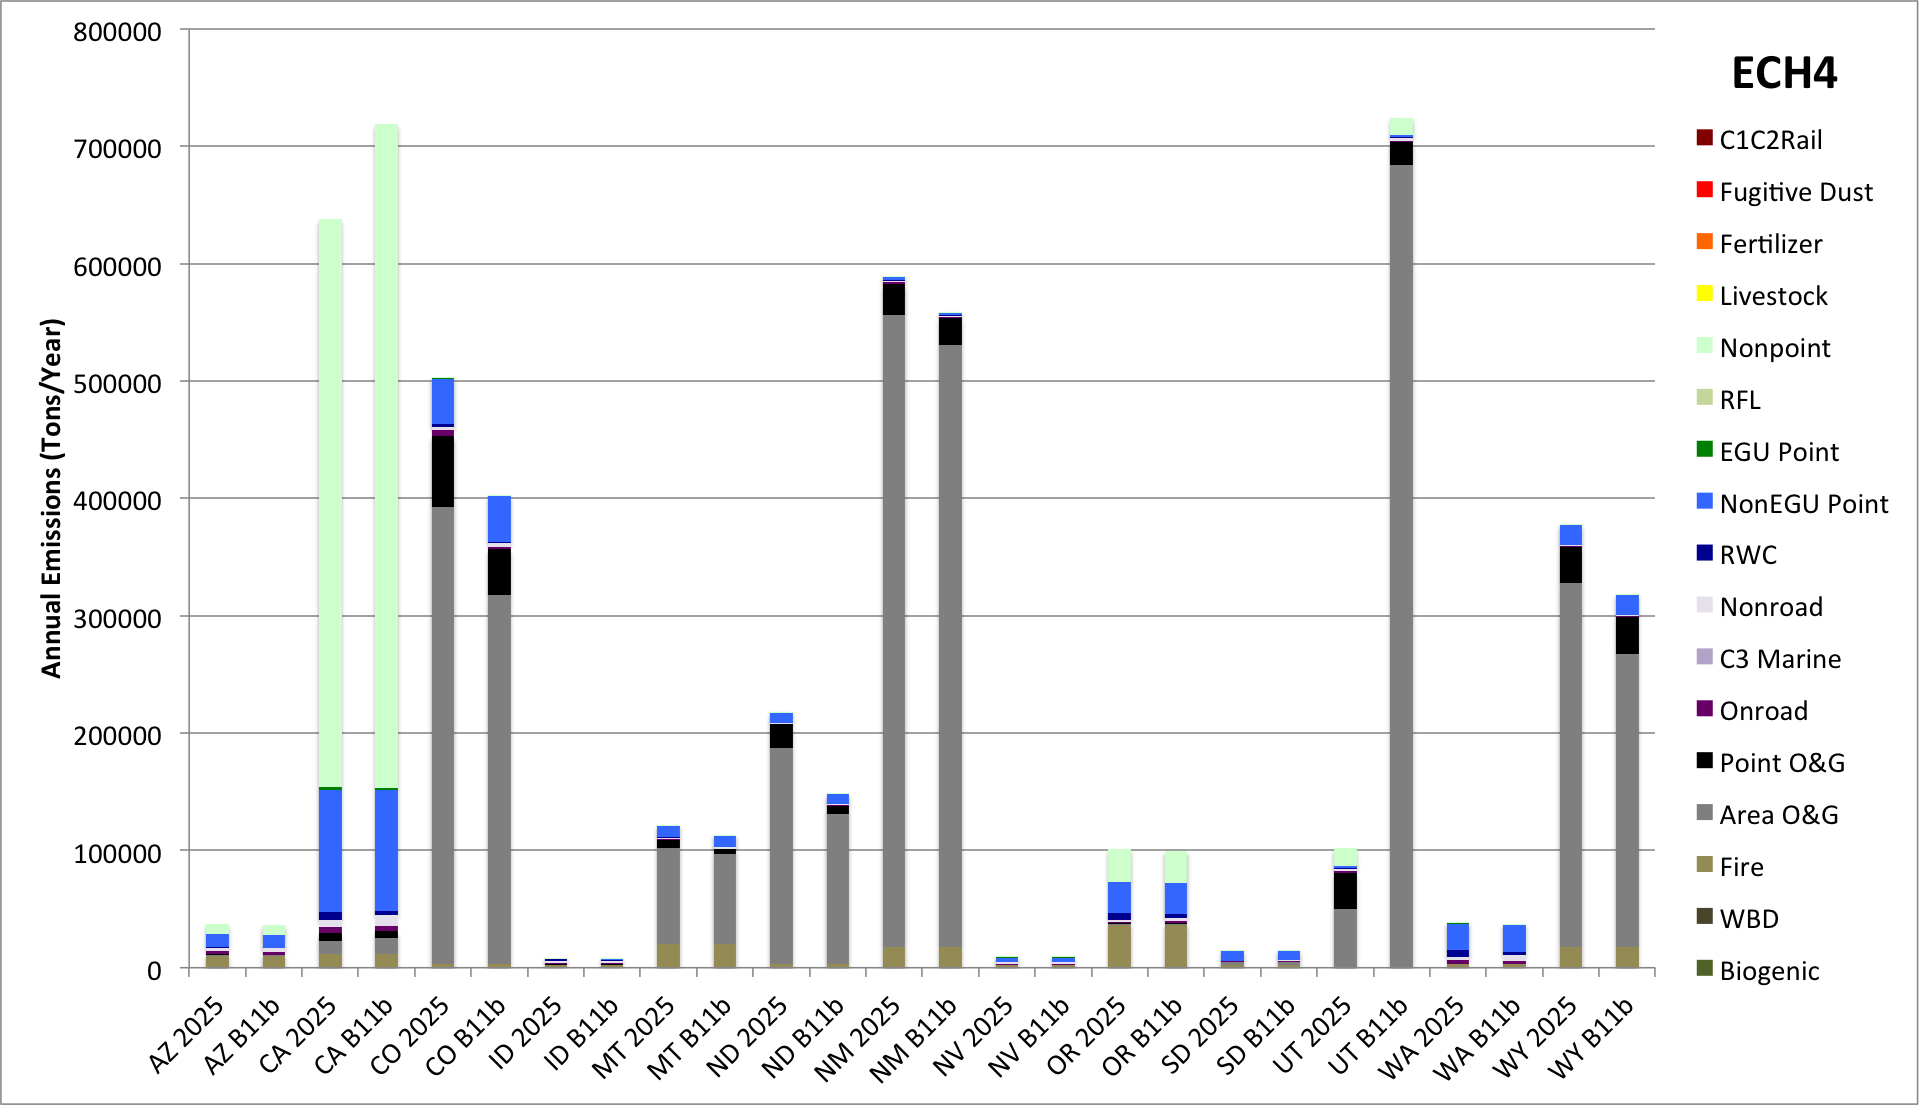
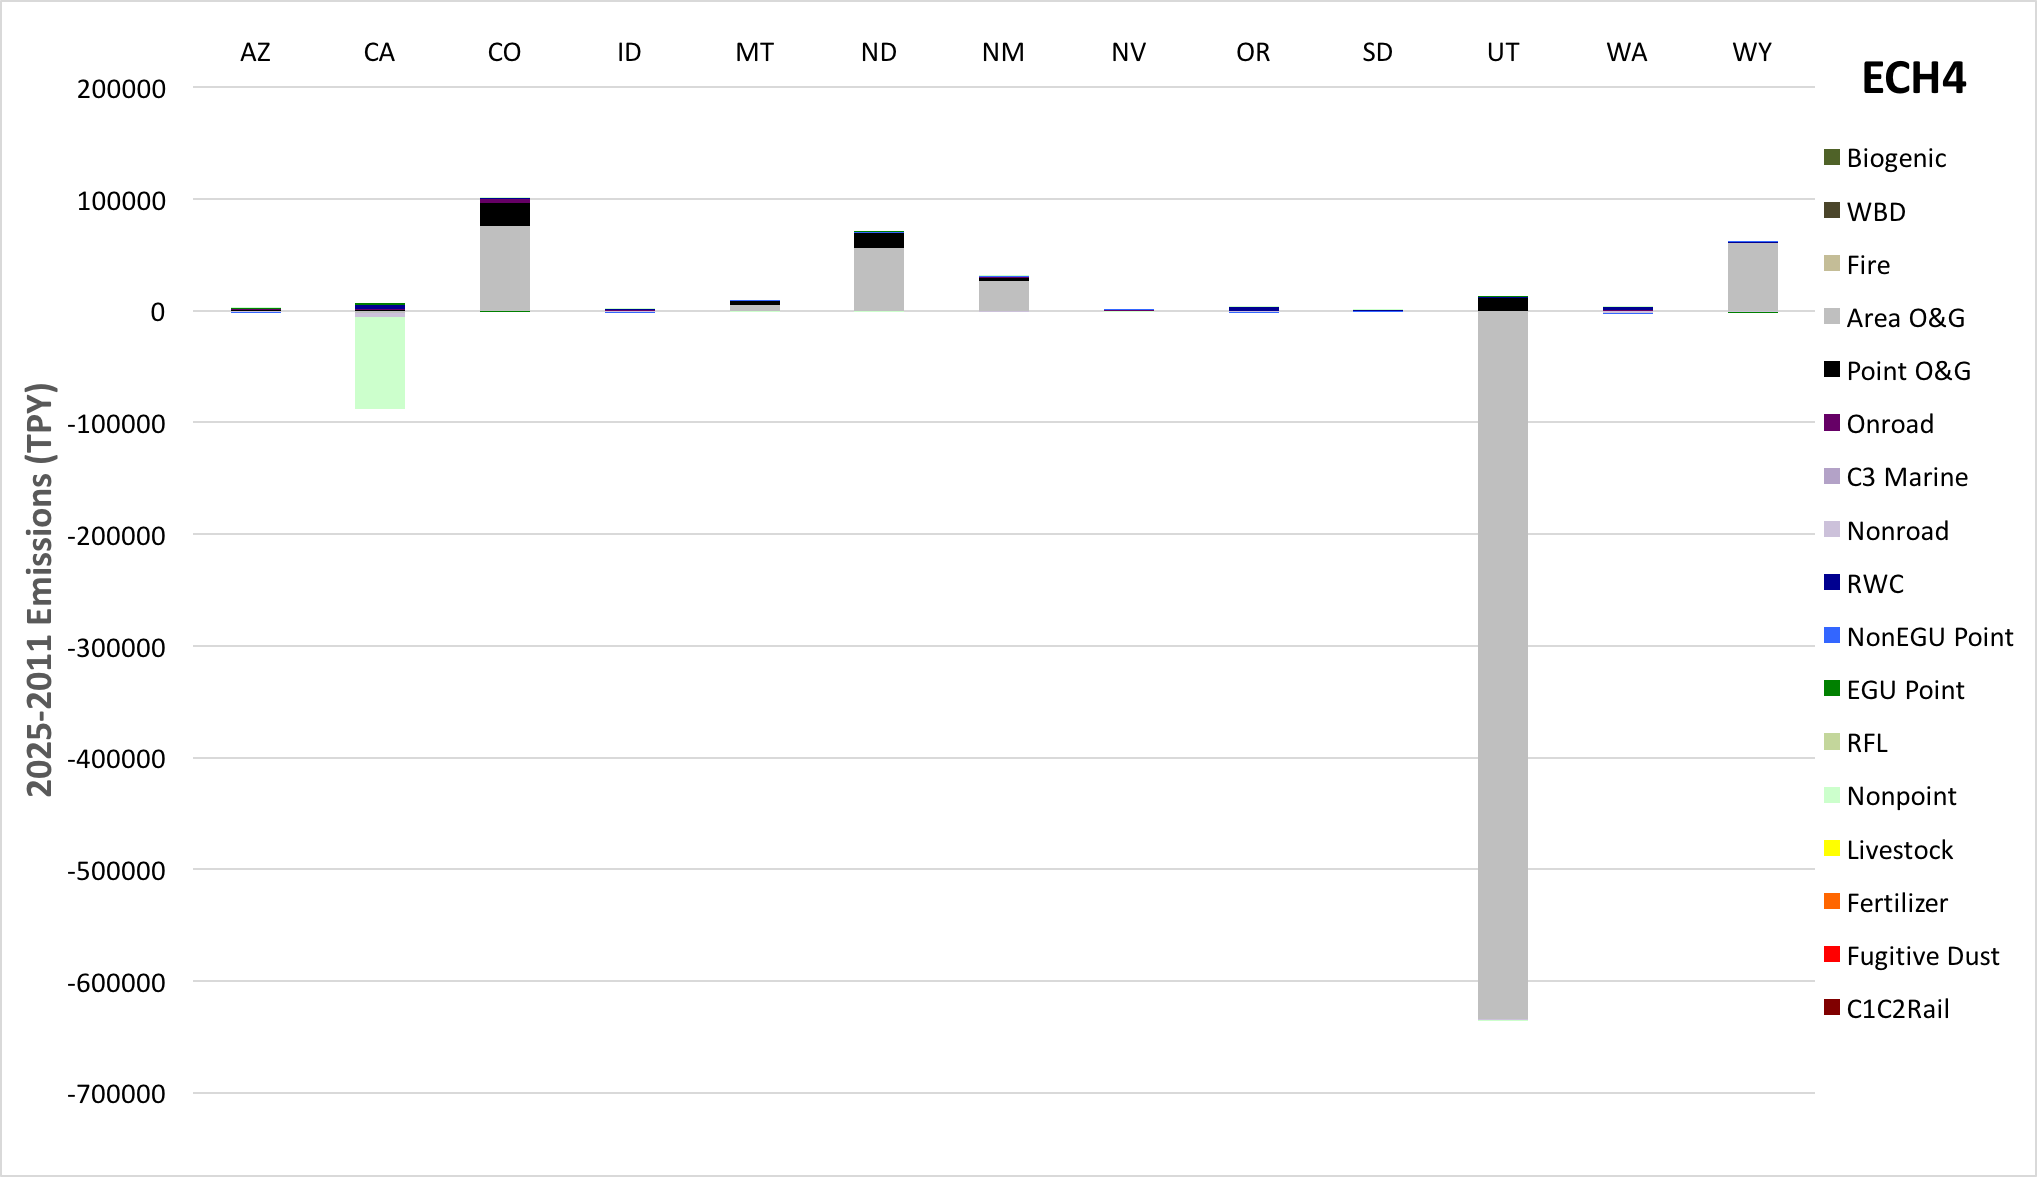
As described above in the 2011b Inventory Data section, all of the anthropogenic emissions sources, with the exception of the 3SAQS Phase II Oil and Gas (O&G) inventories, are from the U.S. EPA NEI 2011v6.2. The differences between the base and future year emissions for all sectors other than 3SAQS O&G sources seen in the plots below are due to the projections (growth + controls) used by the U.S. EPA in developing the NEI2011v6.2 inventories. The differences attributed to oil and gas sources in the basins covered by the 3SAQS Phase II inventories are documented in the 3SAQS Oil and Gas Modeling Wiki.Stacked Bar Charts
Stacked bar charts comparing the 2011 and 2025 emissions for each of the WRAP states showing the contribution of each emissions sector to the annual emissions in each state.- CO: 2025, 2025-2011
- VOC: 2025, 2025-2011
- NOx: 2025, 2025-2011
- NH3: 2025, 2025-2011
- SO2: 2025, 2025-2011
- PM2.5: 2025, 2025-2011
- CH4: 2025, 2025-2011
Tile Plots
Tile plots display the monthly total emissions (tons/month) in each model grid cell. These plots show the surface emissions for all of the anthropogenic sectors merged together; they do not include any of the natural sources (biogenic, fires, windblown dust, lightning, sea salt), as these sources are the same in the base and future year simulations. These plots do not reflect any of the emissions from elevated sources, they are surface emissions only.WAQS 2025a_11b 36-km Emissions Tile Plots
WAQS 2025a_11b 12-km Emissions Tile Plots
WAQS 2025a_11b 4-km Emissions Tile Plots
Errata
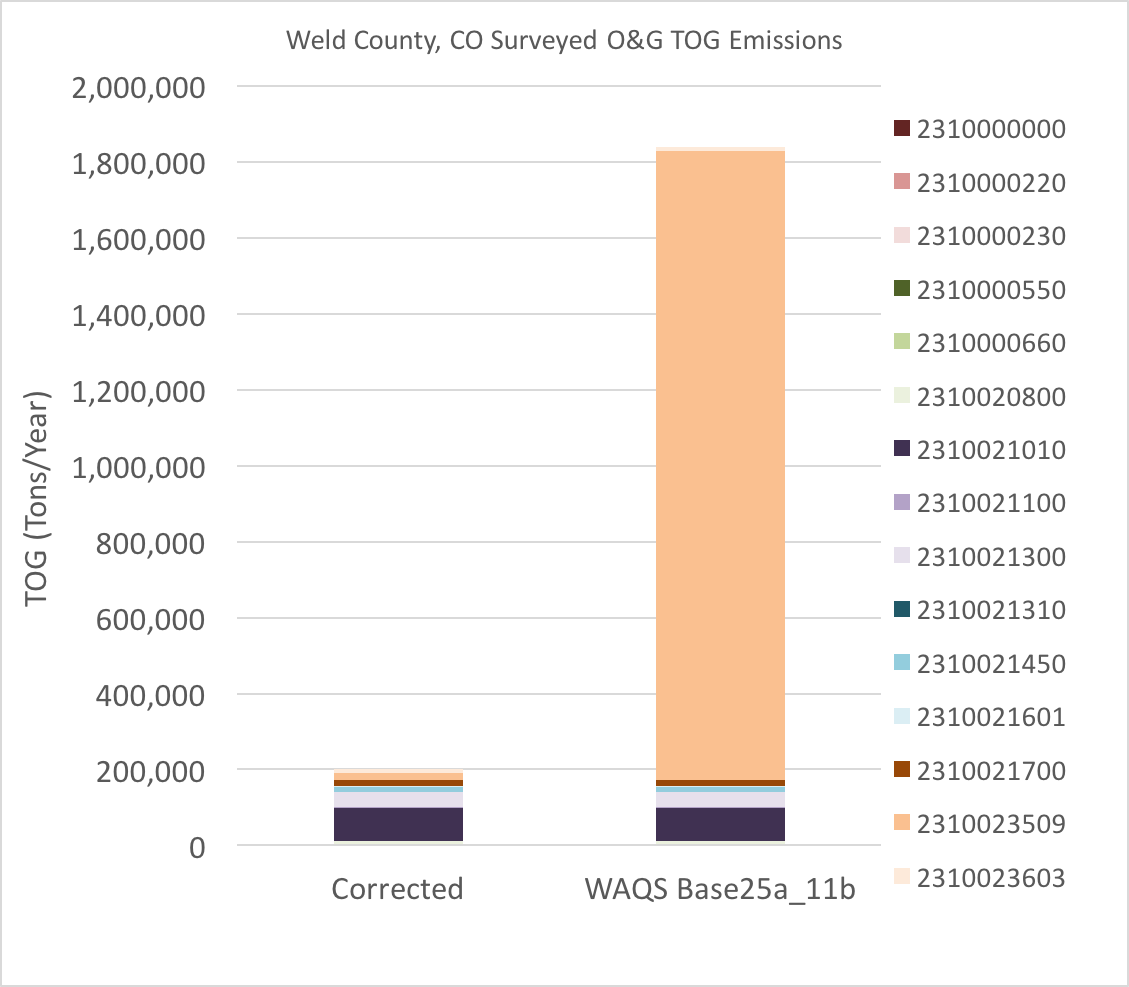
- Weld County, CO Area Oil & Gas VOC Speciation Correction
- Incorrect VOC speciation profile used for SCC 2310023509 (Survey-based Fugitives) in Weld County, CO.
- Profile correction impacts surveyed (non-point/area) oil and gas (AROG) sources for a single SCC in Weld County only. The AROG sector accounts for about 86% of the anthropogenic VOC emissions in Weld County.
- The South San Juan Coal Bed Methane (SSJCB) profile was used instead of the Denver-Julesburg Venting (DJVNT) profile. As the SSJCB profile represents a source that is predominantly methane (98.86%), it uses a large scaling factor to convert the inventory VOC to TOG.
- Correcting the profile reduces the 2025 Weld County AROG TOG by 89%, relative to the WAQS Base25a_11b emissions. The TOG reduction is primarily a reduction in methane mass.
- Correcting the profile reduces the 2025 Weld County AROG VOC reactivity by 20%, relative to the WAQS Base25a_11b emissions.