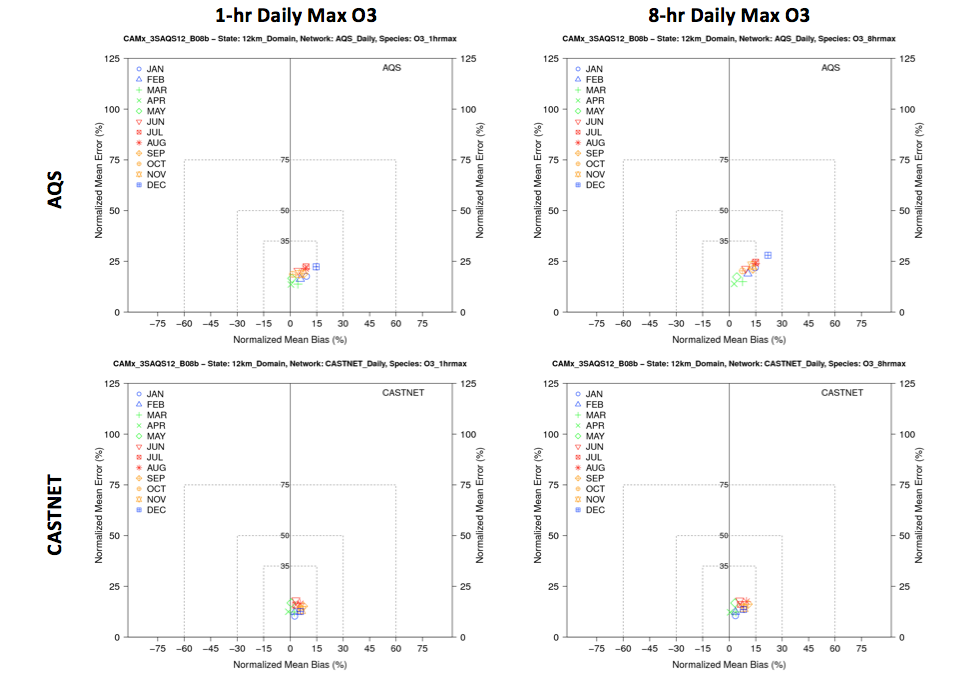
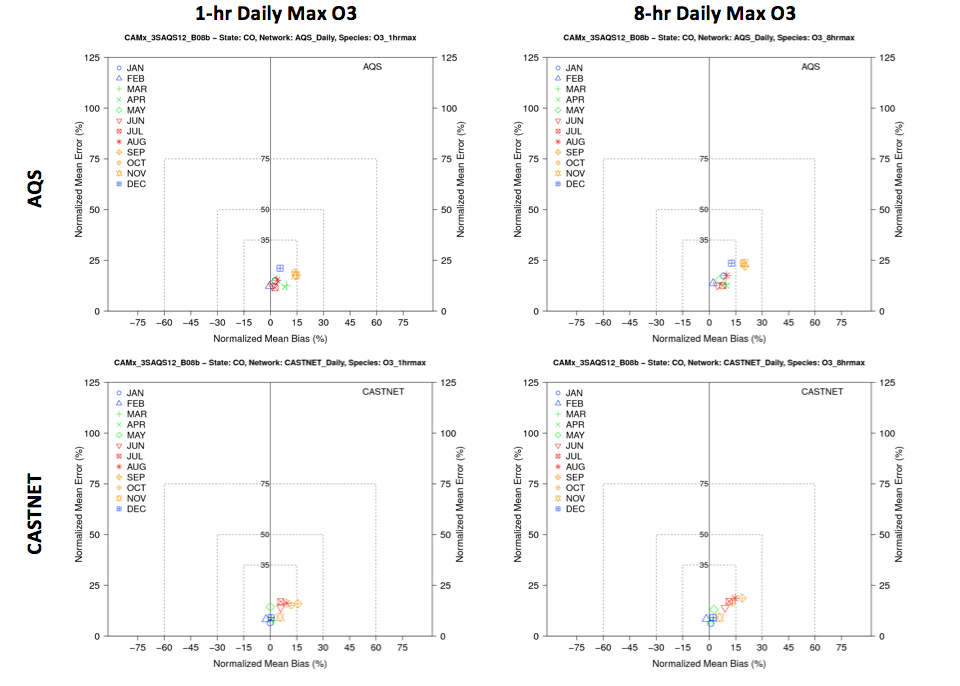
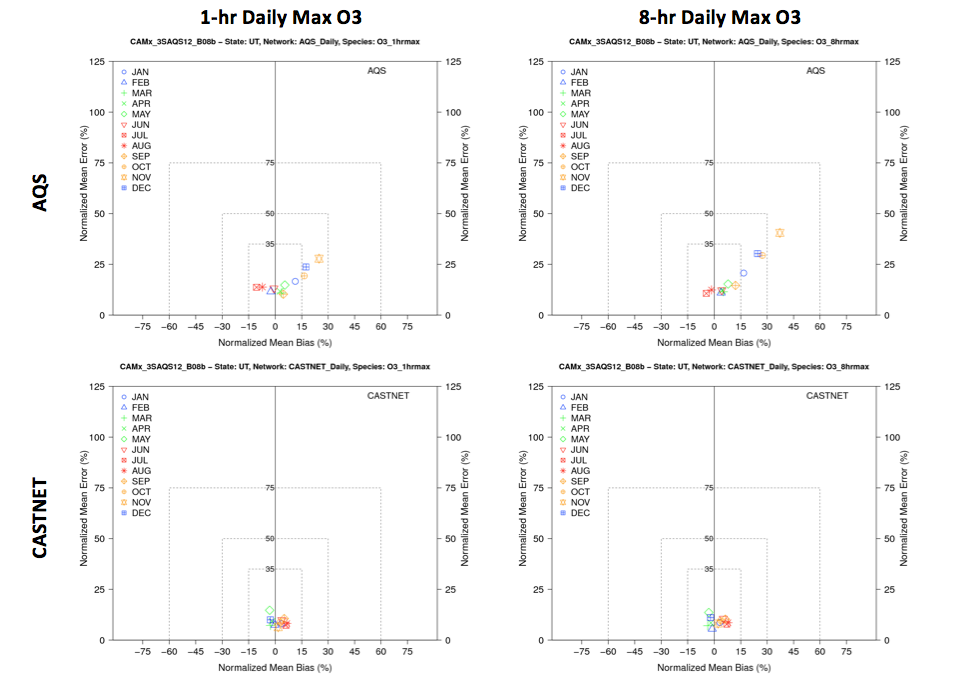
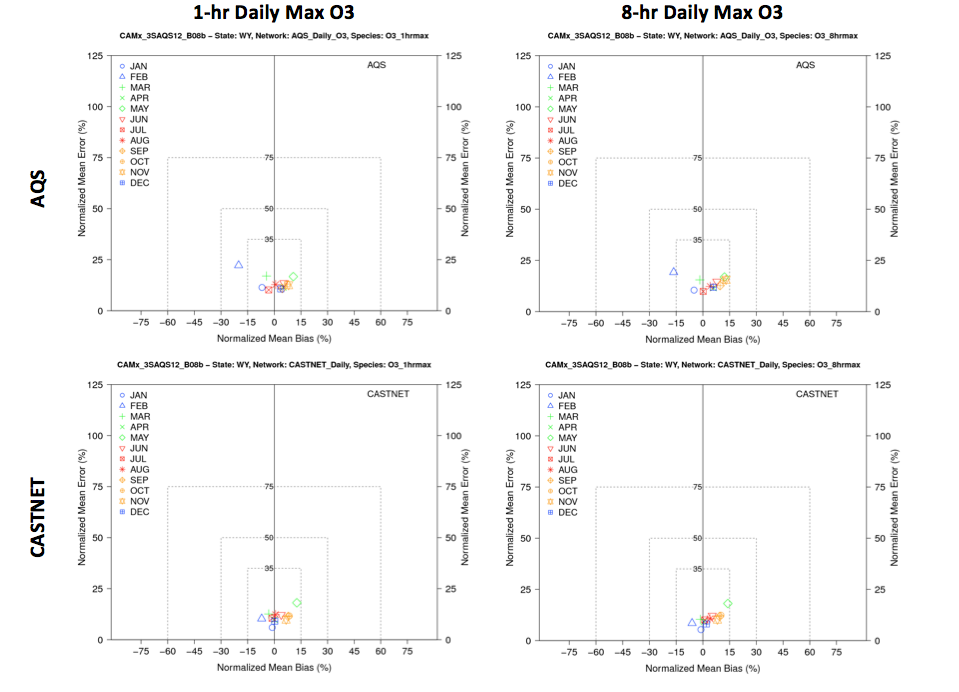
Base 2008b CAMx Modeling Results
Introduction
The Three-State Air Quality Study (3SAQS) performed photochemical grid modeling (PGM) for the year 2008 using the Comprehensive Air Quality Model with Extensions (CAMx) version 5.41. The 3SAQS 2008 base year simulation version B (CAMx_3SAQS_Base08b) was evaluated for its skill at simulating ozone (O3), fine particulate matter (PM2.5), and wet deposition sulfur and nitrogen, with a focus on the 12-km domain modeling results. We evaluated the performance of hourly ozone as well as daily maximum 1-hour (MDA1) and daily maximum 8-hour average (MDA8) ozone. In addition to ozone, we also included carbon monoxide (CO), nitrogen oxides (NOx), and sulfur dioxide (SO2) gas-phase species in the evaluation. The PM2.5 evaluation includes total PM2.5 along with the component species sulfate (SO4), nitrate (NO3), ammonium (NH4), elemental carbon (EC), organic carbon (OC), and other PM (PM Other). The deposition evaluation focused on total sulfur and oxidized and reduced nitrogen species. We did not include dry deposition species or visibility metrics in the MPE.
The 3SAQS 2008 base case model performance was evaluated against concurrent measured ambient concentrations using graphical displays of model performance and statistical model performance measures. The CAMx_3SAQS_Base08b performance was compared against established model performance goals and criteria, following the procedures recommended in EPA’s photochemical modeling guidance documents. The evaluation included sub-regional evaluations for Colorado, Utah, and Wyoming, and evaluations by month and season.
The model performed well for ozone across almost all monitoring networks and periods. Exceptions included severe under estimations of high winter ozone events in Utah and Wyoming.
Modeled PM2.5 meets or exceeds the performance goal in the summer months over the 12-km domain relative to IMPROVE and CSN, but falls outside the criteria at the IMPROVE sites in the winter. The performance is within the criteria in UT at CSN sites in all months. In general, the urban (CSN) sites, where PM concentrations are larger, show better performance than in the remote sites in the 12-km domain, and in CO and UT. Spatially across the 12-km modeling domain CAMx is overbiased in the western part of the domain and the four corners states in the winter and spring, and in most of these regions in the fall. The model tends to be underbiased in summer in some of these same regions, as well as in the upper Midwest. On a seasonal basis, CAMx significantly overpredicts observations from both the IMPROVE and CSN networks across the 12-km domain, in all seasons except for the summer. The overprediction is greatest in the winter at the IMPROVE sites, and much less in the summer at the CSN sites.
CAMx 2008b Final Model Performance Evaluation Report
Results
Table 1 presents monthly animations of daily maximum concentrations for several model output species. The O3, NO2, and CO plots include observations overlaid on the plots that are normalized to the color scale of the model results.Table 1. Animations of Daily Max Concentrations
| Month | O3 | NO2 | CO | PM2.5 | NH3 | SO2 |
|---|---|---|---|---|---|---|
| January | 2008 | 2008 | 2008 | 2008 | 2008 | 2008 |
| February | 2008 | 2008 | 2008 | 2008 | 2008 | 2008 |
| March | 2008 | 2008 | 2008 | 2008 | 2008 | 2008 |
| April | 2008 | 2008 | 2008 | 2008 | 2008 | 2008 |
| May | 2008 | 2008 | 2008 | 2008 | 2008 | 2008 |
| June | 2008 | 2008 | 2008 | 2008 | 2008 | 2008 |
| July | 2008 | 2008 | 2008 | 2008 | 2008 | 2008 |
| August | 2008 | 2008 | 2008 | 2008 | 2008 | 2008 |
| September | 2008 | 2008 | 2008 | 2008 | 2008 | 2008 |
| October | 2008 | 2008 | 2008 | 2008 | 2008 | 2008 |
| November | 2008 | 2008 | 2008 | 2008 | 2008 | 2008 |
| December | 2008 | 2008 | 2008 | 2008 | 2008 | 2008 |


