Winter Ozone AQ Modeling Results
Approach
The WAQS modeling team conducted a series of CAMx sensitivity simulations with the objectives of understanding the deficiencies and improving the ability of the model in reproducing high wintertime ozone concentrations related to localized meteorological conditions and oil and gas emissions sources. The WRF Winter Modeling Workplan and WRF Winter Modeling Evaluation Report describe our efforts to improve the simulation of the meteorology associated with high wintertime ozone. The WRF modeling conducted by the WAQS team resulted in a wintertime WRF configuration that results in a better model of the inversion events that accompany high ozone concentrations.The WAQS modelers conducted a CAMx simulation with the new winter meteorology (and additional improvements to the way CAMx simulates snow albedo and chemistry). The changes to the meteorology did little to improve the CAMx under predictions of high wintertime ozone. Using insights from top down modeling and observational campaigns in Intermountain West oil and gas basins, the WAQS team developed a brute force oil and gas emissions sensitivity to test the hypothesis that our simulations underpredict VOC emissions and overpredict NOx emissions from oil and gas sources. The second winter O3 sensitivity used the same meteorology inputs as the winter meteorology simulation and included the following adjustments to the emissions from oil and gas sources (both area and point): 2x VOCs, 10x formaldehyde, and 0.5x NOx. While the emissions perturbation produced improvements at some monitoring locations at some times, there were still high ozone events that were badly underpredicted by the model.
The final CAMx sensitivity simulation conducted by the WAQS modelers was designed to test the hypothesis that there was still to much dilution in the surface layer of the model. The winter ozone layer sensitivity used the adjusted oil and gas emissions and the WRF winter meteorology. The WAQS modelers adjusted the WRFCAMx processor to use the same vertical layer structure as WRF within the first 6 model layers. In all of the previous simulations (base, winter met, oil and gas emissions) the first 6 WRF layers were collapsed into the 3 CAMx layers such that WRF layers 1+2 = CAMx layer 1, WRF layers 3+4 = CAMx layer 2, and WRF layers 5+6 = CAMx layer 3. This collapsing roughly amounted to 12 m deep WRF layers being collapsed to 24 m deep CAMx layers. In the vertical mixing sensitivity the WRF vertical layer structure was preserved for the first 6 layers resulting in 28 layer CAMx meteorology (compared to 25 layer meteorology in the previous runs). Note that there was still layer collapsing applied above the first 6 WRF layers.
Simulation Summary:
Base Simulation:Simulation
Simulation ID: CAMx_3SAQS04_B11a
Modeling Period: February 1-March 31, 2011
Analysis Domain: 4-km
Meteorology Sensitivity
Simulation (CAMx_3SAQS04_B11a_WinterO3)ID: CAMx_3SAQS04_B11a_WinterO3
Met: WRF Winter + WRFCAMx Snow 25 layers
Emissions: Same as CAMx_3SAQS04_B11a
Oil and Gas Emissions Sensitivity
Simulation (CAMx_3SAQS04_B11a_WinterO3_OG_Emis)ID: CAMx_3SAQS04_B11a_WinterO3_OG_Emis)
Met: Same as CAMx_3SAQS04_B11a_WinterO3
Emissions: 2x O&G VOC, 10x O&G HCHO, 0.5x O&G NOx adjustments to CAMx_3SAQS04_B11a
Vertical Transport Sensitivity
Simulation (CAMx_3SAQS04_B11a_WinterO3_OG_Emis_Layers)ID: CAMx_3SAQS04_B11a_WinterO3_OG_Emis_Layers
Met: WRF Winter + WRFCAMx Snow 28 layers (no collapsing in layers 1-6)
Emissions: Same as CAMx_3SAQS04_B11a_WinterO3_OG_Emis
Emissions Adjustments
O&G Basin Emission Adjustment Factors
| Basin | NOx | VOC | CH4 | Notes | Reference |
|---|---|---|---|---|---|
| Denver-Julesberg | >2.0 | Petron et al., 2012 | |||
| Piceance | |||||
| North San Juan | |||||
| South San Juan | |||||
| Paradox | |||||
| Uintah | 0.25 | 1.6 | 4.4 | Uintah and Duchesne Counties | Karion et al., 2013; Ahmadov et al., 2015 |
| Southwest Wyoming | |||||
| Big Horn | |||||
| Wind River | |||||
| Powder River | |||||
| Great Plains | |||||
| Williston |
Upper Green River Basin CAMx Analysis
Monthly Average Concentrations
| Big Piney | VOC | CH4 | |||||
| Boulder | VOC | CH4 | Winter VOC | Winter CH4 | Winter NO2 | Hourly CH4 | Hourly NO2 |
| Gillette | VOC | CH4 | |||||
| Pavilion | VOC | CH4 | Winter VOC | Winter CH4 | Winter NO2 | ||
| Wamsutter | VOC | CH4 |
Timeseries Analysis of CAMx Base11a O3
Colorado
Utah
Uintah Basin Winter Ozone StudyThese sites only measured ozone and meteorology parameters
| Site | Lat, Long, Elev | 2011 Episode Dates | 1-hr O3 Concentrations | Time-Height |
|---|---|---|---|---|
| Altamount | 40.3603, -110.2858, 1949.8056 | Feb 14 | >85 ppb | WRF-Winter |
| Mar 2-3 | >85 ppb | WRF-Winter | ||
| Cedarview | 40.383524, -110.072563, 1692.2496 | Jan 7-8 | >80 ppb | |
| Jan 25-31 | >90 ppb | |||
| Feb 12-16 | >135 ppb | WRF-Winter | ||
| Feb 23-24 | >100 ppb | |||
| Mar 1-3 | >90 ppb | WRF-Winter | ||
| Dinosaur | 40.4371, -109.3047, 1462.7352 | Jan 6-9 | >80 ppb | |
| Feb 12-16 | >110 ppb | WRF-Winter | ||
| Duchesne | 40.1615, -110.4011, 1682.496 | Jan 29-30 | >90 ppb | |
| Feb 12-16 | >120 ppb | WRF-Winter | ||
| Horse Pool | 40.1437, -109.4672, 1569.4152 | Jan 6-8 | >100 ppb | |
| Jan 24-31 | >95 ppb | |||
| Feb 12-16 | >130 ppb | WRF-Winter | ||
| Feb 23-25 | >120 ppb | |||
| Mar 1-4 | >115 ppb | WRF-Winter | ||
| Jensen | 40.3671, -109.3522, 1450.848 | Feb 12-16 | >100 ppb | WRF-Winter |
| Feb 23-24 | >80 ppb | |||
| Mar 1-2 | >80 ppb | WRF-Winter | ||
| Lapoint | 40.404, -109.8157, 1673.9616 | Jan 6-8 | >90 ppb | |
| Jan 27-31 | >80 ppb | |||
| Feb 12-16 | >120 ppb | |||
| Feb 22-24 | >100 ppb | |||
| Mar 1-3 | >85 ppb | |||
| Ouray | 40.054768, -109.688001, 1463.9544 | Jan 6-9 | >100 ppb | |
| Jan 16-17 | >95 ppb | |||
| Jan 26-31 | >105 ppb | |||
| Feb 11-16 | >140 ppb | |||
| Feb 24-25 | >120 ppb | |||
| Mar 1-3 | >100 ppb | |||
| Pariette Draw | 40.03460278, -109.8300556, 1466.6976 | Feb 11-16 | >140 ppb | |
| Feb 22-25 | >120 ppb | |||
| Mar 1-3 | >110 ppb | |||
| Rabbit Mountain | 39.8687, -109.0973, 1878.7872 | Jan 16 | >85 ppb | |
| Feb 14-16 | >100 ppb | |||
| Red Wash | 40.1972, -109.3525, 1688.8968 | Jan 6-9 | >95 ppb | |
| Jan 26-31 | >95 ppb | |||
| Feb 12-15 | >135 ppb | |||
| Feb 23-24 | >105 ppb | |||
| Mar 1-3 | >100 ppb | |||
| Roosevelt | 40.30073056, -109.9784172, 1544.7264 | Jan 6-9 | >80 ppb | |
| Jan 27-31 | >100 ppb | |||
| Feb 12-16 | >120 ppb | WRF-Winter | ||
| Feb 3-4 | >100 ppb | |||
| Mar 1-3 | >80 ppb | |||
| Vernal | 40.443273, -109.560983, 1662.684 | Jan 8-9 | >85 ppb | |
| Feb 12-16 | >100 ppb | WRF-Winter | ||
| Feb 24 | >85 ppb | |||
| Mar 2 | >80 ppb |
| Site | Lat, Long, Elev | 2011 Episode Dates | 8-hr O3 Concentrations | Obs Y/N |
|---|---|---|---|---|
| Wyoming Range | 42.98, -110.35, 2475 | Feb 15 | >80 ppb | Y |
| Mar 10 | >80 ppb | |||
| Pinedale | 42.92, -109.79, 2388 | Mar 1-2 | >85 ppb | Y |
| Mar 5 | >80 ppb | |||
| Juel Springs | 42.37, -109.56, 2144 | Mar 2 | >90 ppb | Y |
| Mar 12 | >85 ppb | |||
| Mar 15 | >85 ppb | |||
| Daniel | 42.79, -110.05, 2173 | Mar 10 | >80 ppb | Y |
| Boulder | 42.71, -109.75, 2160 | Feb 14 | >85 ppb | Y |
| Mar 1-5 | >120 ppb | |||
| Mar 12 | >120 ppb | |||
| Mobile Trailer | 42.68, -109.8, 2143 | Feb 14 | >80 ppb | Y |
| Mar 3 | >80 ppb |
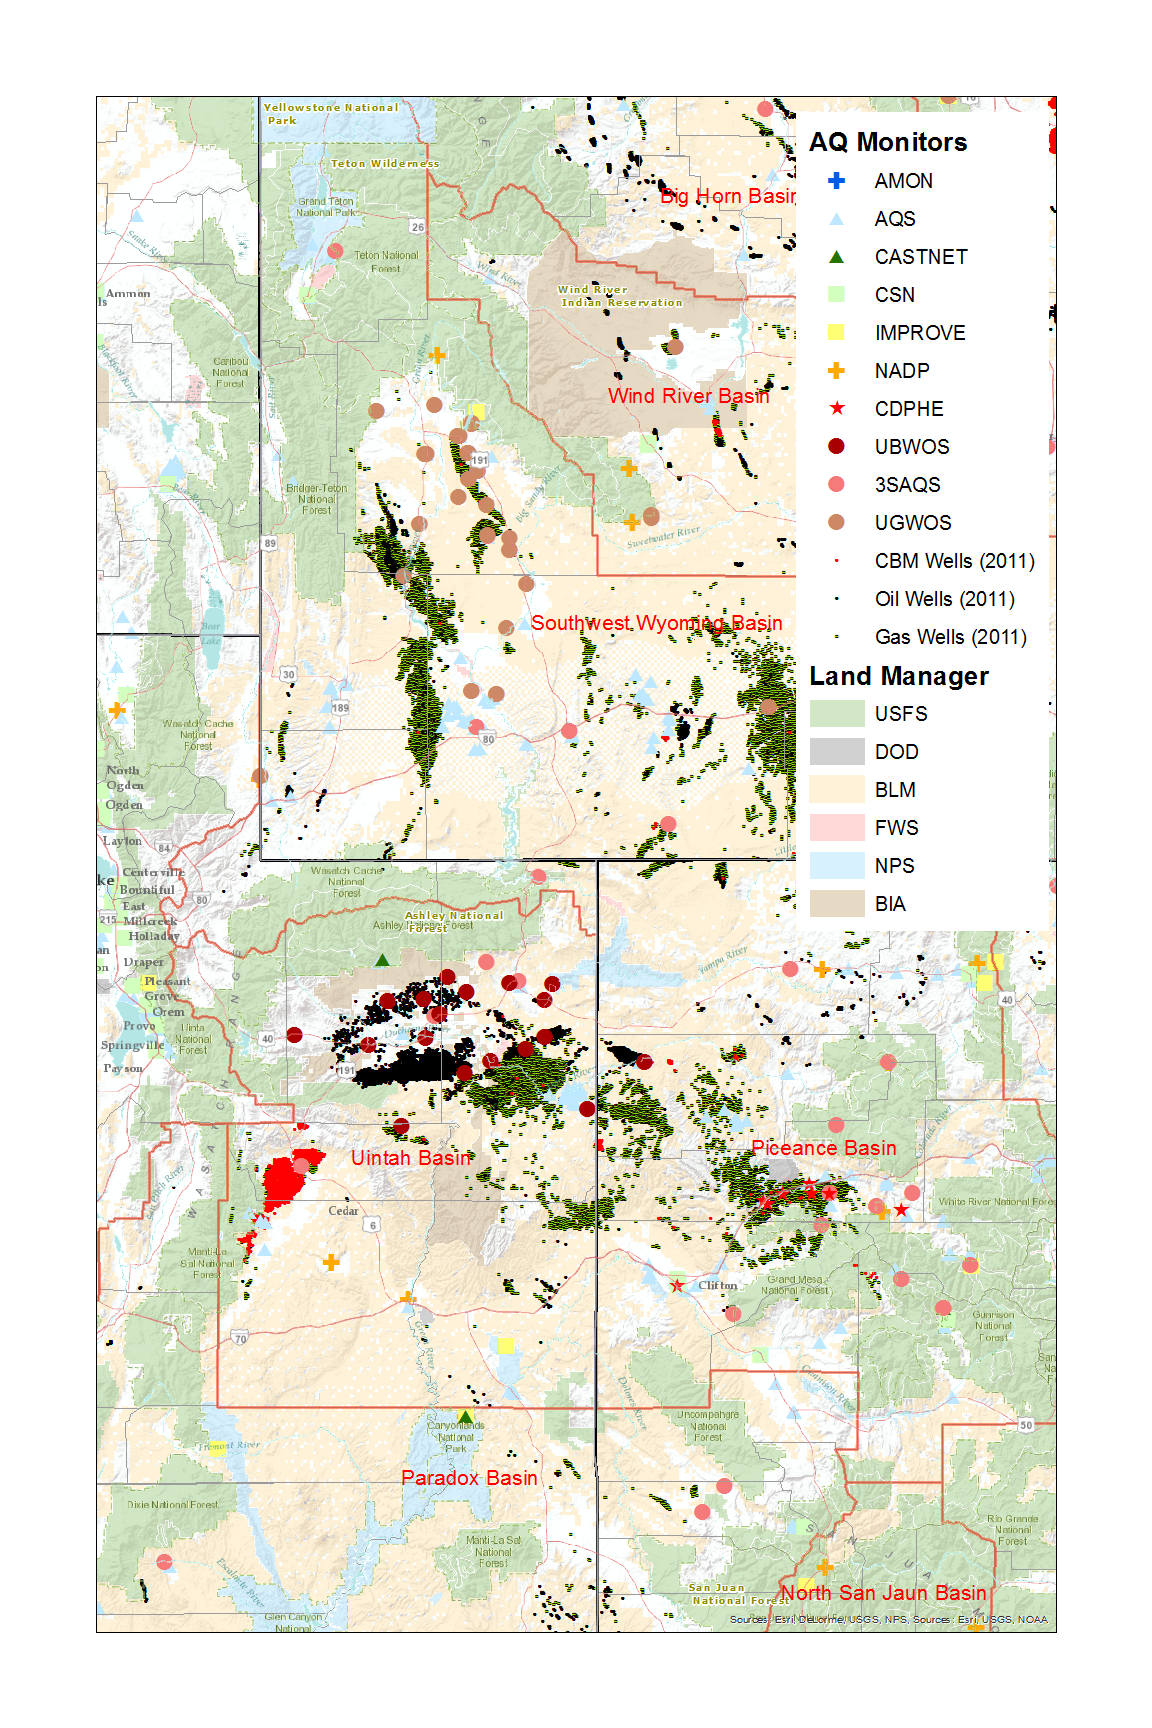
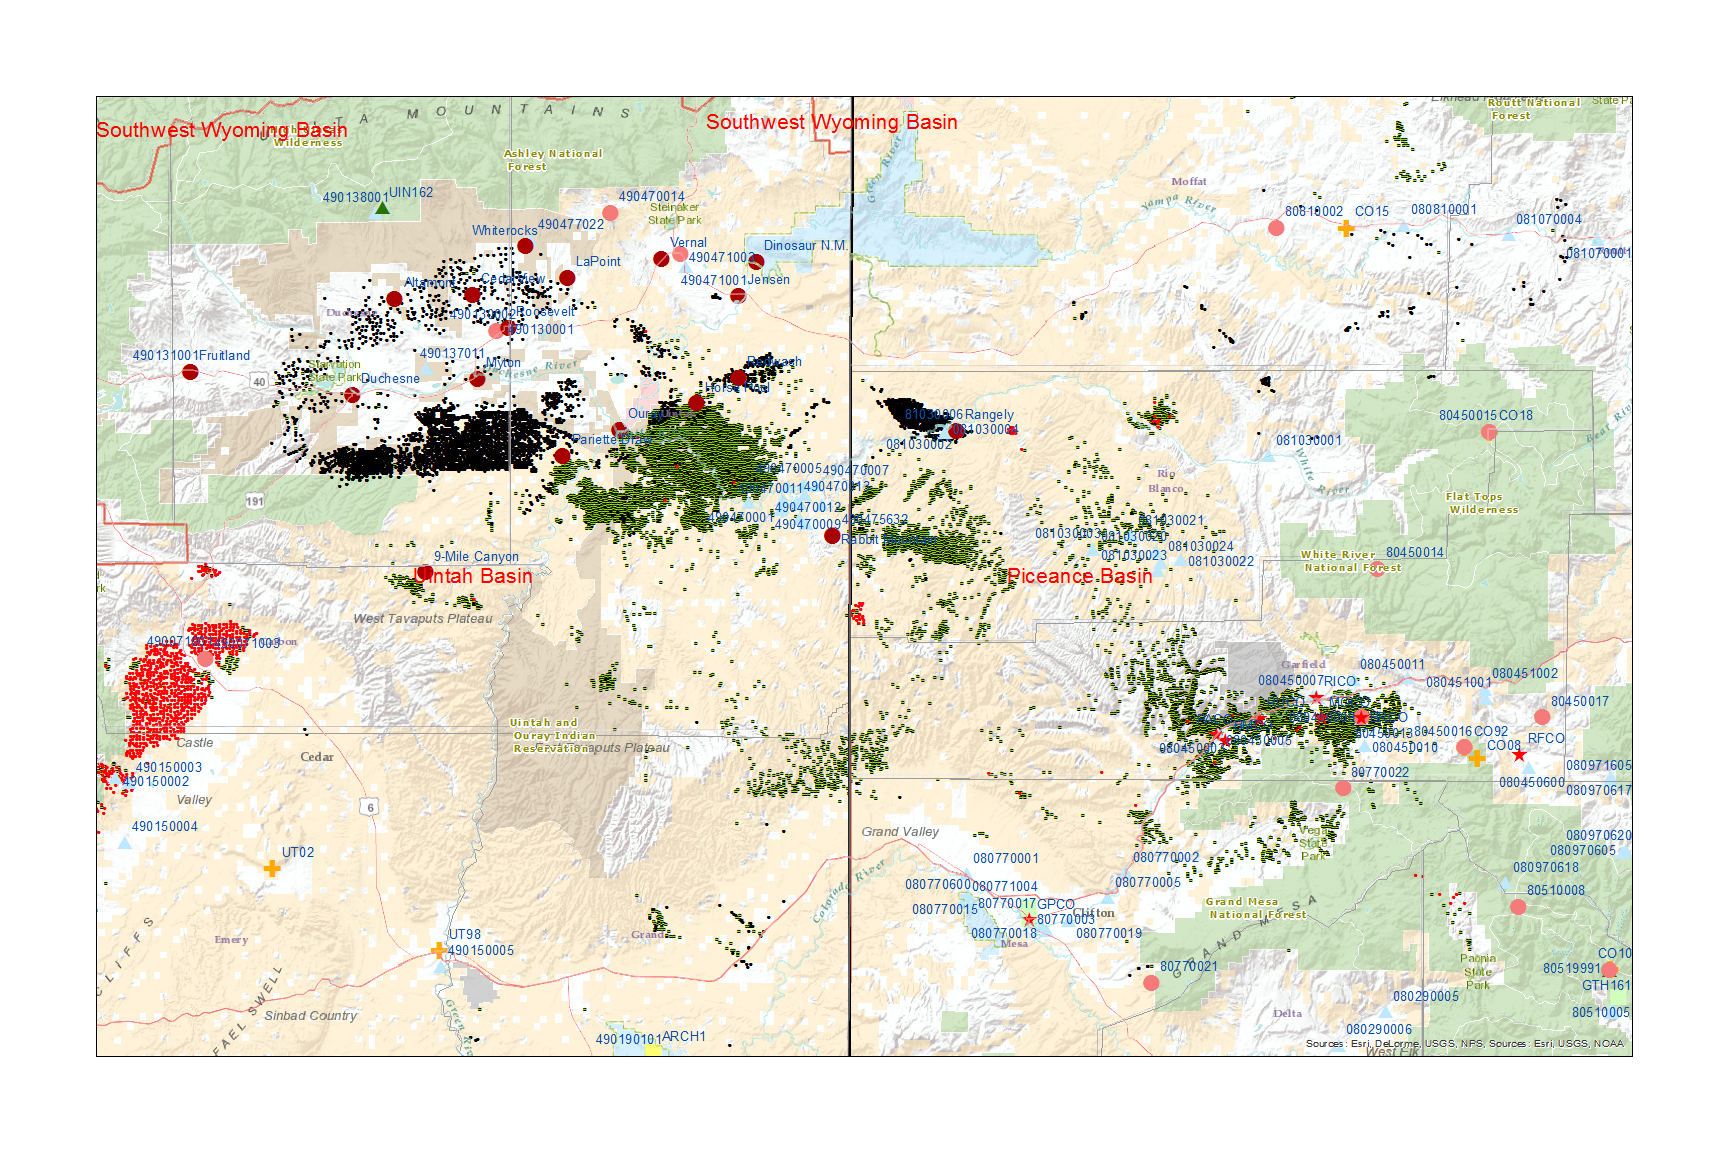
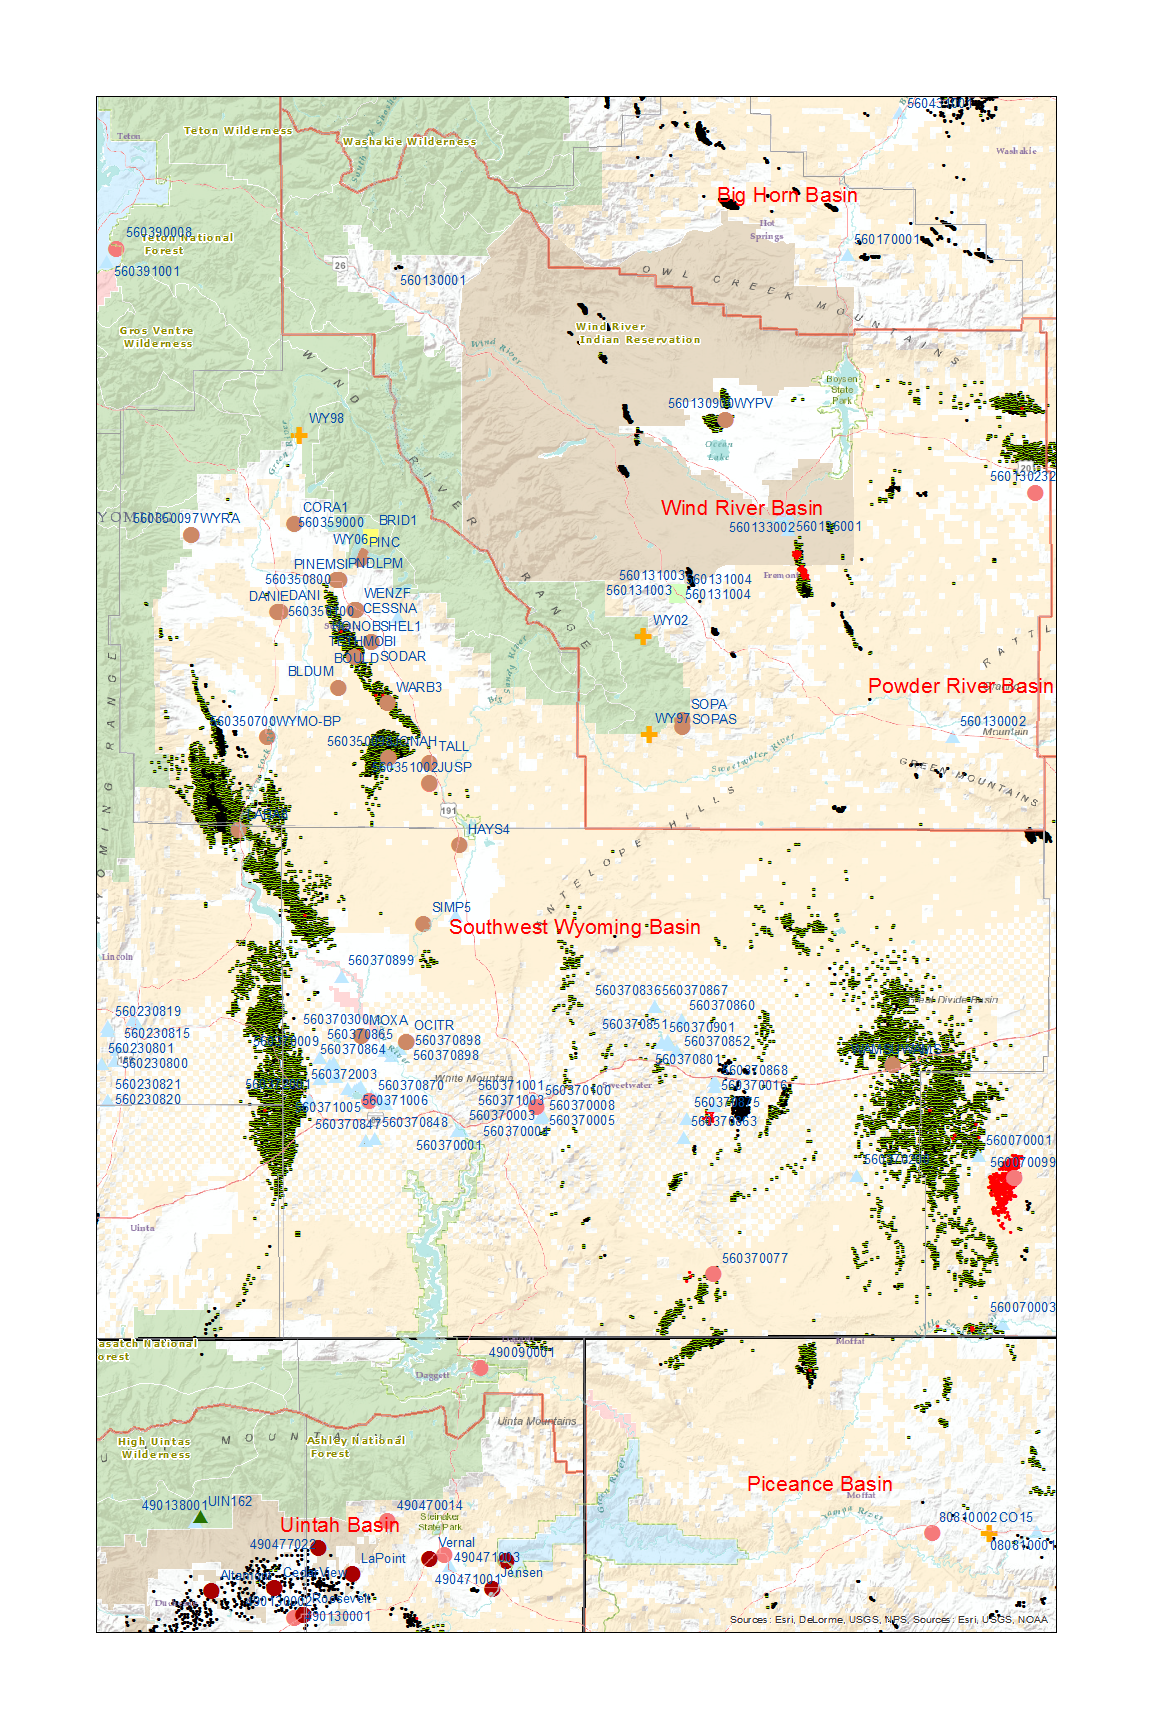
Monitoring Maps