WAQS Phase II Source Apportionment Modeling
Abstract
Phase II of the Western Air Quality Study (WAQS) conducted three rounds of ozone and particulate matter (PM) source apportionment (SA) modeling using the CAMx 2011 modeling platform: (1) geographic region state-specific anthropogenic emissions; (2) source-sector-specific; and (3) “Clean” runs to obtain United States and North American Background (USB and NAB). The ozone and PM SA results were extracted at monitoring sites and across a 36 km resolution virtual monitoring network for the WESTUS in CSV files. A SA visualization tool was developed to display the Round 1 and 2 ozone SA modeling results.Overview
The WAQS Phase II ozone and PM source apportionment (SA) modeling was conducted using the Comprehensive Air-quality Model with extensions (CAMx) photochemical grid model (PGM) Ozone Source Apportionment Technology (OSAT) and Particulate Source Apportionment Technology (PSAT). Three rounds of WAQS ozone and PM SA modeling were conducted following the procedures in the August 28, 2015 SA Modeling Plan with the first two rounds of SA modeling focused on geographic region (state-specific) and source-sector-specific ozone and PM contributions within the continental U.S. (CONUS) 36 km modeling domain. The third round of SA modeling was left open in the SA Modeling Plan and was ultimately used to examine United States and North American Background (USB and NAB) ozone and PM concentrations. A brief description of the CAMx OSAT/PSAT source apportionment tools is provided in the SA Modeling Plan with more details provided in Chapter 7 of the CAMx User’s Guide.The WAQS Rounds 1 and 2 CAMx SA modeling results for Maximum Daily Average 8-Hour (MDA8) ozone and 24-hour fine particulate matter (PM2.5) were extracted at ozone or PM monitoring sites throughout the U.S. In addition, because of the sparse monitoring networks in the western U.S. (WESTUS), the MDA8 ozone and 24-hour PM2.5 SA results were extracted across a virtual monitoring network across the WESTUS using a 36 km resolution. The Rounds 1 and 2 SA MDA8 ozone and 24-hour PM2.5 modeling results are available at all sites and days of the 2011 modeling year in CSV files. In addition, the Rounds 1 and 2 MDA8 ozone SA modeling results can be displayed through a web-based SA Visualization Tool.
The modeling results at monitoring sites are identified by the 8 digit AIRS code that has two digits for the State, 3 digits for the County and four diguts for the Site Code within the County. A more complete description of AQS, CASTNet, IMPROVE, and the WESTUS virtual grid, including site codes and locations, are contained in the Cross Reference files available at:
ftp://viking.cira.colostate.edu/pub/SourceApportionment/Site_Xref/
WAQS Round 1 SA: Geographic Region Source Apportionment Modeling
The WAQS Round 1 SA modeling used the WAQS 2011a Modeling Platform to estimate the contributions of western states’ anthropogenic emissions to downwind ozone and PM2.5 concentrations across the CONUS domain in a similar manner to that used by EPA in the Cross State Air Pollutions Rule (CSAPR) only under 2011a base case emission instead of future year emission conditions. The Round 1 Geographic Region SA modeling was run with 21 Source Regions as shown below that corresponding to: (a) grid cell definitions of 17 western states; (b) the remainder of the eastern U.S. states (EUSA); (c) Canada (CAN); (d) Mexico (MEX); and (e) Offshore Shipping and oil and gas sources (OSS). The WAQS Round 1 SA modeling obtained separate contributions for the 21 Source Regions and 4 different Source Sectors as follows:
- ANT = Anthropogenic Emissions
- NAT = Natural Emissions (biogenic VOC and NOx, lighting NOx; sea salt and windblown dust PM)
- WF = Wildfires
- RX = Prescribed burns
- AG = Agricultural burning
Source contributions are also obtained for Initial Concentrations (IC) and Boundary Conditions (BC) that are the concentrations around the boundaries of the CONUS 36 km modeling domain that were based on the MOZART Global Chemistry Model (GCM).
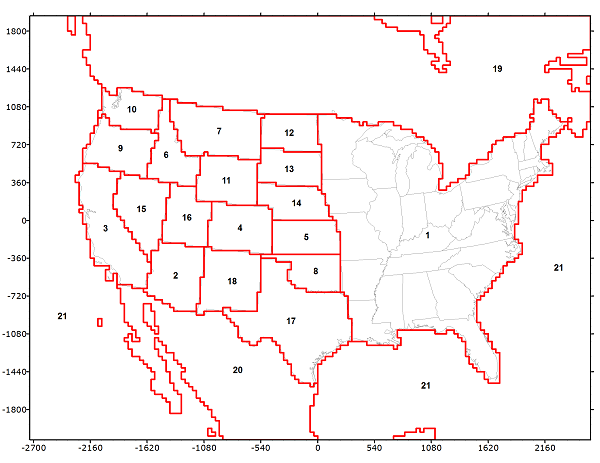
The WAQS Round 1 ozone SA modeling was conducted on the WAQS 36 km CONUS and 12 km WESTUS domain using two-way grid nesting. The WAQS Round 1 PM SA modeling was conducted on just the 36 km CONUS domain. The PM SA modeling was performed to obtain the state-specific PM contributions for sulfur (SO4), nitrogen (NO3/NH4) and primary PM tracer contributions. However, the CAMx SA modeling did not obtain contributions due to Secondary Organic Aerosol (SOA). The CAMx normal model output does provides a separation of SOA contributions due to biogenic (SOAB) emissions (terpenes, sesquiterpenes, isoprene) versus anthropogenic (SOAA) emissions (aromatic VOCs), although the SOAB vs. SOAA distinction is a procedural rather than exact definition (e.g., some anthropogenic VOC sources emit isoprene, but they are swamped by biogenic isoprene emissions).
The WAQS Round 1 ozone SA 12 km and 36 km modeling results at AQS and CASTNet monitoring sites, as well as the 36 km WESTUS virtual monitoring network, can be displayed for each day of the 2011 modeling period using a web-based SA Visualization Tool
The WAQS Round 1 ozone and PM SA modeling results at CASTNet and AQS sites are also available for download in CSV files that can be accessed at:
ftp://viking.cira.colostate.edu/pub/SourceApportionment/Round1_Geographic/
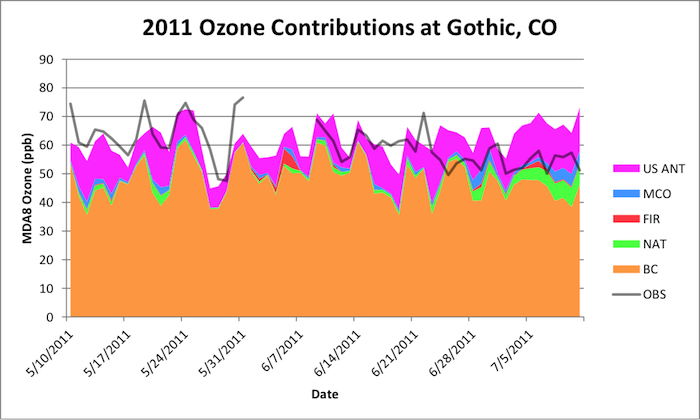
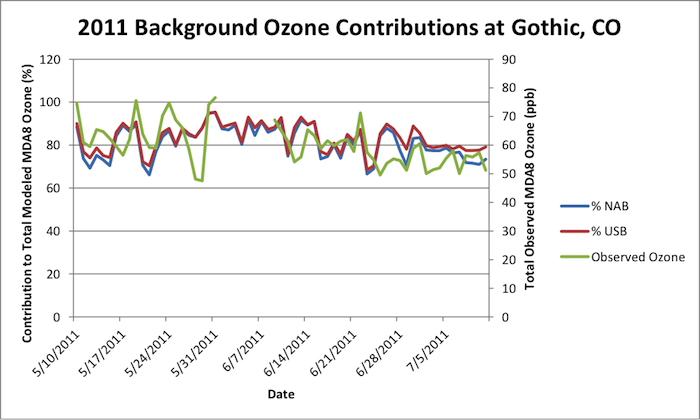
Time series of the WAQS Round 1 ozone SA MDA8 ozone modeling results can also be displayed using interactive Excel spreadsheets. These data are available at CASTNet sites for the 12 km WESTUS and 36 km CONUS domains and at AQS sites for the 12 km WESTUS domain. The user selects the monitoring site and the time period to be displayed and the interactive spreadsheet generates two plots:
- A stack bar chart time series plot that displays:
- BC = Boundary Conditions (BCs) from the BCs of the 36 km CONUS domain.
- NAT = Natural emissions (biogenic, Lightning NOx, windblown dust and sea salt)
- FIR = Open land fires (WF, RX, Ag)
- MCO = Mexico, Canada and Offshore emissions
- US ANT = U.S. Anthropogenic emissions]
- OBS = Observed MDA8 ozone (as line time series)
- Time series plots (Lines) of the percent modeled MDA8 ozone for the SA version of USB (United States Background) and NAB (North American Background). Note, that this is not true USB ozone as SA is used to remove the contributions of U.S. anthropogenic emissions instead of performing a separate U.S. anthropogenic emissions zero-out run.
- Observed Ozone
- % NAB = Percent North American Background to total MDA8 ozone
- % USB = Percent United States Background to total MDA8 ozone
The three R1 SA MDA8 ozone interactive Excel spread sheets can be accessed at:
ftp://viking.cira.colostate.edu/pub/SourceApportionment/R1_SA_Interactive_Spreadsheets/
WAQS Round 2 SA: Source-Sector-Specific Source Apportionment Modeling
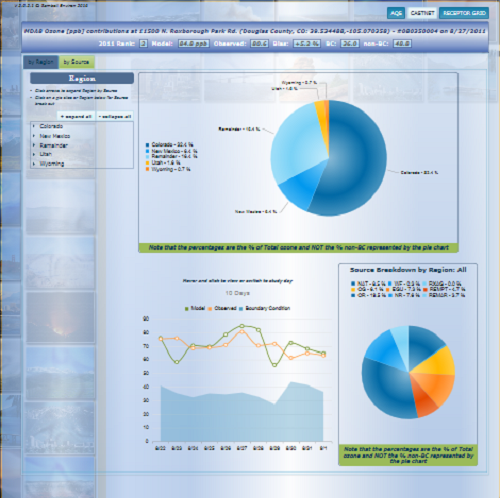
The WAQS Round 2 Source-sector-Specific SA modeling used the WAQS CAMx 2011b Modeling Platform 2011b Modeling Platform to obtain separate ozone and PM2.5 contributions for the following Source-Sectors:
- NAT = Natural Emissions (Biogenic, Lightning NOx, Sea Salt and Windblown Dust)
- WF = Wildfires
- RXAG = Prescribed Burns and Agricultural Burning
- OG = Oil and Gas (Upstream and some Midstream)
- EGU = Electrical Generating Unit point sources
- REMPT = Remainder point sources that are not EGU or OG
- OR = On-Road Mobile Sources
- NR = Non-Road Mobile Sources
- REMAR = Remainder area (anthropogenic) sources
The WAQS Round 2 SA modeling was conducted using 5 geographic regions corresponding to the four intermountain west states (Colorado, New Mexico, Utah and Wyoming) and the remainder of the CONUS modeling domain (Remainder). The Round 2 SA modeling was performed on the 36/12 km CONUS/WEST domains and the Round 2 PM SA modeling was conducted on the 36 km CONUS domain.
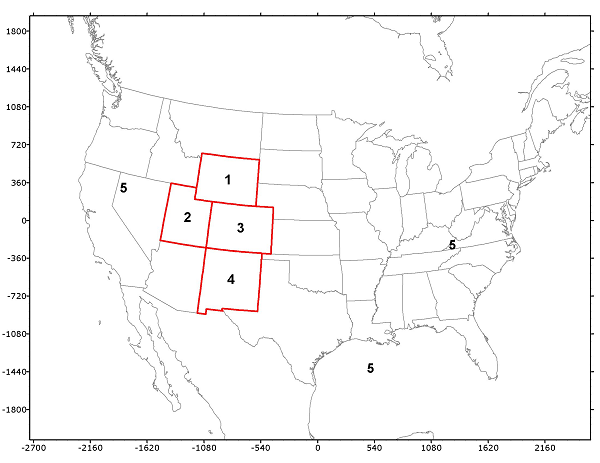
Results for the Round 2 ozone SA modeling can be displayed using web-based Round 2 ozone SA Visualization Tool:
Results for the Round 2 ozone and PM SA modeling for locations corresponding to monitoring sites and the WESTUS 36 km virtual monitoring network can be downloaded in CSV file from:
ftp://viking.cira.colostate.edu/pub/SourceApportionment/Round2_Source/
WAQS Round 3 SA: Clean Ozone and PM Source Apportionment Modeling
The WAQS third round of SA modeling performed Clean model simulations that estimated United States Background (USB) and North American Background (NAB) ozone and PM2.5 concentrations. USB is the level of ozone or PM2.5 concentrations that occurs in the absence of U.S. anthropogenic emissions (i.e., due to CONUS BCs for sources outside of the CONUS domain including international transport and stratospheric ozone and natural emissions and Canadian and Mexican anthropogenic emissions within the CONUS domain). NAB is defined similarly without any North American anthropogenic emissions. The Round 3 Clean runs were done in part to present at EPA’s February 24-25, 2016 Workshop on Background Ozone. Prior to the Workshop, EPA prepared a White Paper on Background Ozone dated December 30, 2015 that describes the concept of USB and several modeling studies.
A description of the WAQS Round 3 Clean CAMx SA simulations is contained in the Clean Run Specification Sheet. The Clean CAMx runs were performed using the 2011b Modeling Platform run with no U.S. anthropogenic emissions on the 36 km CONUS domain to obtain ozone and PM contributions for the following five source categories:
- Mexico, Canada and Offshore (MCO) anthropogenic emissions;
- Combined Open Land Fires (Wildfires, Prescribed Burns and Agricultural Burning);
- Natural Emissions (biogenic, lightning NOx, sea salt and windblown dust);
- Initial Concentrations (IC); and
- Boundary Conditions (BC) around the 36 km CONUS domain
Clean runs were conducted using three different sets of BCs around the 36 km CONUS domain based on three Global Chemistry Models (GCMs):
For ozone, displays were made for the highest and fourth highest MDA8 ozone during 2011 for the following three emissions scenarios using all three sets of BCs (MZBC, GCBC and AMBC):
- USB = U.S. Background ozone (no U.S. anthropogenic emissions);
- NAB = North American Background (no anthropogenic emissions in CONUS domain); and
- USB-Fires = USB without open land fires.
Note that the USB displays using the CAMx Clean runs were true USB calculations (i.e., zero-out U.S. anthropogenic emissions), but the NAB and USB-Fire displays are not because the presence of the Mexico, Canada and offshore (MCO) anthropogenic emissions (NAB) or open land fires (USB-Fires) were eliminated by subtracting their source apportionment contributions rather than separate CAMx model simulations with their emissions eliminated (zero-out).
The CAMx Clean runs absolute model concentration USB/NAB ozone displays for the CONUS domain using the MZBC and GCBC GCM BCs are available in MSWORD documents and the highest and fourth highest MDA8 ozone concentrations using the 2011 meteorological modeling year:
USB/NAB Ozone for Highest MDA8 Ozone (DOCX)
USB/NAB Ozone for 4th Highest MDA8 Ozone (DOCX)
The CAMx Clean runs using the AMBC BCs produced abnormally high ozone concentrations so are not included in the displays in the above links. We believe this is due to the AM3 GCM having high ozone of stratospheric ozone lower in the atmosphere than MOZART and GEOS-Chem and the WAQS CAMx model configuration (25 layers) having insufficient vertical resolution in the upper troposphere so mixes too much of the AM3 stratospheric ozone down to the surface in the CAMx Clean AMBC simulation.
Similar USB results are available for annual PM2.5 concentrations and highest and 98th percentile (8th highest) 24-hour PM2.5 concentrations. Since the CAMx Clean simulations were not run with the PSAT source apportionment tool to tag the Mexico, Canada and Offshore emissions, estimates of NAB annual and 24-hour PM2.5 are not available, so we just have USB PM2.5 whose spatial distribution are available at the following links:
Annual_Avg_PM2.5 (DOCX)
8th_high_daily_PM2.5 (DOCX)
For the CAMx Clean MZBC simulations, ozone Design Values were calculated for the USB, NAB and USB-Fire conditions using EPA’s Modeled Attainment Test Software (MATS). MATS follows EPA’s recommended approach (EPA, 2014) for projecting future year ozone Design Values (DVF) that uses the relative change in the current year (2011b) and future year (Clean Run) modeling results (relative response factors, RRFs) to scale the observed current year ozone Design Value (DVC) to obtain the future year DVF (DVF = DVC x RRF). The MATS USB, NAB and USB-Fires Clean ozone DVF results are available in an MSWORD document:
Similar spatial results of MATS DVF projections for MZBC CAMx Clean simulation are available for annual PM2.5 DVs at the linke below, MATS does not do spatial analysis for the 24-hour PM2.5 NAAQS:
MATS.PM2.5.Annual.WAQS.Clean_MZBC_36 (DOCX)
An archive of high resolution images included in the above Round 3 documents can be accessed at: ftp://viking.cira.colostate.edu/pub/SourceApportionment/R3_SA_PNG/
Example SA Modeling Results
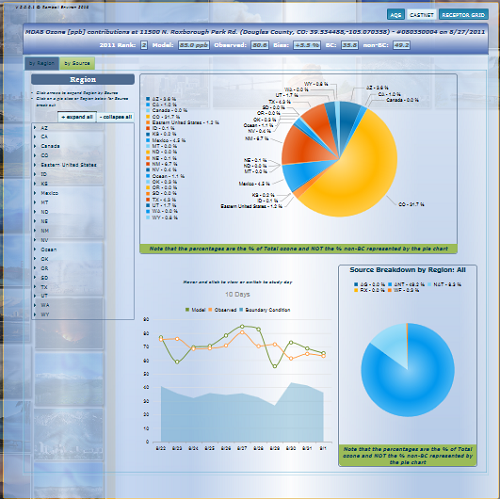
Example WAQS SA modeling results are presented for each round of SA modeling. For Rounds 1 and 2 ozone SA modeling results are displayed for the Chatfield AQS monitoring site (08035005) located in the southern portion of the Denver Nonattainment Area and were obtained from the SA Visualization Tool. For the Round 3 Clean simulations, examples of USB, NAB and USB-Fire ozone background results are presented for the GCBC BCs and using the 4th highest MDA8 ozone absolute and MATS ozone DVF relative modeling results.
Example Round 1 Geographic SA Ozone Modeling Results from Visualization Tool:
Example Round 1 Modeling Results from Interactive Excel Spreadsheets:
Example Round 2 Source-Sector Ozone Modeling Results:
Example Round 3 Clean Ozone Absolute (4th High MDA8) and Relative (DVF) Modeling Results:

