Interim WEP/AOI Analysis – April 2, 2020
Interim Weighted Emissions Potential (WEP) and Area of Influence (AOI) products are being made available for Regional Haze planning uses. Remaining regional SMOKE emissions modeling is being conducted for the disaggregated California 2028 emissions. Once those disaggregated emissions are ready they will be combined with emissions from the other WRAP states to provide consistent and final Source Sectors’ data for the final WEP analysis, and the plots and this description will be updated as needed.
Interim WEP/AOI Products
The following link provides access to the interim WEP/AOI displays using the directory structure described below.
WEP/AOI products are available for 76 IMPROVE sites that represent 116 Class I areas in the 13 WRAP contiguous and neighboring states in the western U.S. The results are calculated for the 12WUS2 modeling domain aggregated to 36 kilometer resolution. For each Class I area there are four directories containing the various analysis products. The directory structure and analysis products are shown below using the Mesa Verde National Park (MEVE) results as an example:
├── MEVE
│ ├── RT
│ ├── EWRT
│ ├── WEP
│ ├── EC
│ ├── NOx
│ ├── POA
│ ├── SOx
│ └── RANK_POINT
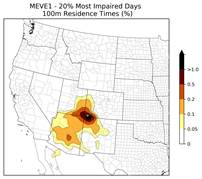
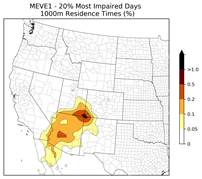
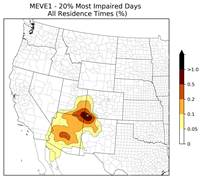
Residence Time (RT): The RT folder contains plots showing the Area of Influence (AOI) that back trajectories of air parcels traveling from a given location arrived at the Mesa Verde National Park (MEVE) Class I area IMPROVE site on the Most Impaired Days (MIDs) during each year of the 5-year period from 2014 through 2018. HYSPLIT 72-hour back trajectories are calculated to arrive on each of the MIDs four times a day (6:00, 12:00, 18:00, 24:00 local standard time) and at four heights above the ground (100 m, 200 m, 500 m and 1,000 m). Plots are provided for the 100m and 1000m heights and for a combined analysis in which data from all trajectory heights are aggregated (All). RT plots for Mesa Verde National Park (MEVE) are provided as an example in Figure 1.
|
|
|
|
|
Figure 1. Residence Time (RT) analysis for Mesa Verde National Park (MEVE) Class I area IMPROVE monitoring site and back trajectories that arrive at the site on the Most Impaired Days for each year 2014-2018 at 100 m (left), 1000 m (middle) and All (right) heights above ground. |
||
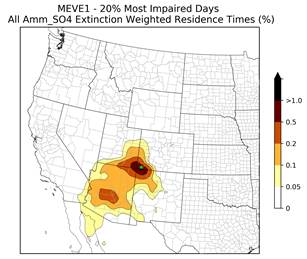
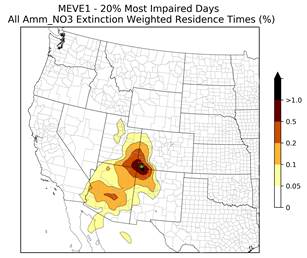
Emissions Weighted Residence Time (EWRT): EWRT are calculated by weighting the HYSPLIT trajectories by the monitored extinction at the IMPROVE site on each MID. Each Class I area EWRT folder contains 12 plots showing the extinction weighted for sulfate (Amm_SO4), nitrate (Amm_NO3), Organic Aerosol (OA) and Elemental Carbon (EC) at three heights (100 m, 1000 m, All) (12 = 3 x 4). Figure 2 shows the EWRT plots for sulfate and nitrate at MEVE using the aggregated trajectory height analysis (All) as an example.
|
|
|
|
Figure 2. Extinction Weighted Residence Time (EWRT) analysis for ammonium sulfate (Amm_SO4) and ammonium nitrate (Amm_NO3) at the Mesa Verde (MEVE) IMPROVE monitor for the Most Impaired Days during 2014-2018 aggregated across all trajectory heights. |
|
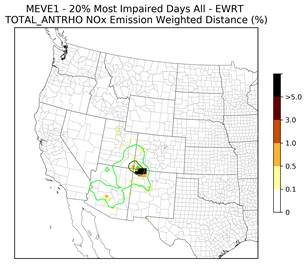
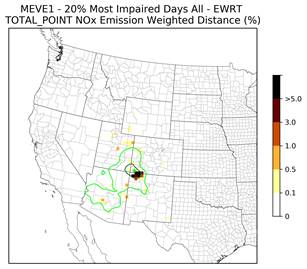
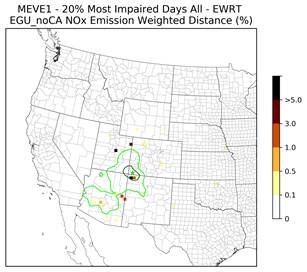
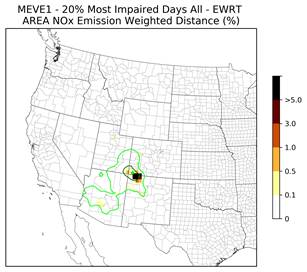
Weighted Emissions Potential (WEP): WEP is obtained by overlaying the EWRT results with 2028 emissions of light extinction precursors (e.g., NOx emissions for ammonium nitrate extinction). The WEP folder contains four subfolders corresponding to the precursor emissions for four major components of light extinction: EC (Elemental Carbon), NOx (Ammonium Nitrate), POA (Organic Aerosol) and SOx (Ammonium Sulfate). Each precursor species subfolder contains 18 plots in which the EWRT at three heights above ground are overlaid with 2028 emissions from 6 gridded Source Sectors (18 = 3 x 6). The source sectors are listed below, and example plots for MEVE are shown in Figure 3.
· TOTAL_ANTRHO – All anthropogenic emissions
· TOTAL_POINT – All point source emissions
· EGU_noCA – Electrical Generating Unit point source emissions except those in California
· ON-ROAD – On-road mobile source emissions
· AREA – Low-level area source emissions (e.g., non-road, non-point oil and gas, other non-point, locomotive, and Category 1&2 marine vessels)
· CMV_OGV – Large ocean-going vessels
|
|
|
|
|
|
|
Figure 3. Weighted Emissions Potential (WEP) analysis for ammonium nitrate extinction at the Mesa Verde National Park (MEVE) Class I area IMPROVE monitor on the Most Impaired Days during each year of 2014-2018 for NOx emissions from four Source Sectors: (1) total anthropogenic (top left), (2) total point source (top right), (3) EGU point source except California (bottom left) and (4) low-level area source (bottom right). Results are aggregated across all trajectories’ heights. |
|
Rank_Point: The Rank_Point folder contains six csv files that consist of facility level 2028 emissions for NOx or SOx sources overlaid with the corresponding EWRT for ammonium nitrate or ammonium sulfate, respectively, for 3 trajectory height scenarios (100m, 1000m and All). The columns of the Rank_Point files are described in Table 1 below.
These results can be used to assess the potential contributions of specific facilities to visibility impairment at each Class I Area in various ways. The QoverD_NOX and QoverD_SO2 provide the simple emissions over distance metric (Q/D) using the 2028 OTB facility-level NOx and SO2 emissions, respectively. While the Q/D metric can be used to screen the potential contributions of sources to visibility impairment at a given Class I area, it is simply based on the emission rate and distance from the IMPROVE monitor and does not account for the air parcel trajectories on the MIDs. Note that the Rank_Point QoverD metric is different than the Regional Haze Planning Workgroup (RHPWG) Control Measures Subcommittee (CMS) Q/D Analysis in that Rank_Point is using 2028OTB emissions, whereas the RHPWG/CMS Q/D Analysis used 2014 emissions. [ADD HYPERLINK TO HIGHLIGHTED TEXT; https://views.cira.colostate.edu/tssv2/Emissions/QDAnalysis.aspx]
The EWRTxQ and EWRTxQ/D metrics for NOx and SO2 do account for the air parcel trajectories on MIDs as they are calculated by multiplying the EWRT of the grid cell of the facility with the facility’s emission rate (Q) and Q/D, respectively.
Table 2 shows a subset of the results for NOx sources at MEVE aggregated across all trajectory heights. The sources are ranked by [Q/D x EWRT] (last column) for ammonium nitrate and the top 30 facilities whose NOx emissions potentially contribute to visibility impairment on the 2014-2018 IMPROVE MIDs at MEVE are shown.
Table 1. Column listing and description for the Rank_Point csv files.
|
Column |
Description |
|
FacilityID |
Plant identification code |
|
FacilityName |
Plant name |
|
Latitude |
Latitude |
|
Longitude |
Longitude |
|
State |
State in which the plant is located. It is determined by FIPS code. If there is no value, plant is either on tribal land or in the ocean (e.g., offshore O&G platform) |
|
NAICS |
North American Industry Classification System (NAICS) - an industry classification system https://www.census.gov/eos/www/naics/ |
|
NAICSDesc |
Description of NAICS code |
|
NOX_tpy |
2028OTB Facility-level NOx emission rate in tons pers year (Q in NOx Q/D calculations) |
|
SO2_tpy |
2028OTB Facility-level SO2 emission rate in tons per year |
|
ij |
The grid cell of the facility in the 12WUS2 modeling domain (aggregated to 36 km resolution). Format is row (i) *1000 + column (j). |
|
distance |
Distance in meters between the facility and the IMPROVE monitor that represents the Class I area (D in Q/D calculations). Distances are calculated using the Lambert Conformal Conic projection of the 12WUS2 modeling domain. |
|
EWRT_NO3_IJ |
The Amm_NO3 extinction weighted residence time (EWRT) for the grid cell of the facility (ij) |
|
QoverD_NOX |
The facility's NOx emissions (Q) in tons/year divided by the distance to the IMPROVE monitor (D) in kilometers. |
|
EWRTxQ_NO3 |
The Amm_NO3 EWRT for the grid cell of the facility (ij) multiplied by the facility-level NOx emissions (Q) |
|
EWRTxQoverD_NO3 |
The Amm_NO3 EWRT for the grid cell of the facility (ij) multiplied by the facility's Q/D for NOx (QoverD_NOX) |
|
EWRT_SO4_IJ |
The Amm_SO4 extinction weighted residence time (EWRT) for the grid cell of the facility (ij) |
|
QoverD_SO2 |
The facility's SO2 emissions (Q) in tons/year divided by the distance to the IMPROVE monitor (D) in kilometers |
|
EWRTxQ_SO4 |
The Amm_SO4 EWRT for the grid cell of the facility (ij) multiplied by the facility-level SO2 emissions (Q) |
|
EWRTxQoverD_SO4 |
The Amm_SO4 EWRT for the grid cell of the facility (ij) multiplied by the facility's Q/D for SO2 (QoverD_SO2) |
Table 2. Rank_Point results showing top 30 facilities ranked by [(Q/D) x EWRT_AmmNO3] whose NOx emissions have the potential to contribute to visibility impairment due to Ammonium Nitrate at MEVE on the Most Impaired Days for each year in 2014-2018.
|
FacilityID |
FacilityName |
State |
NAICS |
NAICSDesc |
NOX_tpy |
distance |
QoverD |
EWRTxQ |
EWRTxQ/D |
|
7197711 |
Four Corners Power Plant |
0 |
221112 |
Fossil Fuel Electric Power Generation |
4060.4 |
56621 |
71.7 |
17046392 |
301062 |
|
7230311 |
Kutz Canyon Processing Plant |
NM |
21112 |
0 |
751.6 |
74910 |
10.0 |
4706391 |
62827 |
|
1158 |
Kutz Canyon Processing Plant |
NM |
21113 |
0 |
677.3 |
75422 |
9.0 |
4241210 |
56233 |
|
3552 |
Blanco Compressor C & D Station |
NM |
48621 |
Pipeline Transportation of Natural Gas |
504.0 |
69600 |
7.2 |
3156016 |
45345 |
|
7231911 |
Harvest Pipeline - San Juan Gas Plant |
NM |
21112 |
0 |
494.5 |
69341 |
7.1 |
3096578 |
44657 |
|
1177 |
Harvest Pipeline - San Juan Gas Plant |
NM |
21113 |
0 |
468.1 |
69262 |
6.8 |
2931213 |
42320 |
|
1148 |
Chaco Gas Plant |
NM |
21112 |
0 |
1098.6 |
85699 |
12.8 |
3488257 |
40703 |
|
1147 |
Blanco Compressor Station A |
NM |
48621 |
Pipeline Transportation of Natural Gas |
378.6 |
69618 |
5.4 |
2370957 |
34057 |
|
14939211 |
Ignacio Gas Plant |
0 |
211112 |
Natural Gas Liquid Extraction |
243.1 |
62531 |
3.9 |
1766445 |
28249 |
|
14939111 |
Arkansas Loop Treating Plant |
0 |
211112 |
Natural Gas Liquid Extraction |
236.1 |
64222 |
3.7 |
1715581 |
26713 |
|
8091911 |
San Juan River Gas Plant |
NM |
21112 |
0 |
134.6 |
50009 |
2.7 |
1268501 |
25366 |
|
14936411 |
Coyote Gulch Gas Treating Plant |
0 |
211111 |
Crude Petroleum and Natural Gas Extraction |
53.5 |
43049 |
1.2 |
845074 |
19630 |
|
1192 |
Bloomfield Compressor Station |
NM |
48621 |
Pipeline Transportation of Natural Gas |
216.6 |
70787 |
3.1 |
1356613 |
19165 |
|
14940411 |
Bondad CS |
0 |
48621 |
Pipeline Transportation of Natural Gas |
165.9 |
64511 |
2.6 |
1205686 |
18690 |
|
14938111 |
Jaques Compressor Station |
0 |
211111 |
Crude Petroleum and Natural Gas Extraction |
157.0 |
71789 |
2.2 |
1140814 |
15891 |
|
14937711 |
Worford Ridge Compressor Station |
0 |
211111 |
Crude Petroleum and Natural Gas Extraction |
135.5 |
68670 |
2.0 |
984588 |
14338 |
|
1191 |
Harvest - Thompson Compressor Station |
NM |
213112 |
Support Activities for Oil and Gas Operations |
68.1 |
53141 |
1.3 |
641941 |
12080 |
|
14937211 |
South Ignacio Central Delivery Point |
0 |
2111 |
Oil and Gas Extraction |
128.8 |
77914 |
1.7 |
935904 |
12012 |
|
14940311 |
Animas compressor station |
0 |
2111 |
Oil and Gas Extraction |
88.4 |
53586 |
1.6 |
642344 |
11987 |
|
7992811 |
Val Verde Treatment Plant |
NM |
21112 |
0 |
133.1 |
69691 |
1.9 |
833206 |
11956 |
|
2579411 |
Florida River Compression Facility |
0 |
2111 |
Oil and Gas Extraction |
100.3 |
62833 |
1.6 |
728589 |
11596 |
|
8839911 |
El Paso Natural Gas, Window Rock Compressor Station |
0 |
221210 |
Natural Gas Distribution |
1354.1 |
184054 |
7.4 |
2042111 |
11095 |
|
1252 |
San Juan River Gas Plant |
NM |
21113 |
0 |
58.0 |
49851 |
1.2 |
546917 |
10971 |
|
14936311 |
Pump Canyon Compressor Station |
0 |
2111 |
Oil and Gas Extraction |
110.8 |
74053 |
1.5 |
805110 |
10872 |
|
17134211 |
Ignacio Gas Treating Plant |
0 |
211111 |
Crude Petroleum and Natural Gas Extraction |
95.4 |
64193 |
1.5 |
693208 |
10799 |
|
13646111 |
Bluffview Power Plant |
NM |
221112 |
Fossil Fuel Electric Power Generation |
66.3 |
58864 |
1.1 |
625475 |
10626 |
|
14937311 |
Diamondback Compressor Station |
0 |
2111 |
Oil and Gas Extraction |
83.5 |
59649 |
1.4 |
606739 |
10172 |
|
1276 |
Harvest - Aztec Central Delivery Point |
NM |
213112 |
Support Activities for Oil and Gas Operations |
74.6 |
55839 |
1.3 |
542345 |
9713 |
|
5050511 |
PacifiCorp- Hunter Power Plant |
UT |
221112 |
Fossil Fuel Electric Power Generation |
10001.8 |
310435 |
32.2 |
2963323 |
9546 |
|
6281811 |
Bonanza |
0 |
221112 |
Fossil Fuel Electric Power Generation |
5721.7 |
326655 |
17.5 |
3031499 |
9280 |
Initial Discussion of Results – Mesa Verde National Park (MEVE) Class I area example
The RT, EWRT and WEP results are available for HYSPLIT back trajectories arriving at the IMPROVE site on the MIDs at 5 different heights above ground: 100 m, 200 m, 500 m, 1,000 m and All (combination of all four heights). However, the products of the analysis are not that different for the different heights. For example, the RT plots at MEVE shown in Figure 1 for the 100m, 1000m and All heights are very similar. There are some differences in the relative rankings using the trajectories at different heights. For example, the relative rankings of power plants with tall stacks is higher using the 1,000 m height than 100 m height back trajectories. But examining all trajectory heights increases the number of plots to analyze by a factor of 5, so we recommend using just the All height trajectory as it will include the most data in the RT, EWRT, WEP and Rank_Point displays.