SMOKE 2008b emissions results
Introduction
The 3SAQS used the Sparse Matrix Operator Kernel Emissions (SMOKE) processing system version 3.5.1 to prepare emissions inputs for photochemical grid models (PGMs). The 3SAQS 2008 emissions modeling platform consists of data and software to estimate air emissions fluxes that best represent the conditions in the 3SAQS modeling domain during 2008. The base 2008 modeling period is annual, and included a model spin-up period from December 16 to December 31, 2008. The modeling domain includes a 36 km continental US (CONUS) domain with a 12 km nest over the western U.S.
The following sectors were used to represent air pollutant emissions for the 3SAQS:
- Aircraft/locomotive/marine (ALM)
- Off-road mobile (Nonroad)
- On-road mobile (Onroad)
- Non-point/Area (Nonpoint)
- Fugitive Dust
- Fertilizer
- Livestock
- Residential Wood Combustion (RWC)
- Area oil and gas (Area O&G)
- Point oil and gas (Point O&G)
- Continuous Emission Monitor (CEM) point (EGU Point)
- Non-CEM point (NonEGU Point)
- Offshore shipping (Offshore)
- Fires (Fire)
- Canada and Mexico sources (Non-US)
- MEGAN biogenics (Biogenic)
- Windblown dust (WBD)
- Sea salt
- Lightning
Details of the sources and nature of these emissions data are provided in the 3SAQS 2008 Modeling Protocol.
Results
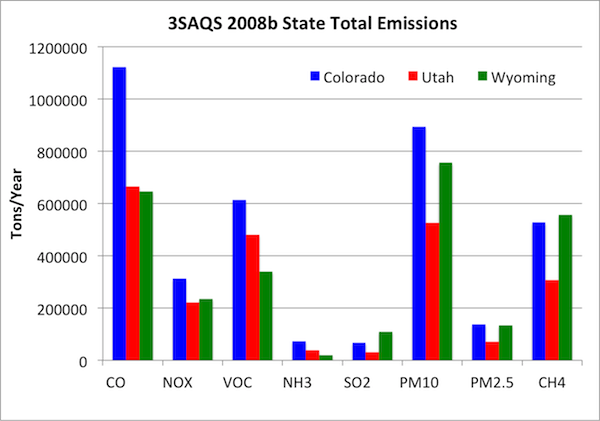
2008 version B results2008 three-state total emissions, inventory sector totals, and comparisons to the 2020 emissions projections from 2008 are presented here. On a state total basis Colorado has the highest 2011 emissions of CO, NOx, VOC, NH3, and methane (CH4) of the three states. Wyoming has the highest 2011 emissions of SO2 and PM species.
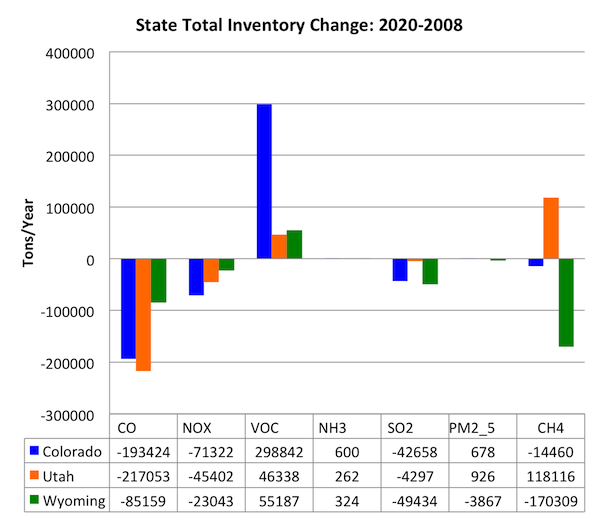
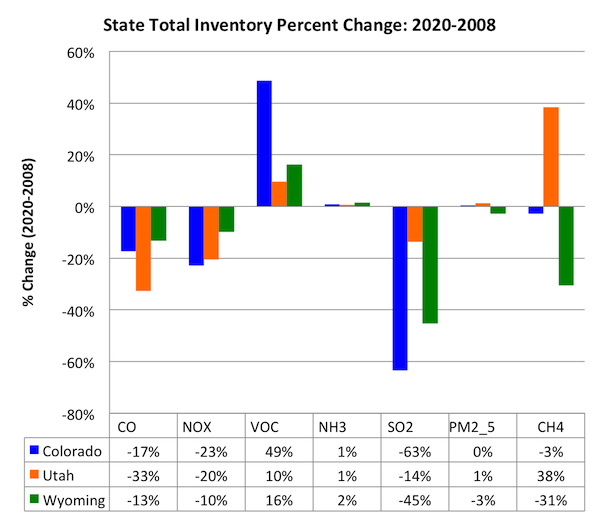
The following table includes plots that breakdown the 2008 3SAQS emissions for each inventory pollutant by sector, monthly total spatial plots, 2020-2008 monthly total difference plots on the 3SAQS 12-km modeling domain.
 |  |
- Carbon Monoxide
- Nitrogen Oxides
- Volatile Organic Compounds
- Ammonia
- Sulfur Dioxide
- Fine Particulate Matter
- Methane