3SAQS/WAQS Monitoring Network Assessments
TheThis Wiki page contains materials for Monitoring Network Assessments conducted by the 3SAQS and WAQS MNA. The Wiki2014 contains3SAQS supplementaryAssessment material forevaluated the status of ambient air quality monitors in Colorado, Wyoming and Utah. The 2017 WAQS MNAstudy expanded the geographical region of the Three State Study to seven states by adding New Mexico, Montana, North Dakota and South Dakota. Final Report,reports, assupplemental wellmaterials, as aand meeting archive for the WAQS MNA Workgroup. Materialsarchives for the 2014 3SAQS and 2017 WAQS MNA are alsoavailable provided in the wiki.below.
Note: The map based images are high resolution. After opening image files in your browser, click on an area of interest to view at higher resolution.
3SAQS 2014
3SAQS Monitoring Network Assessment Technical Memo (9 June, 2014)3SAQS Network Recommendations (27 Feb., 2014)
Document Archive
Cost Survey
WAQS 2017
Final Report
WAQS Monitoring Network Assessment Final Report (3 Nov., 2017)Meetings
WAQS Monitoring Network Assessment Working Group MeetingsWAQS Governing Board 2017.05.05.pptx (5 May, 2017)
WAQS OC 2017.11.06.pptx (6 Nov., 2017)
Monitoring Sites
Tabular Data
Monitors An Excel Workbook that lists monitors in the WAQS region. The Workbook has tabs for all monitors in the WAQS region, and monitors by agency and/or organization. Information in the workbook was obtained from the AQS Monitor Listing file, 2017-05-26 AQS update1Maps
Note The map based image files are high resolution and can be viewed at full resolution in most web browsers by clicking on a specific region of the map after it has downloaded to your browser window.
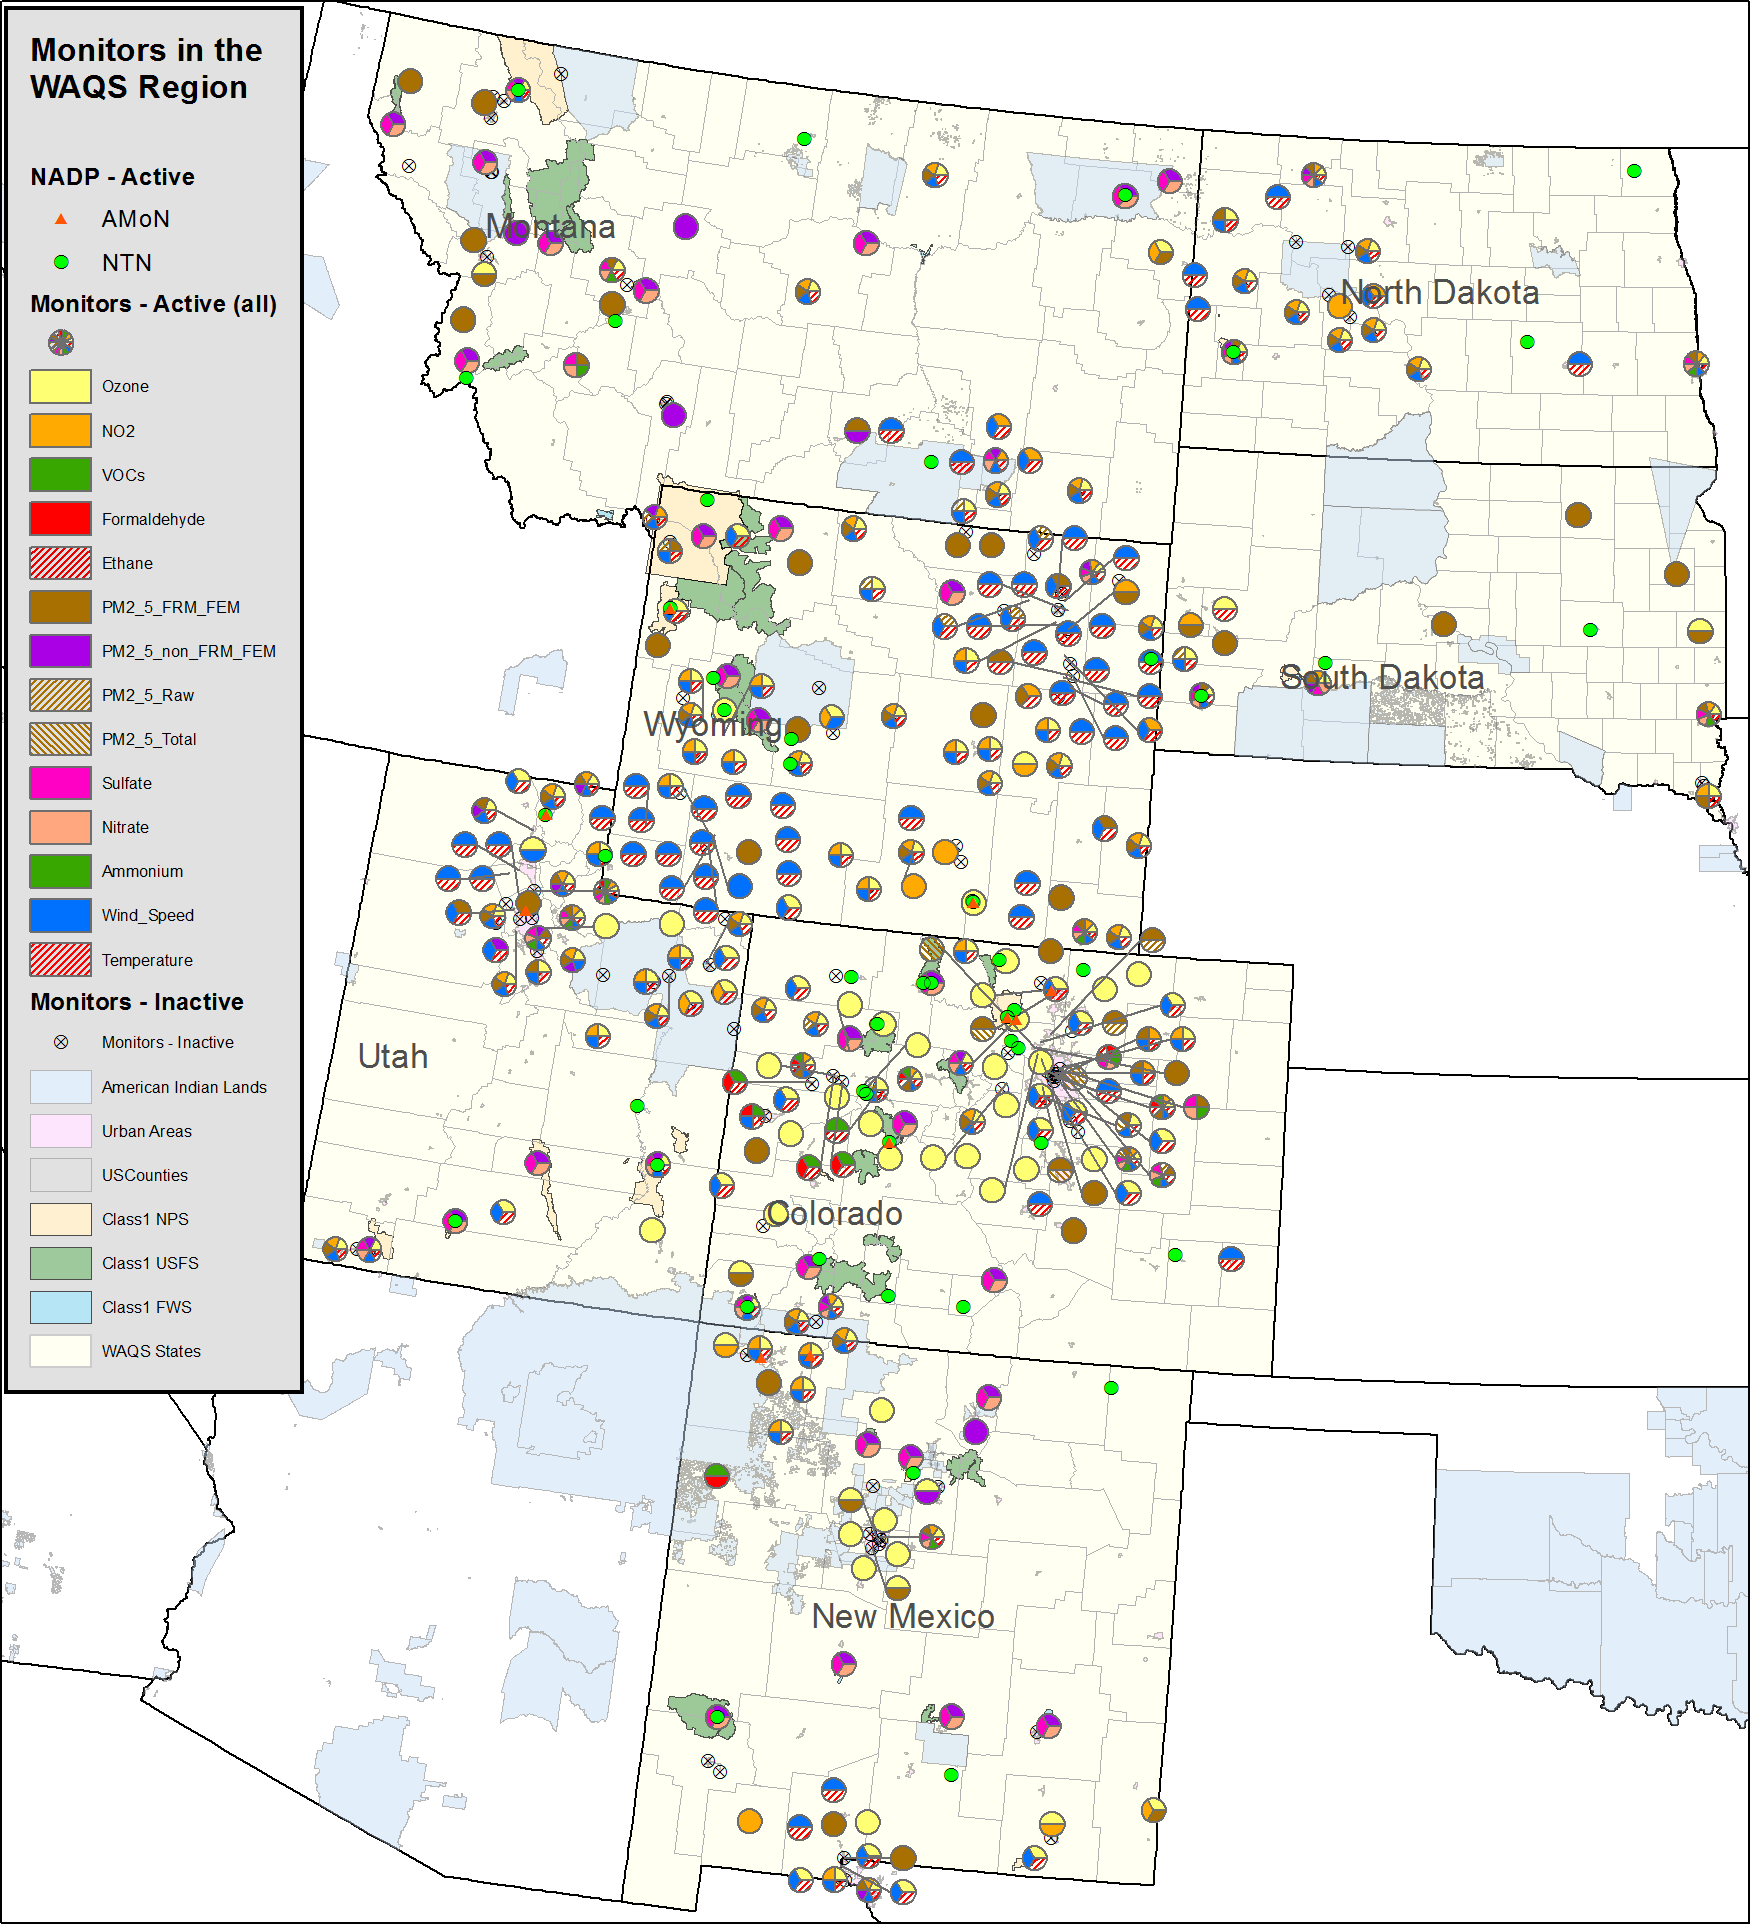
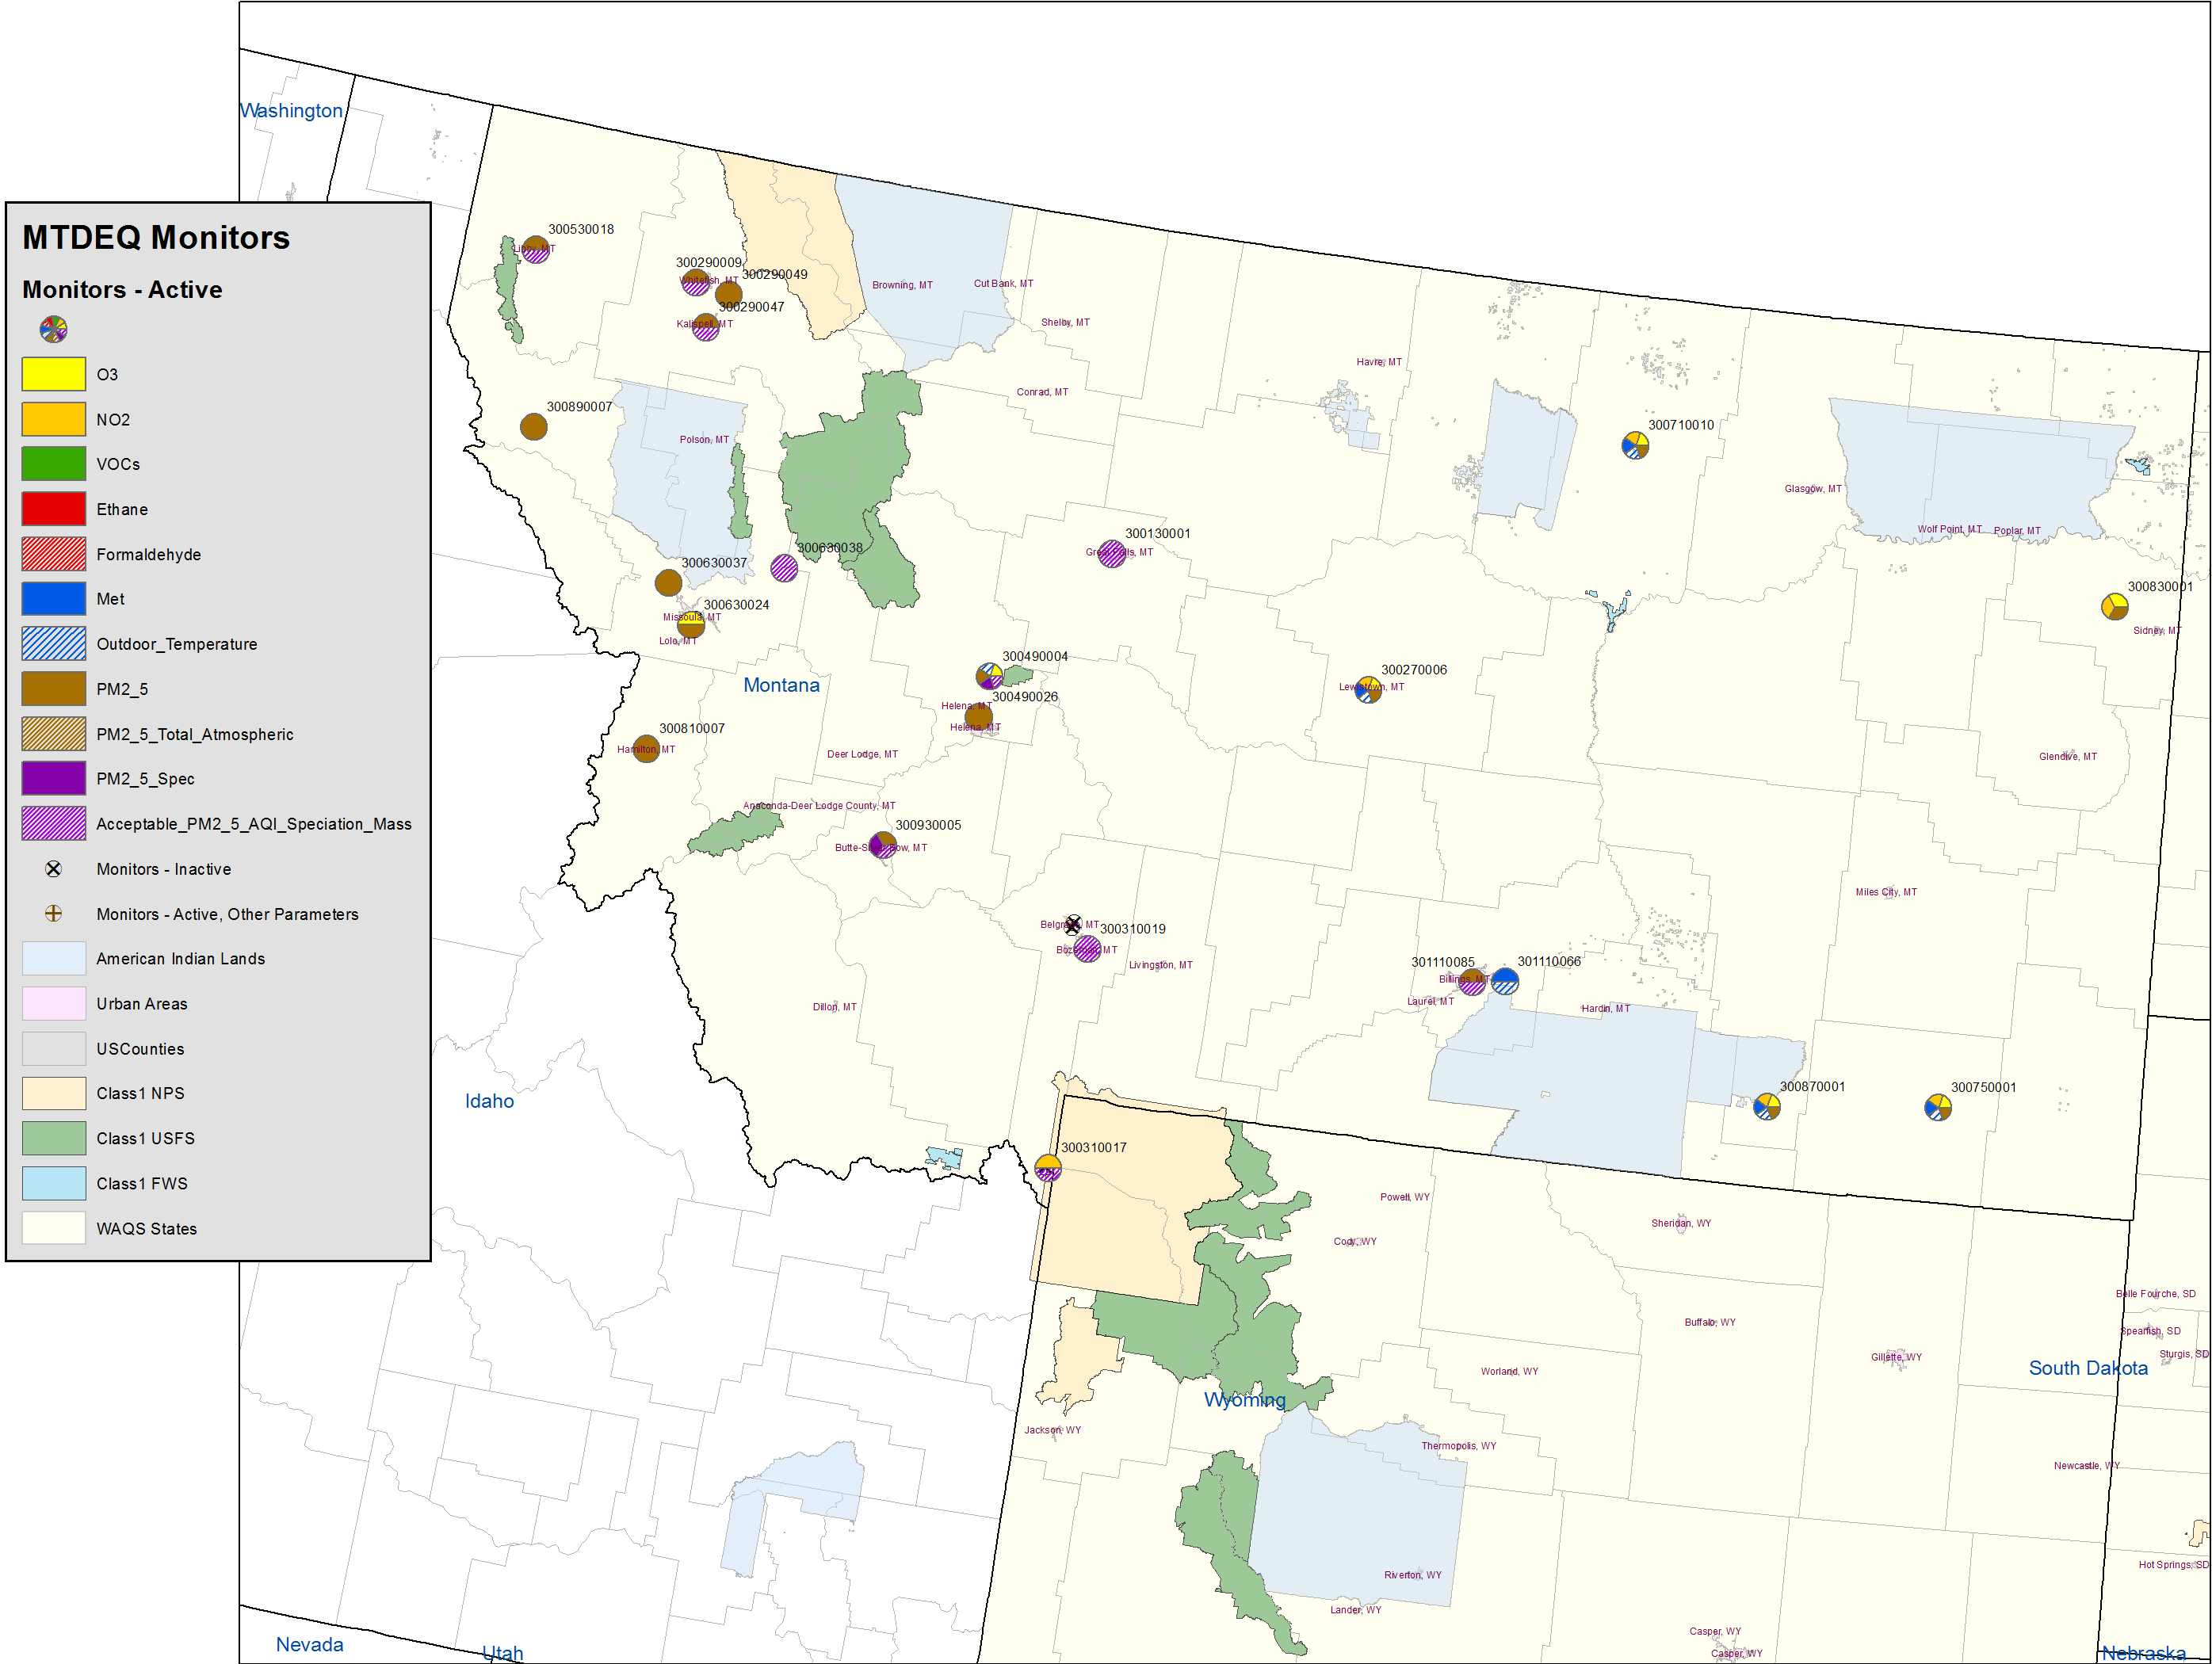
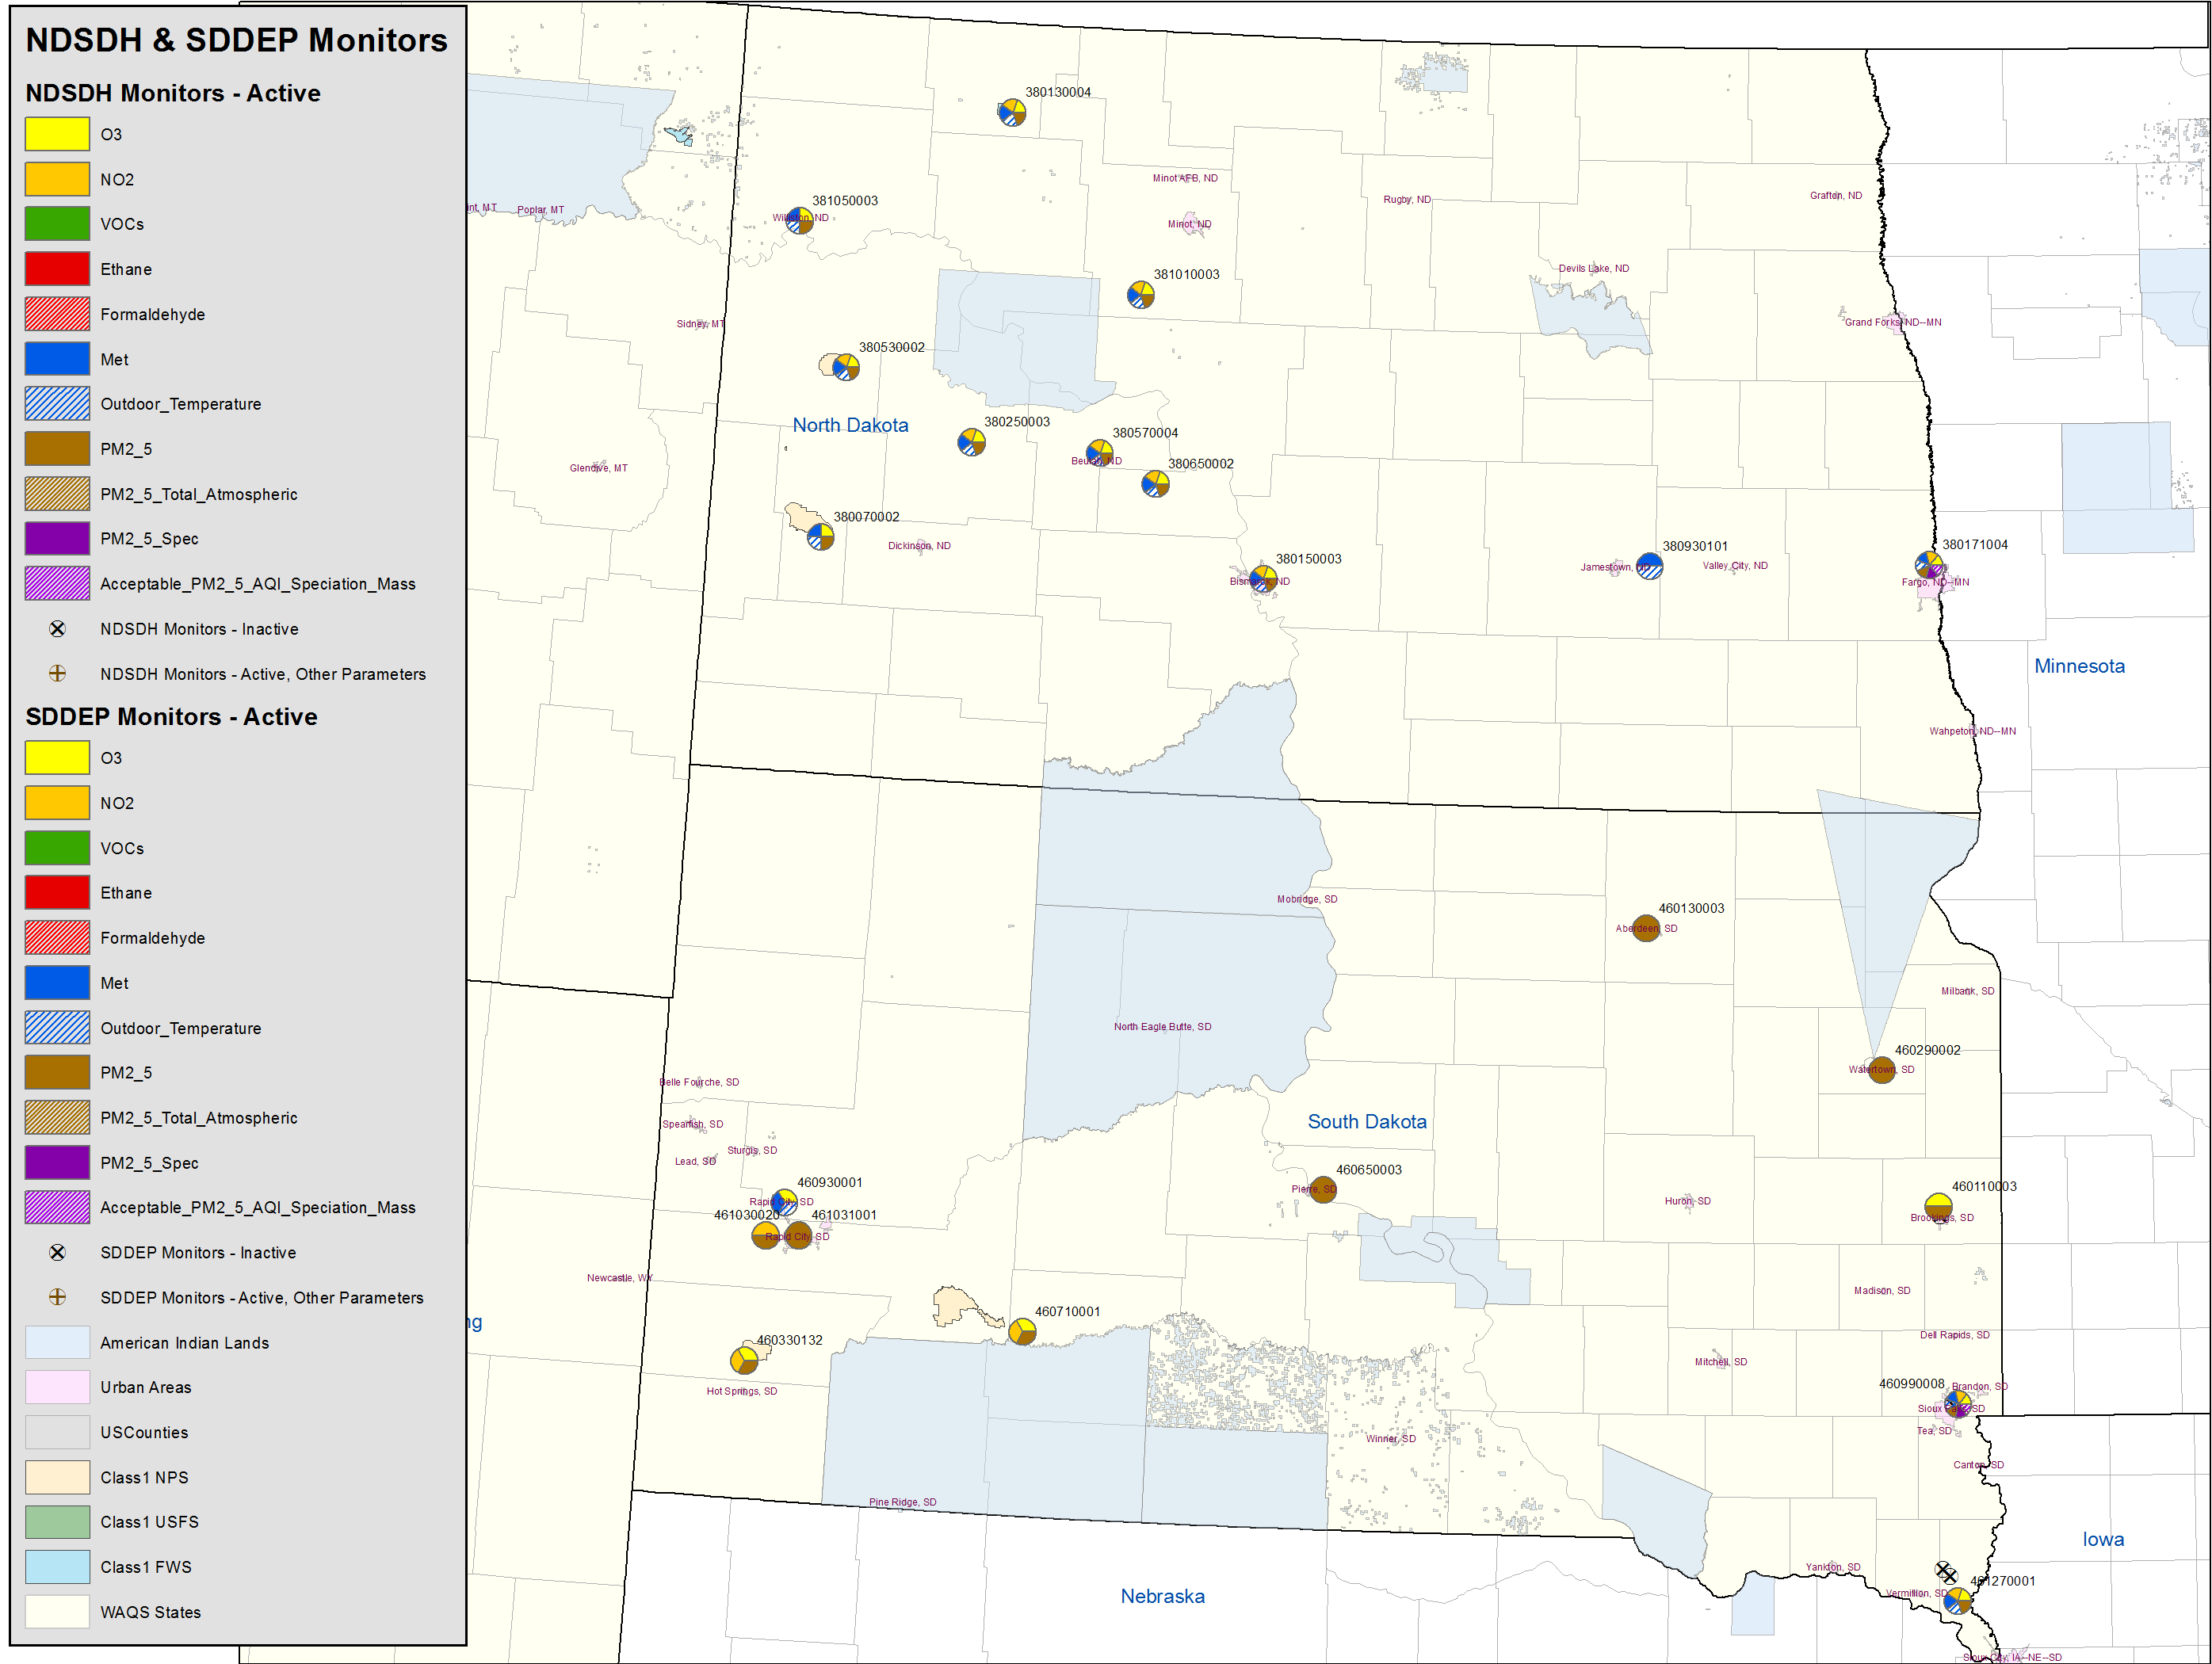
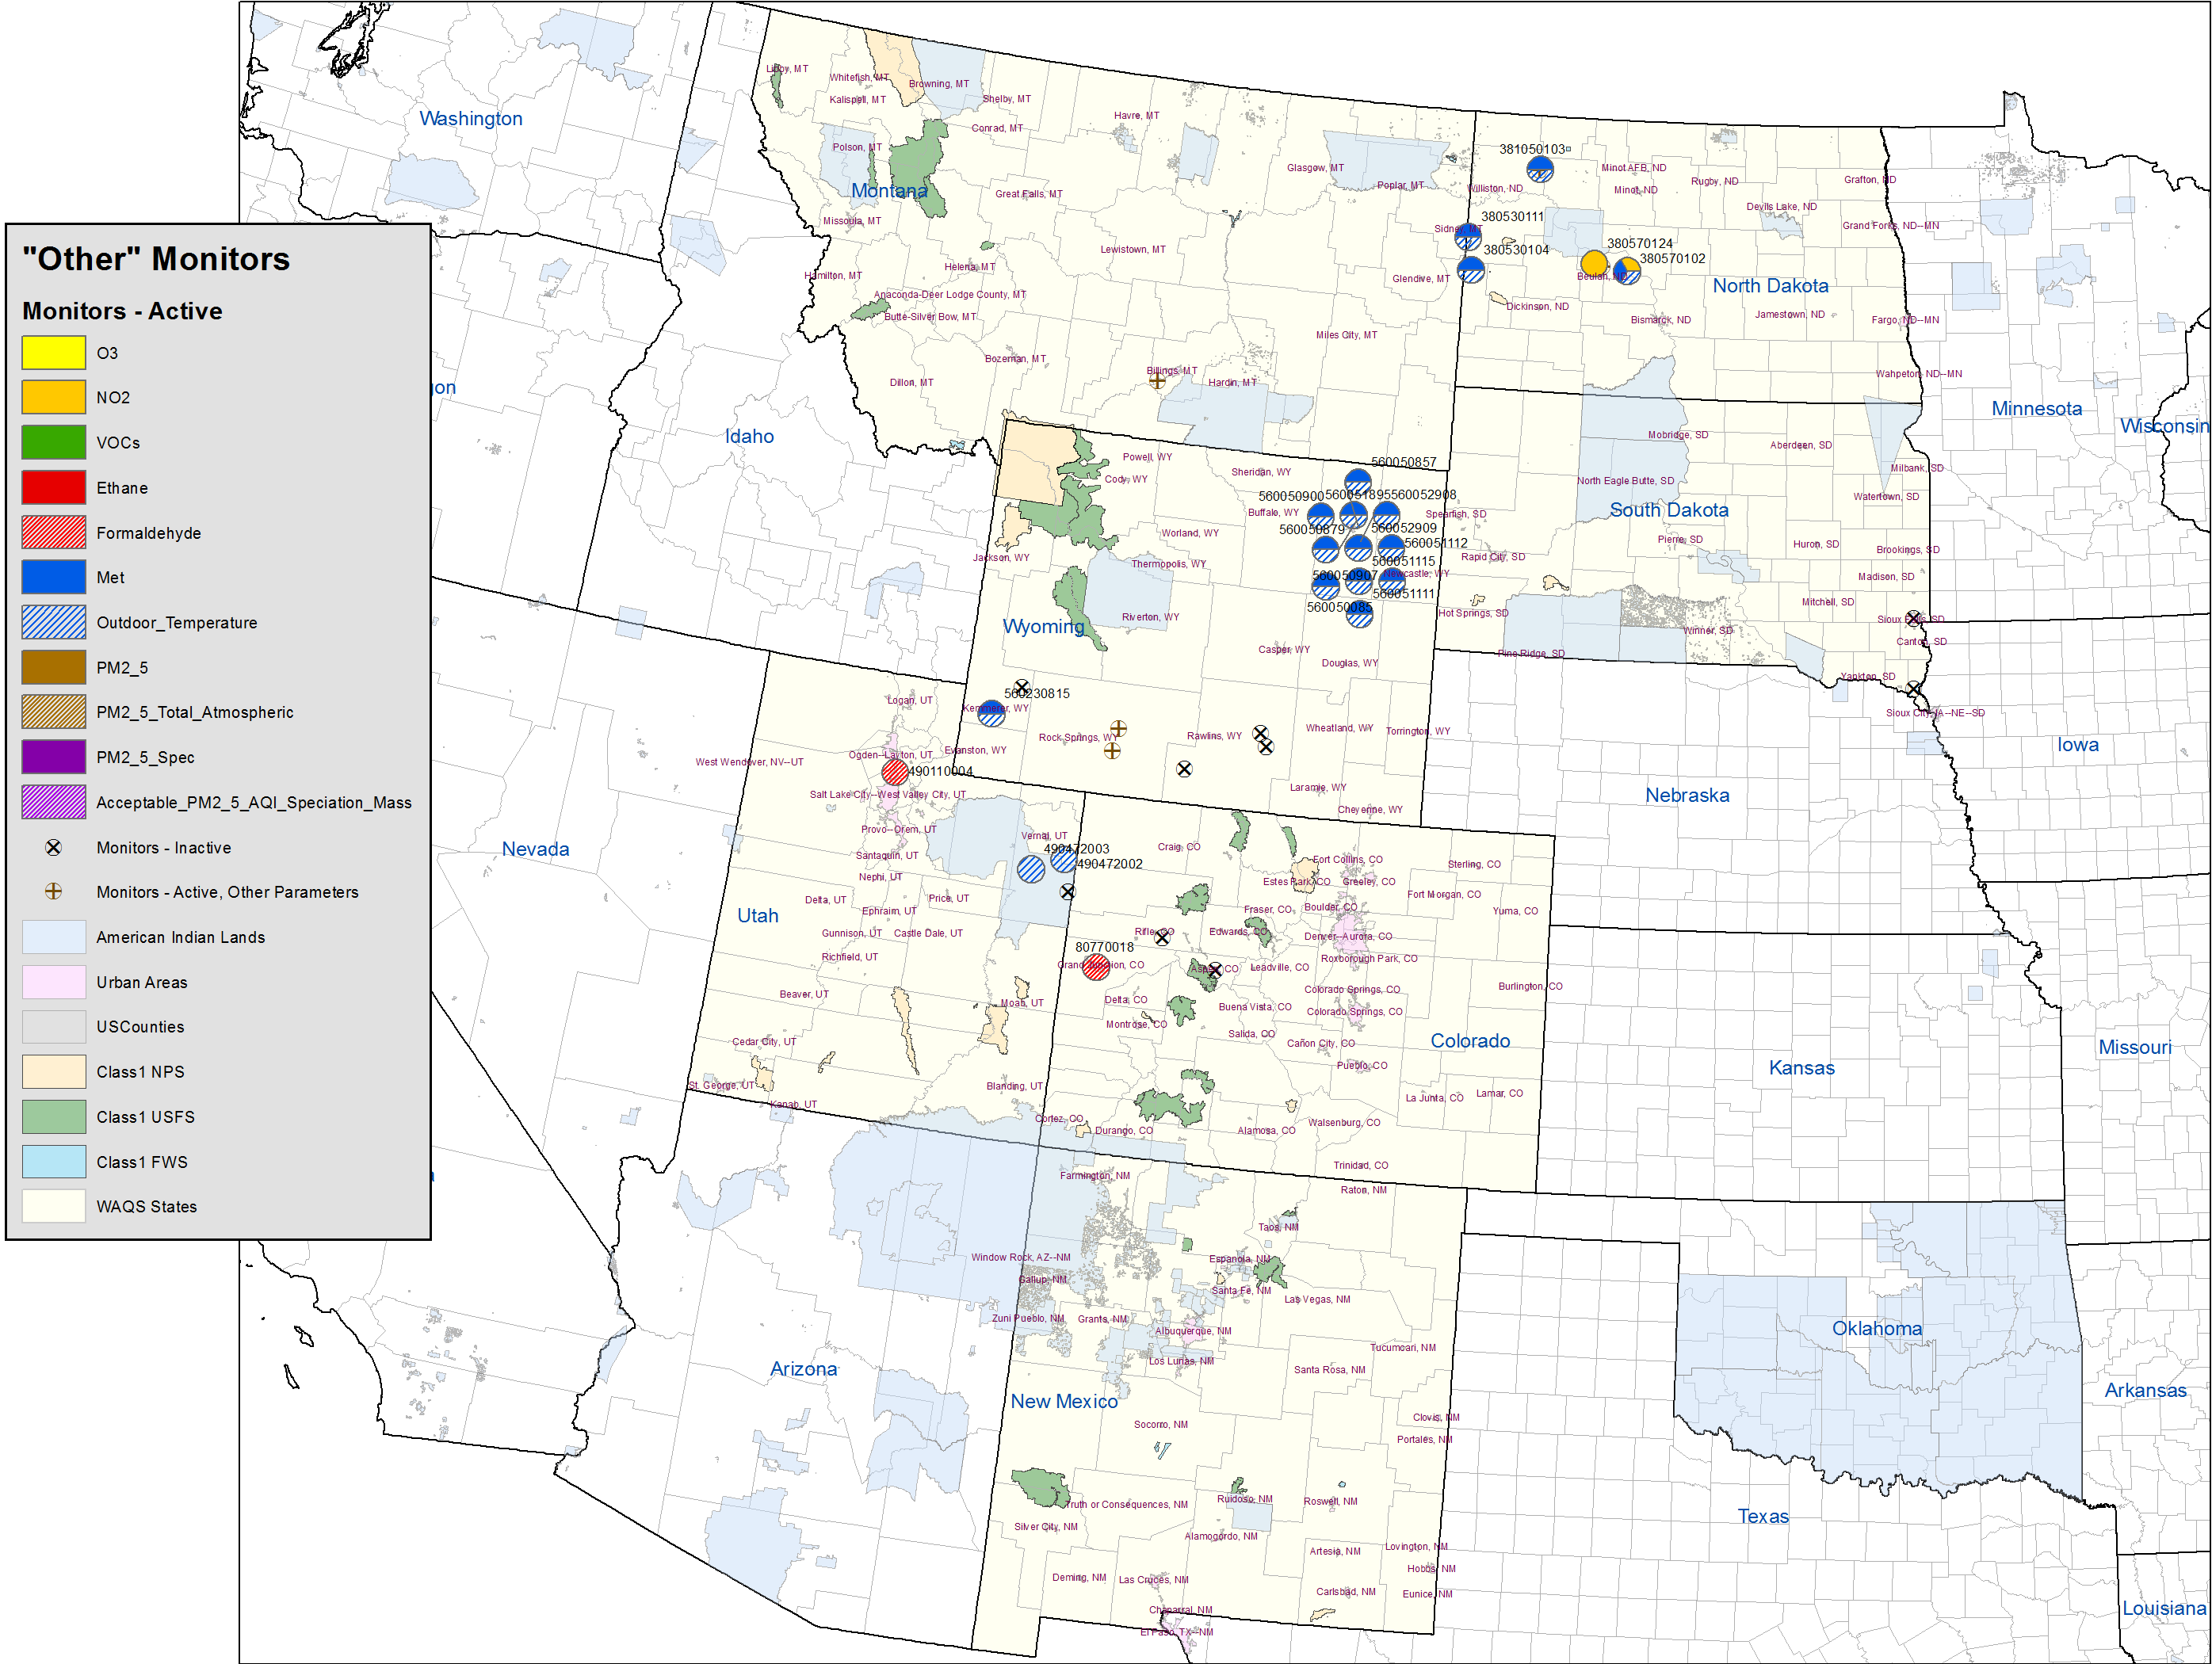
By Parameter Maps showing monitors for the parameters considered in the WAQS MNA
All monitors non-overlapping labels
All monitors overlapping labels
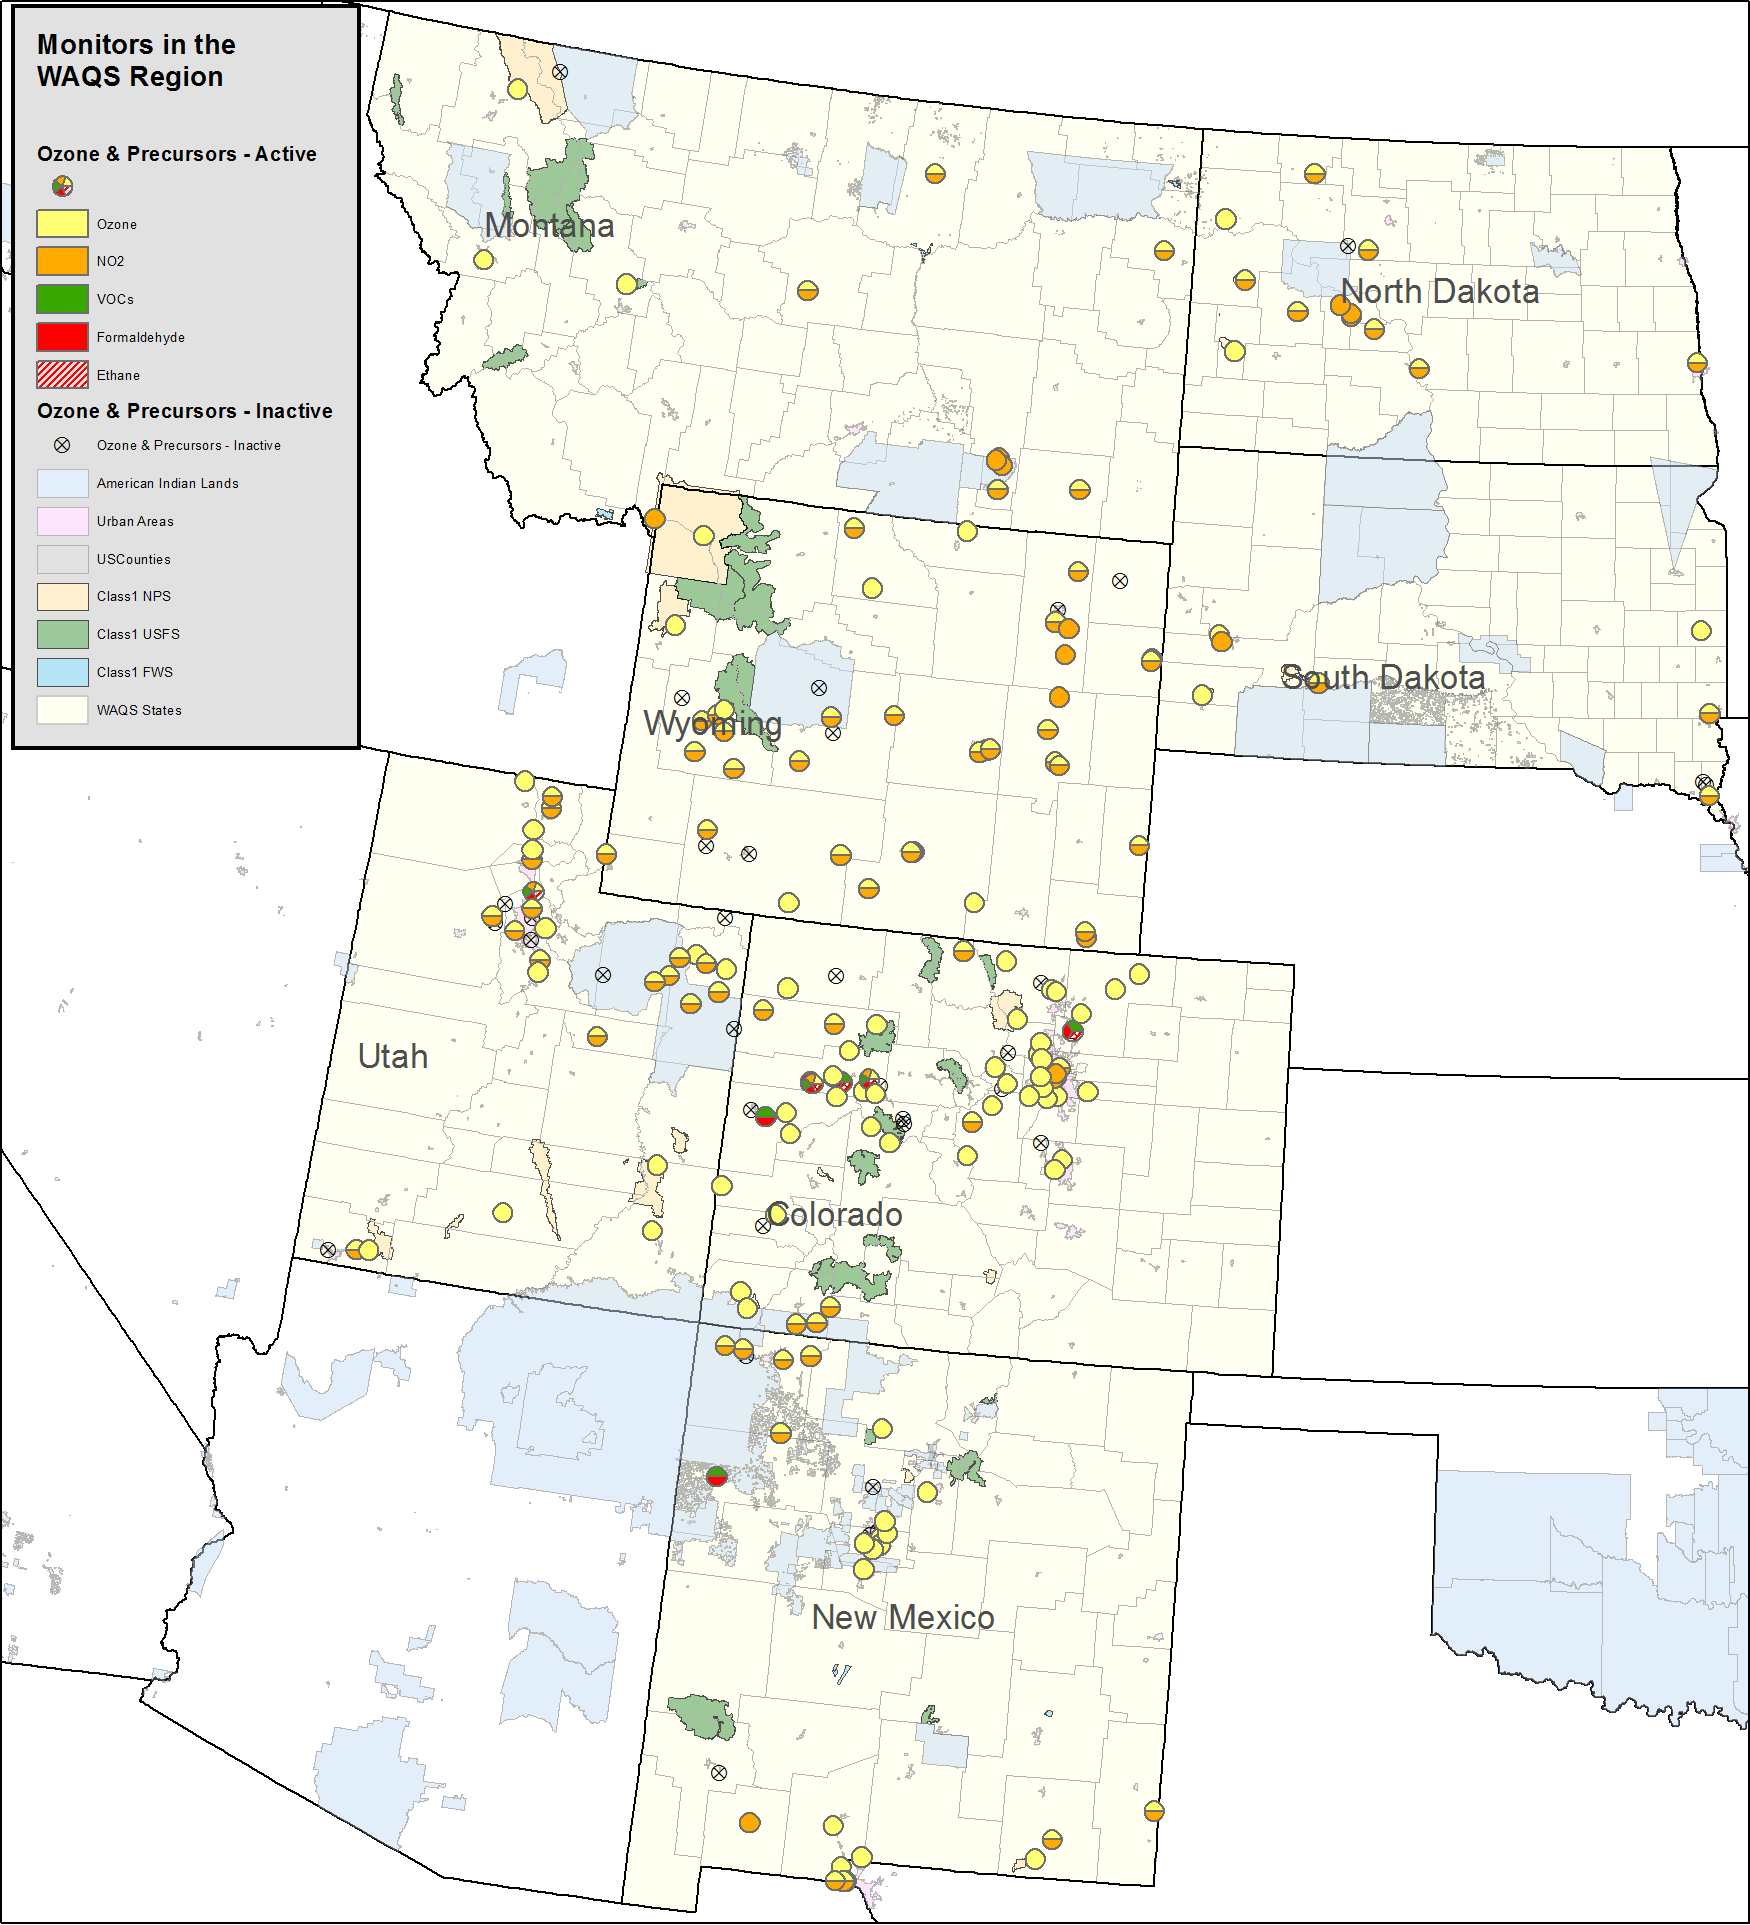
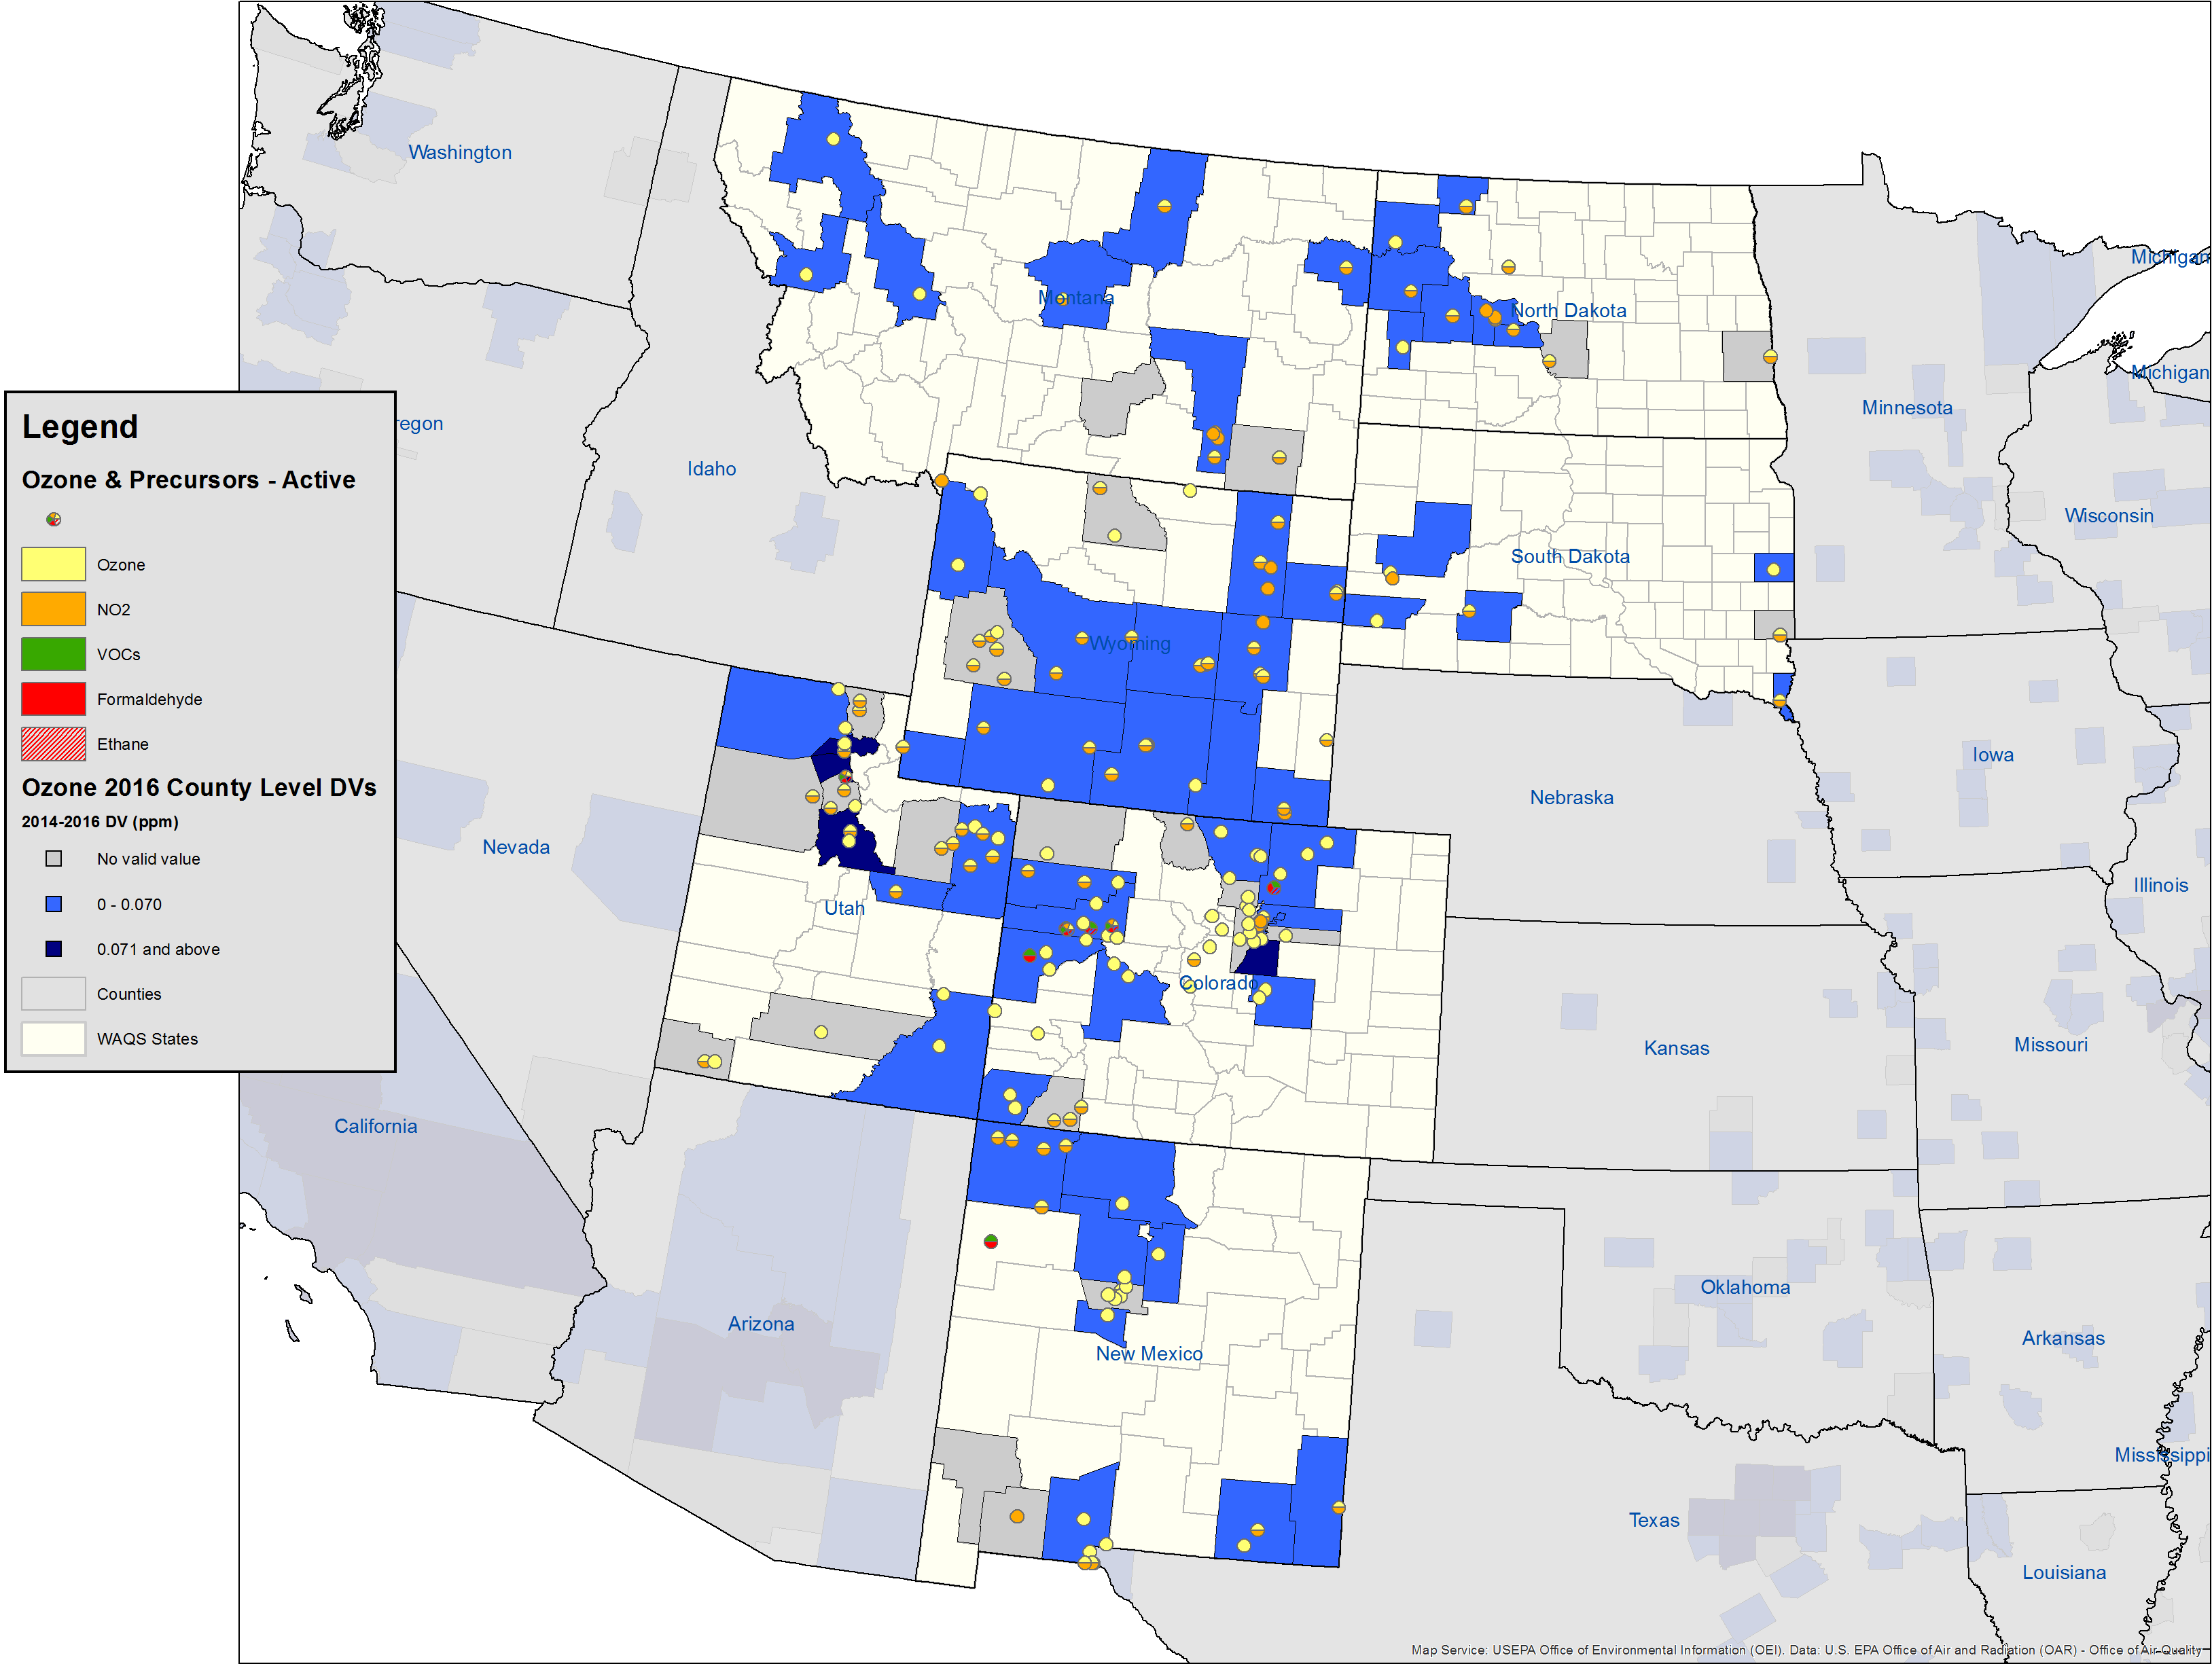
O3 and Precursors O3, NO2, VOCs (with(highlighting monitors reportingthat report ethane and formaldehyde)
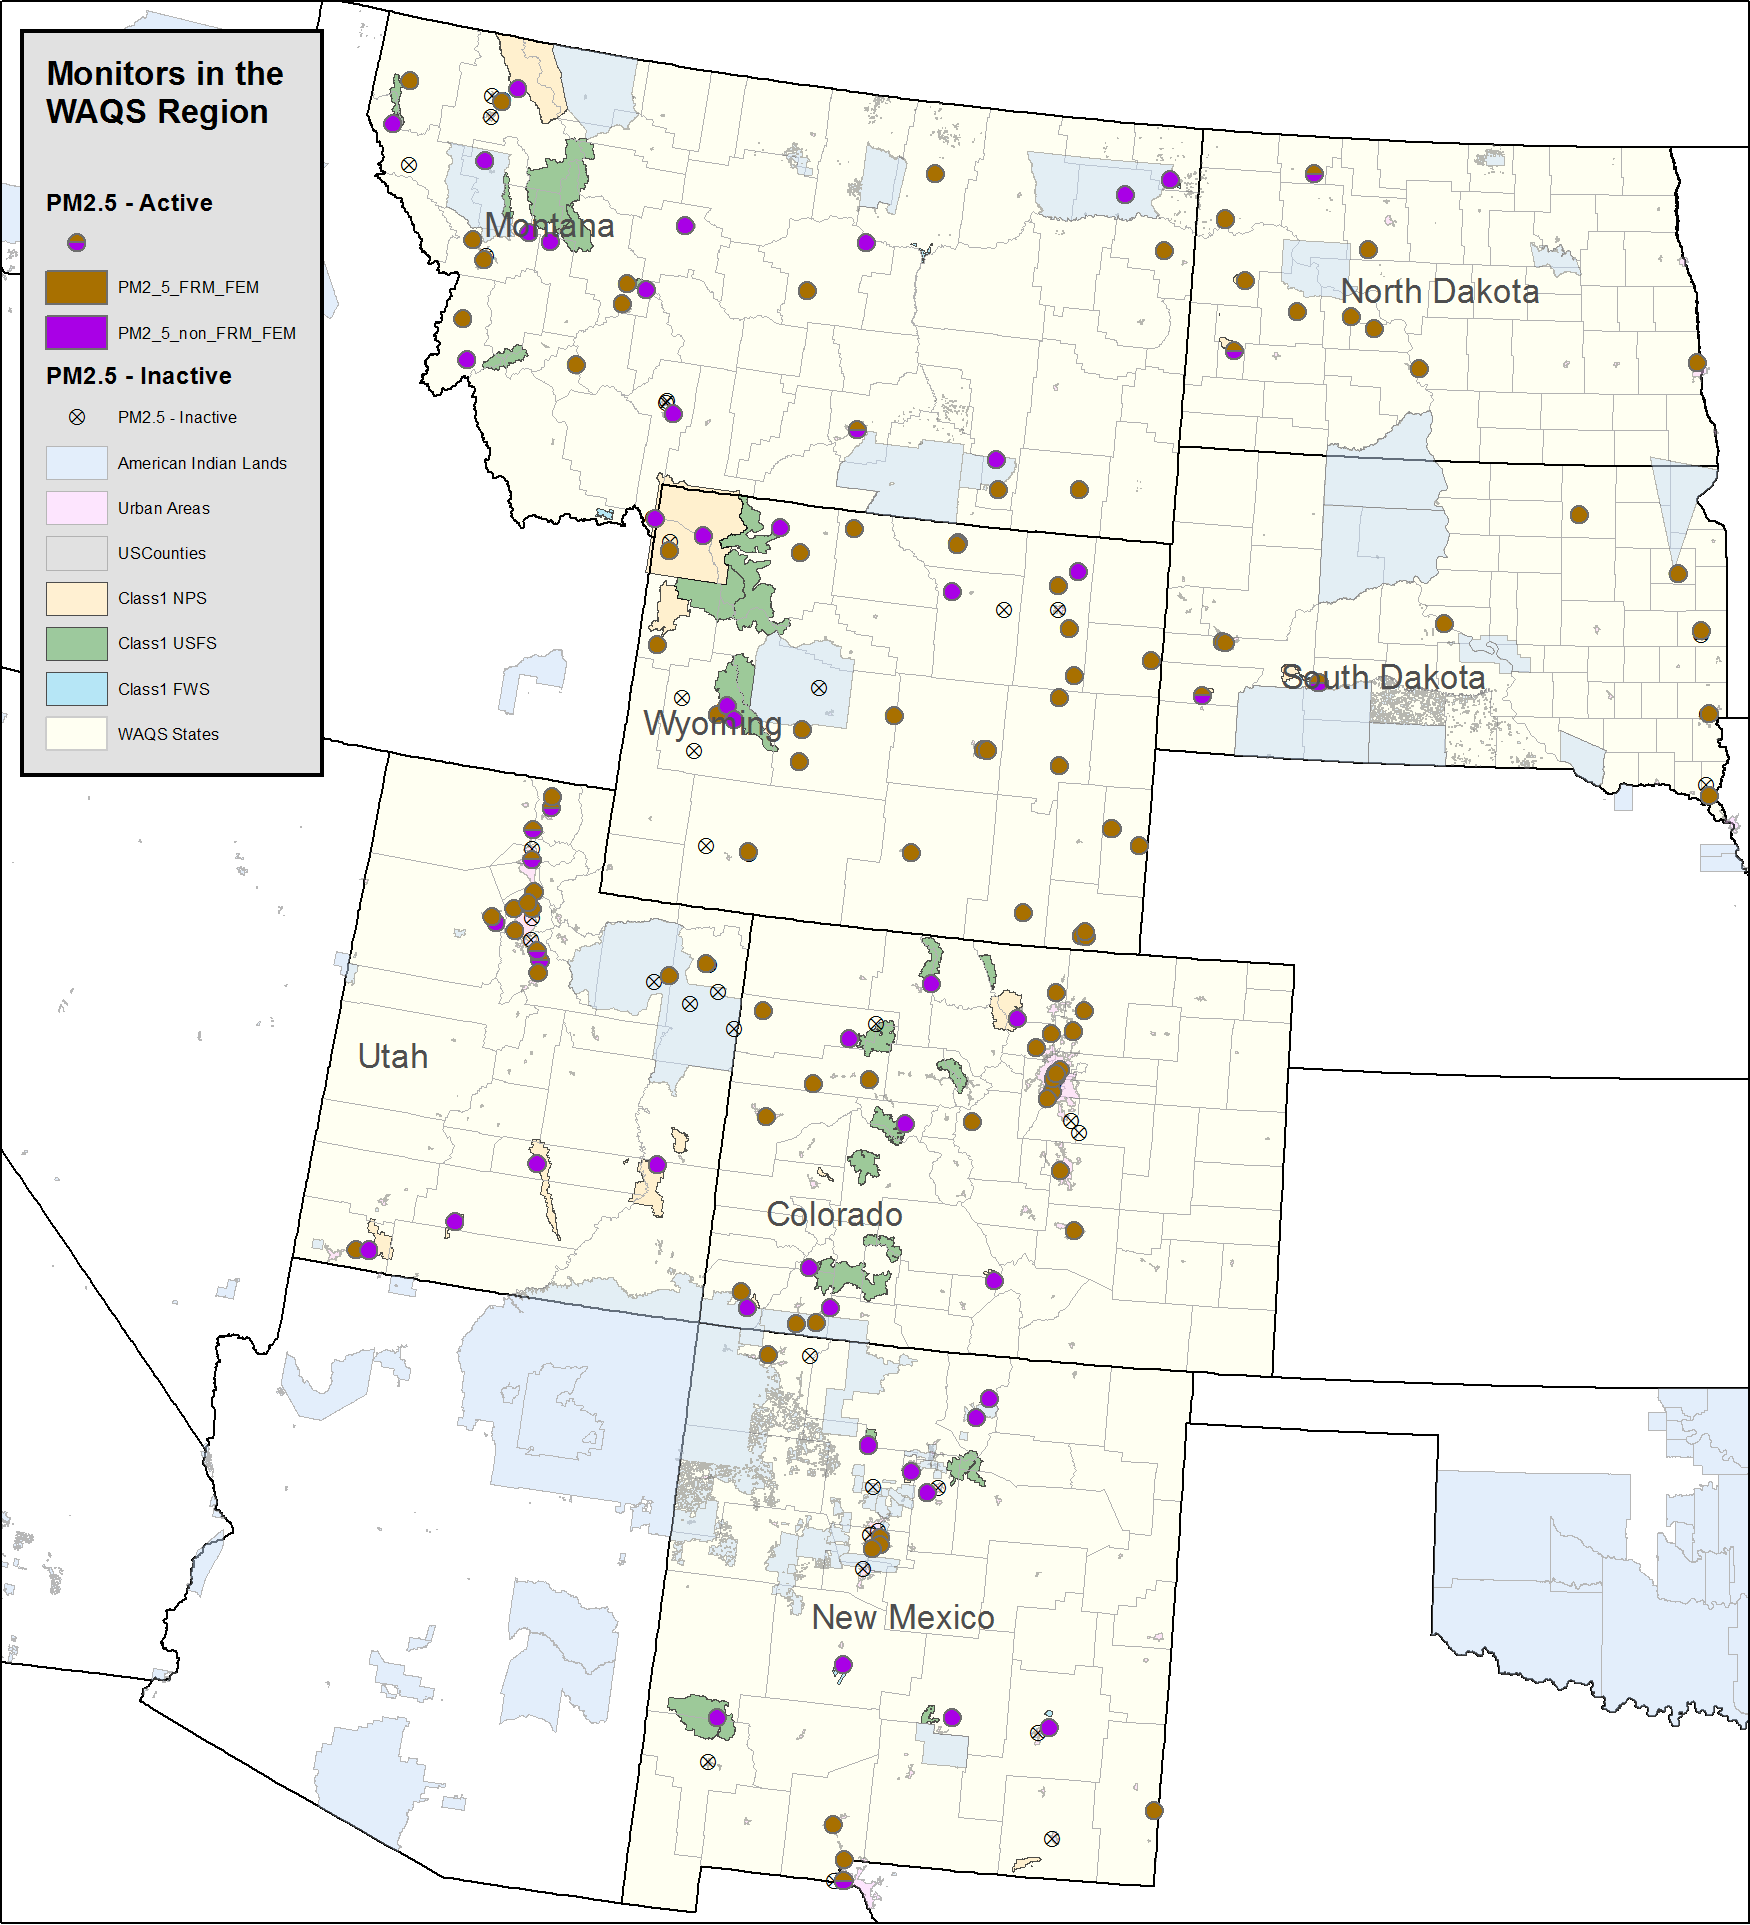
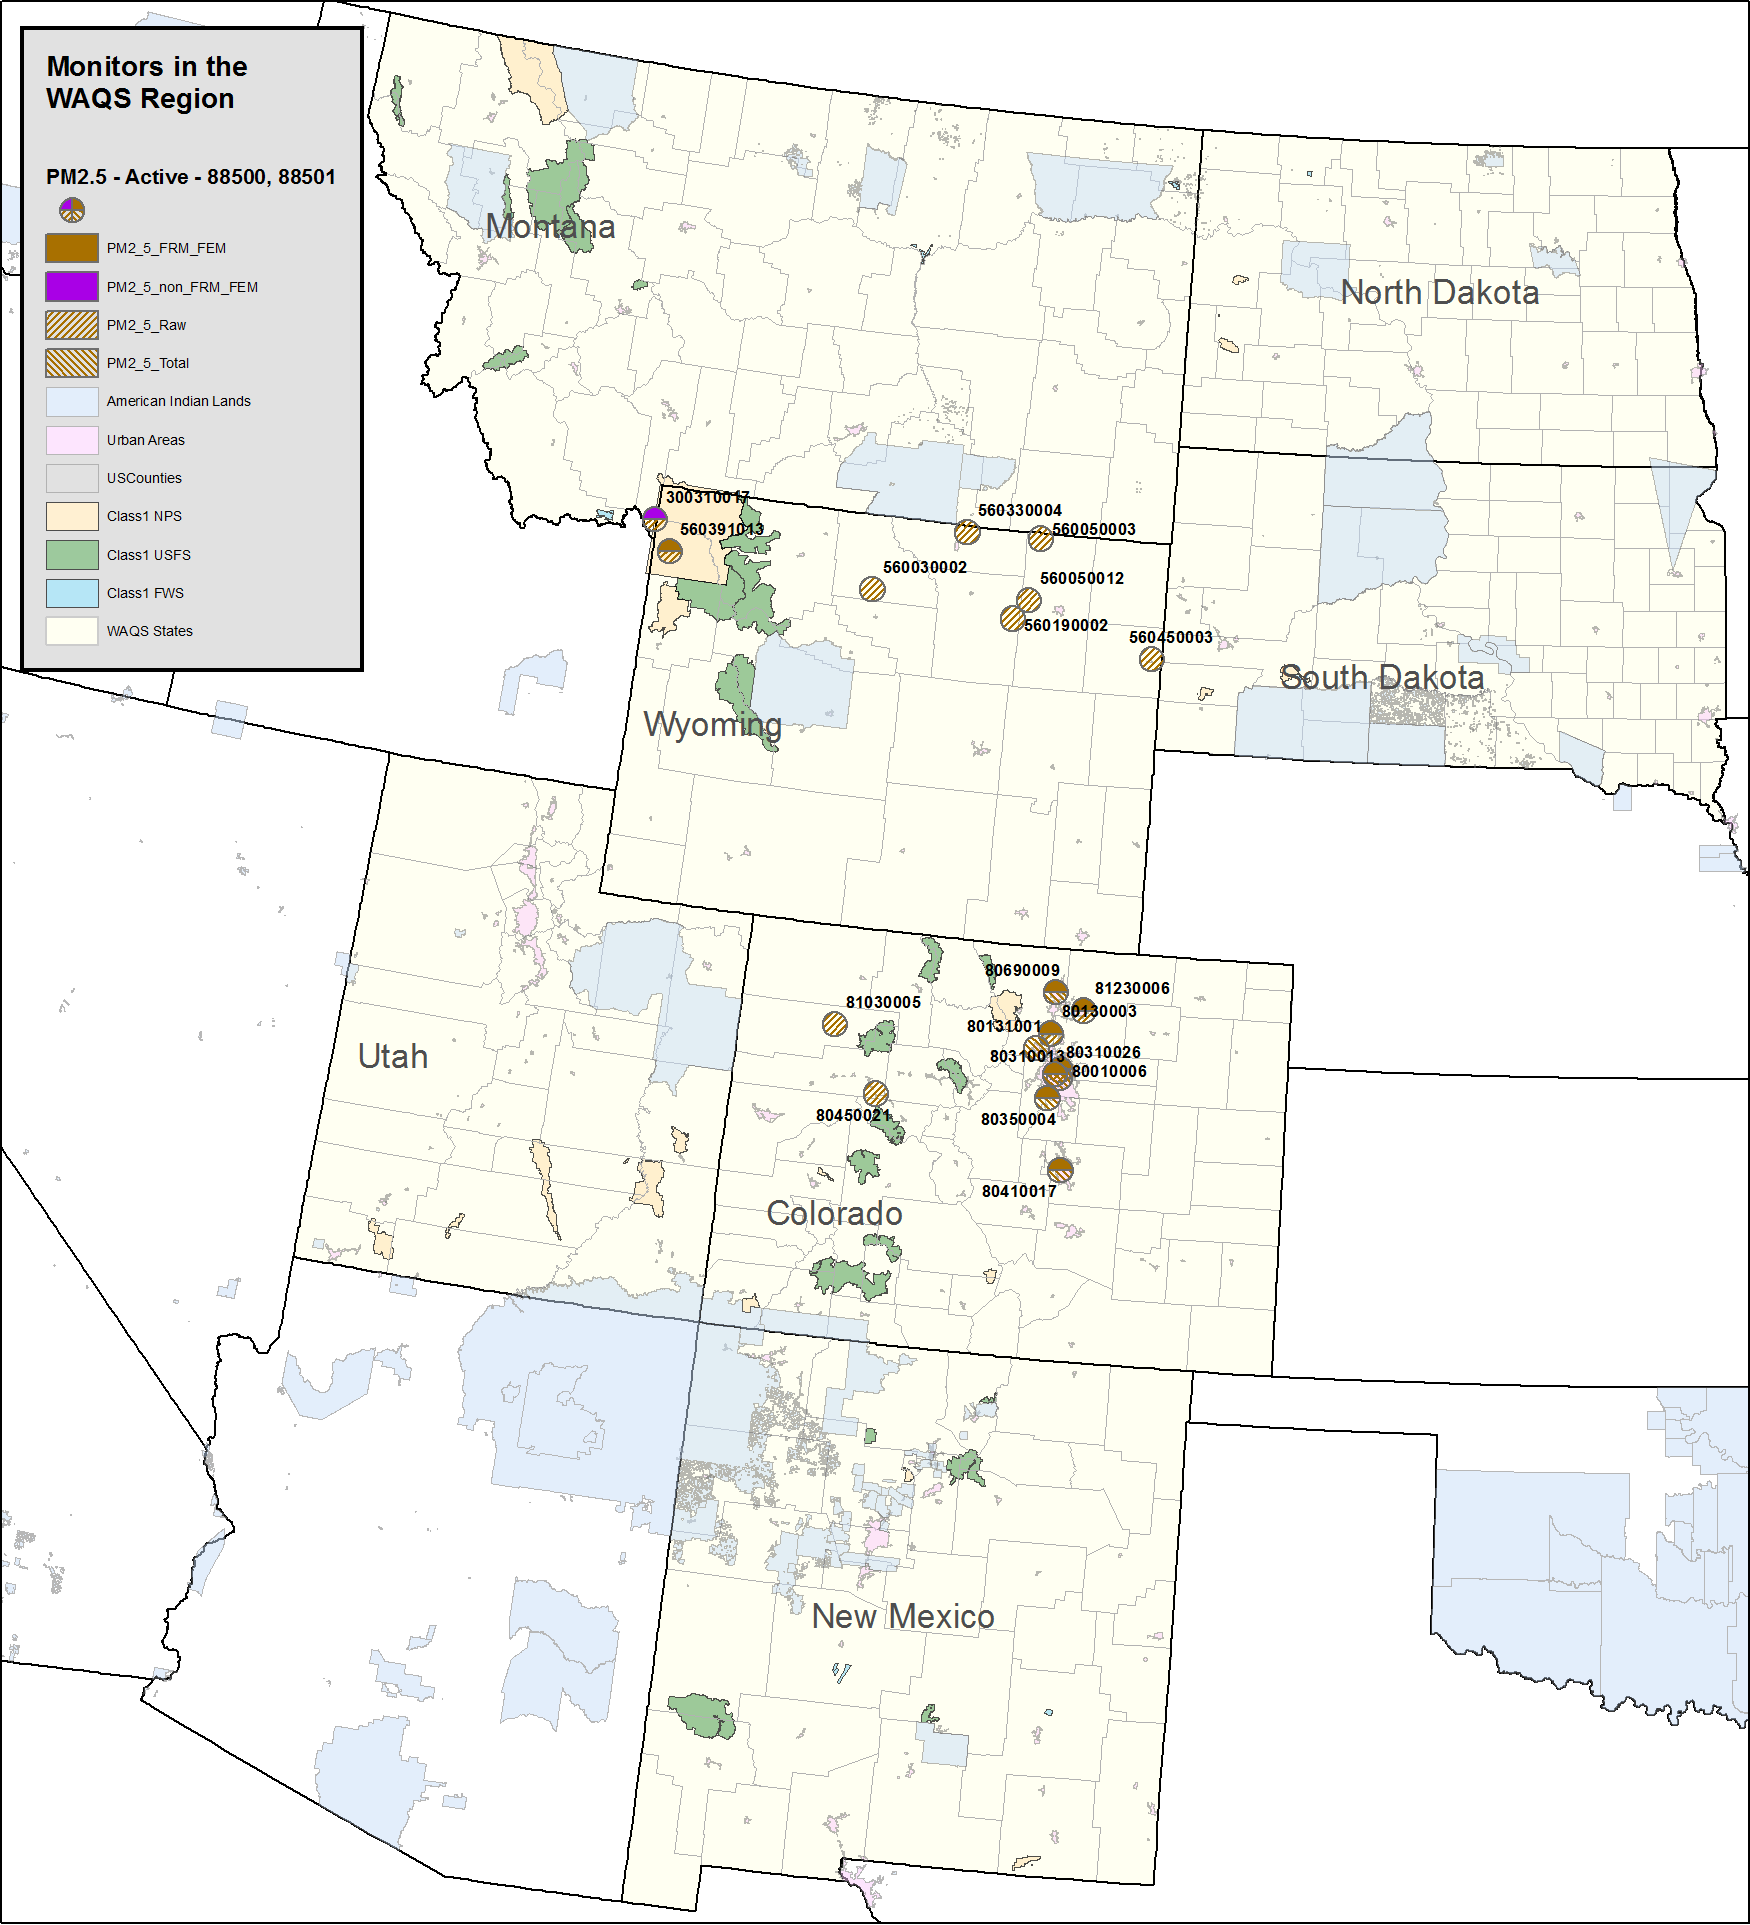
PM2.5 inclues FRM/FEM and non-FRM/FEM PM2.5 monitors
PM2.5 with supplemental monitoring PM2.5 monitors that includealso measure PM2.5 Raw and PM2.5 Total
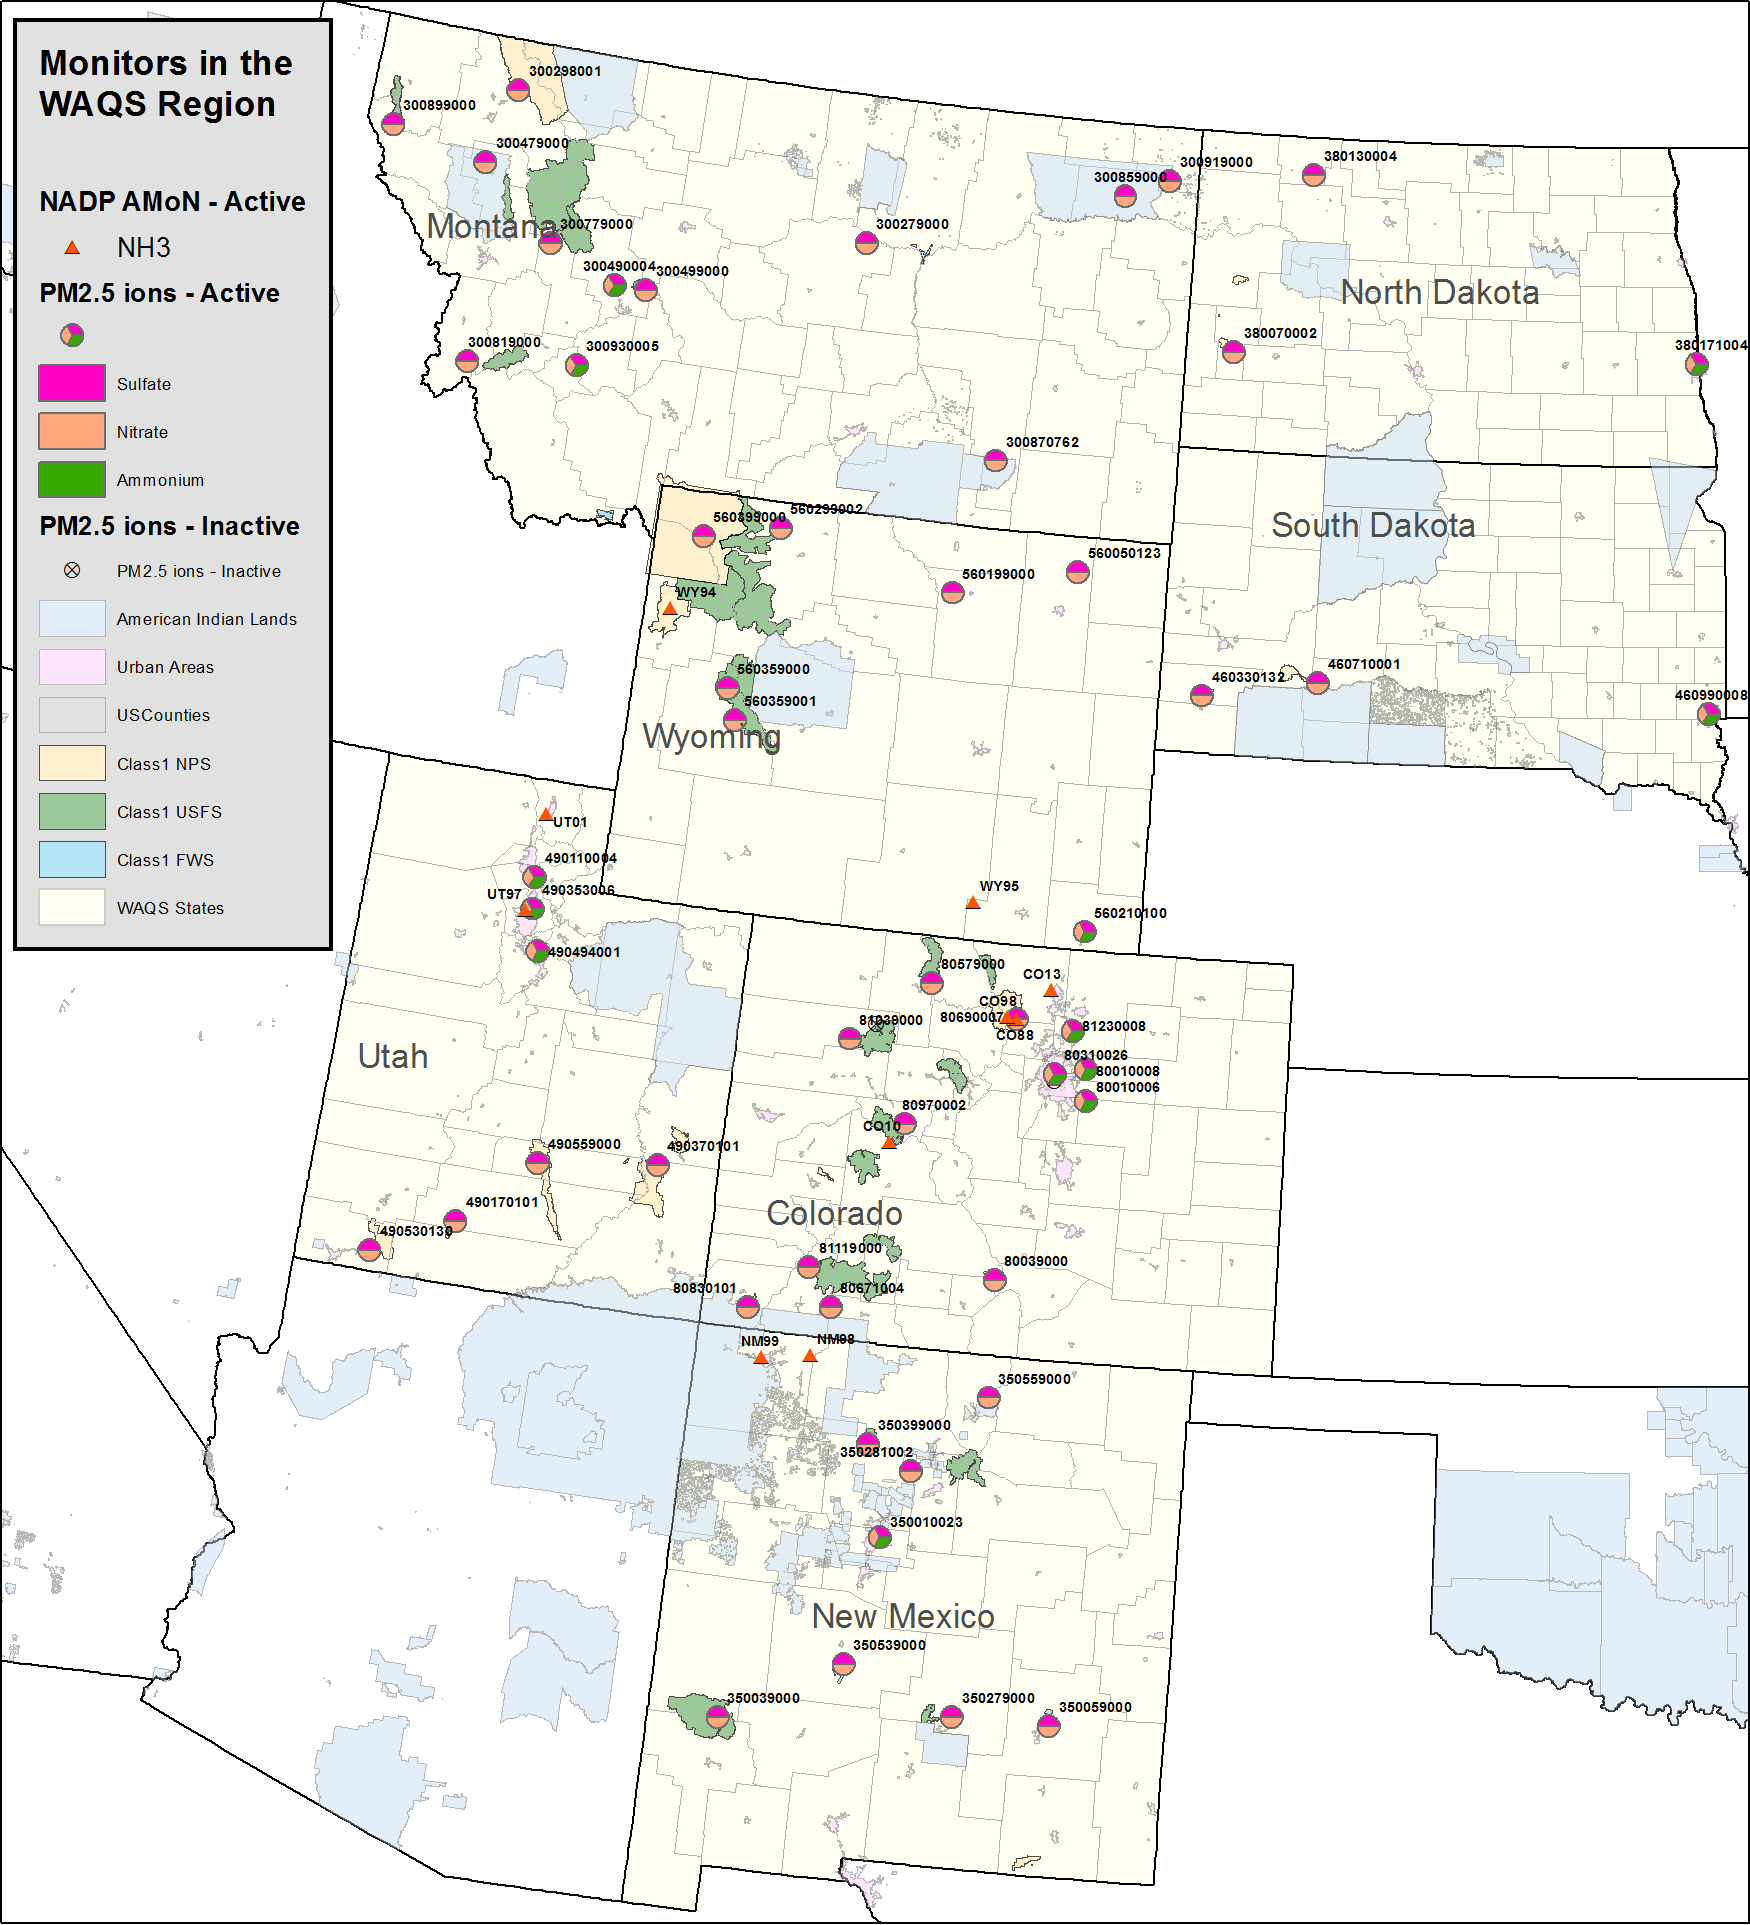
Ions and Ammonia PM2.5 Sulfate and Nitrate ion, and AMoMNH3 NH3from AMoN
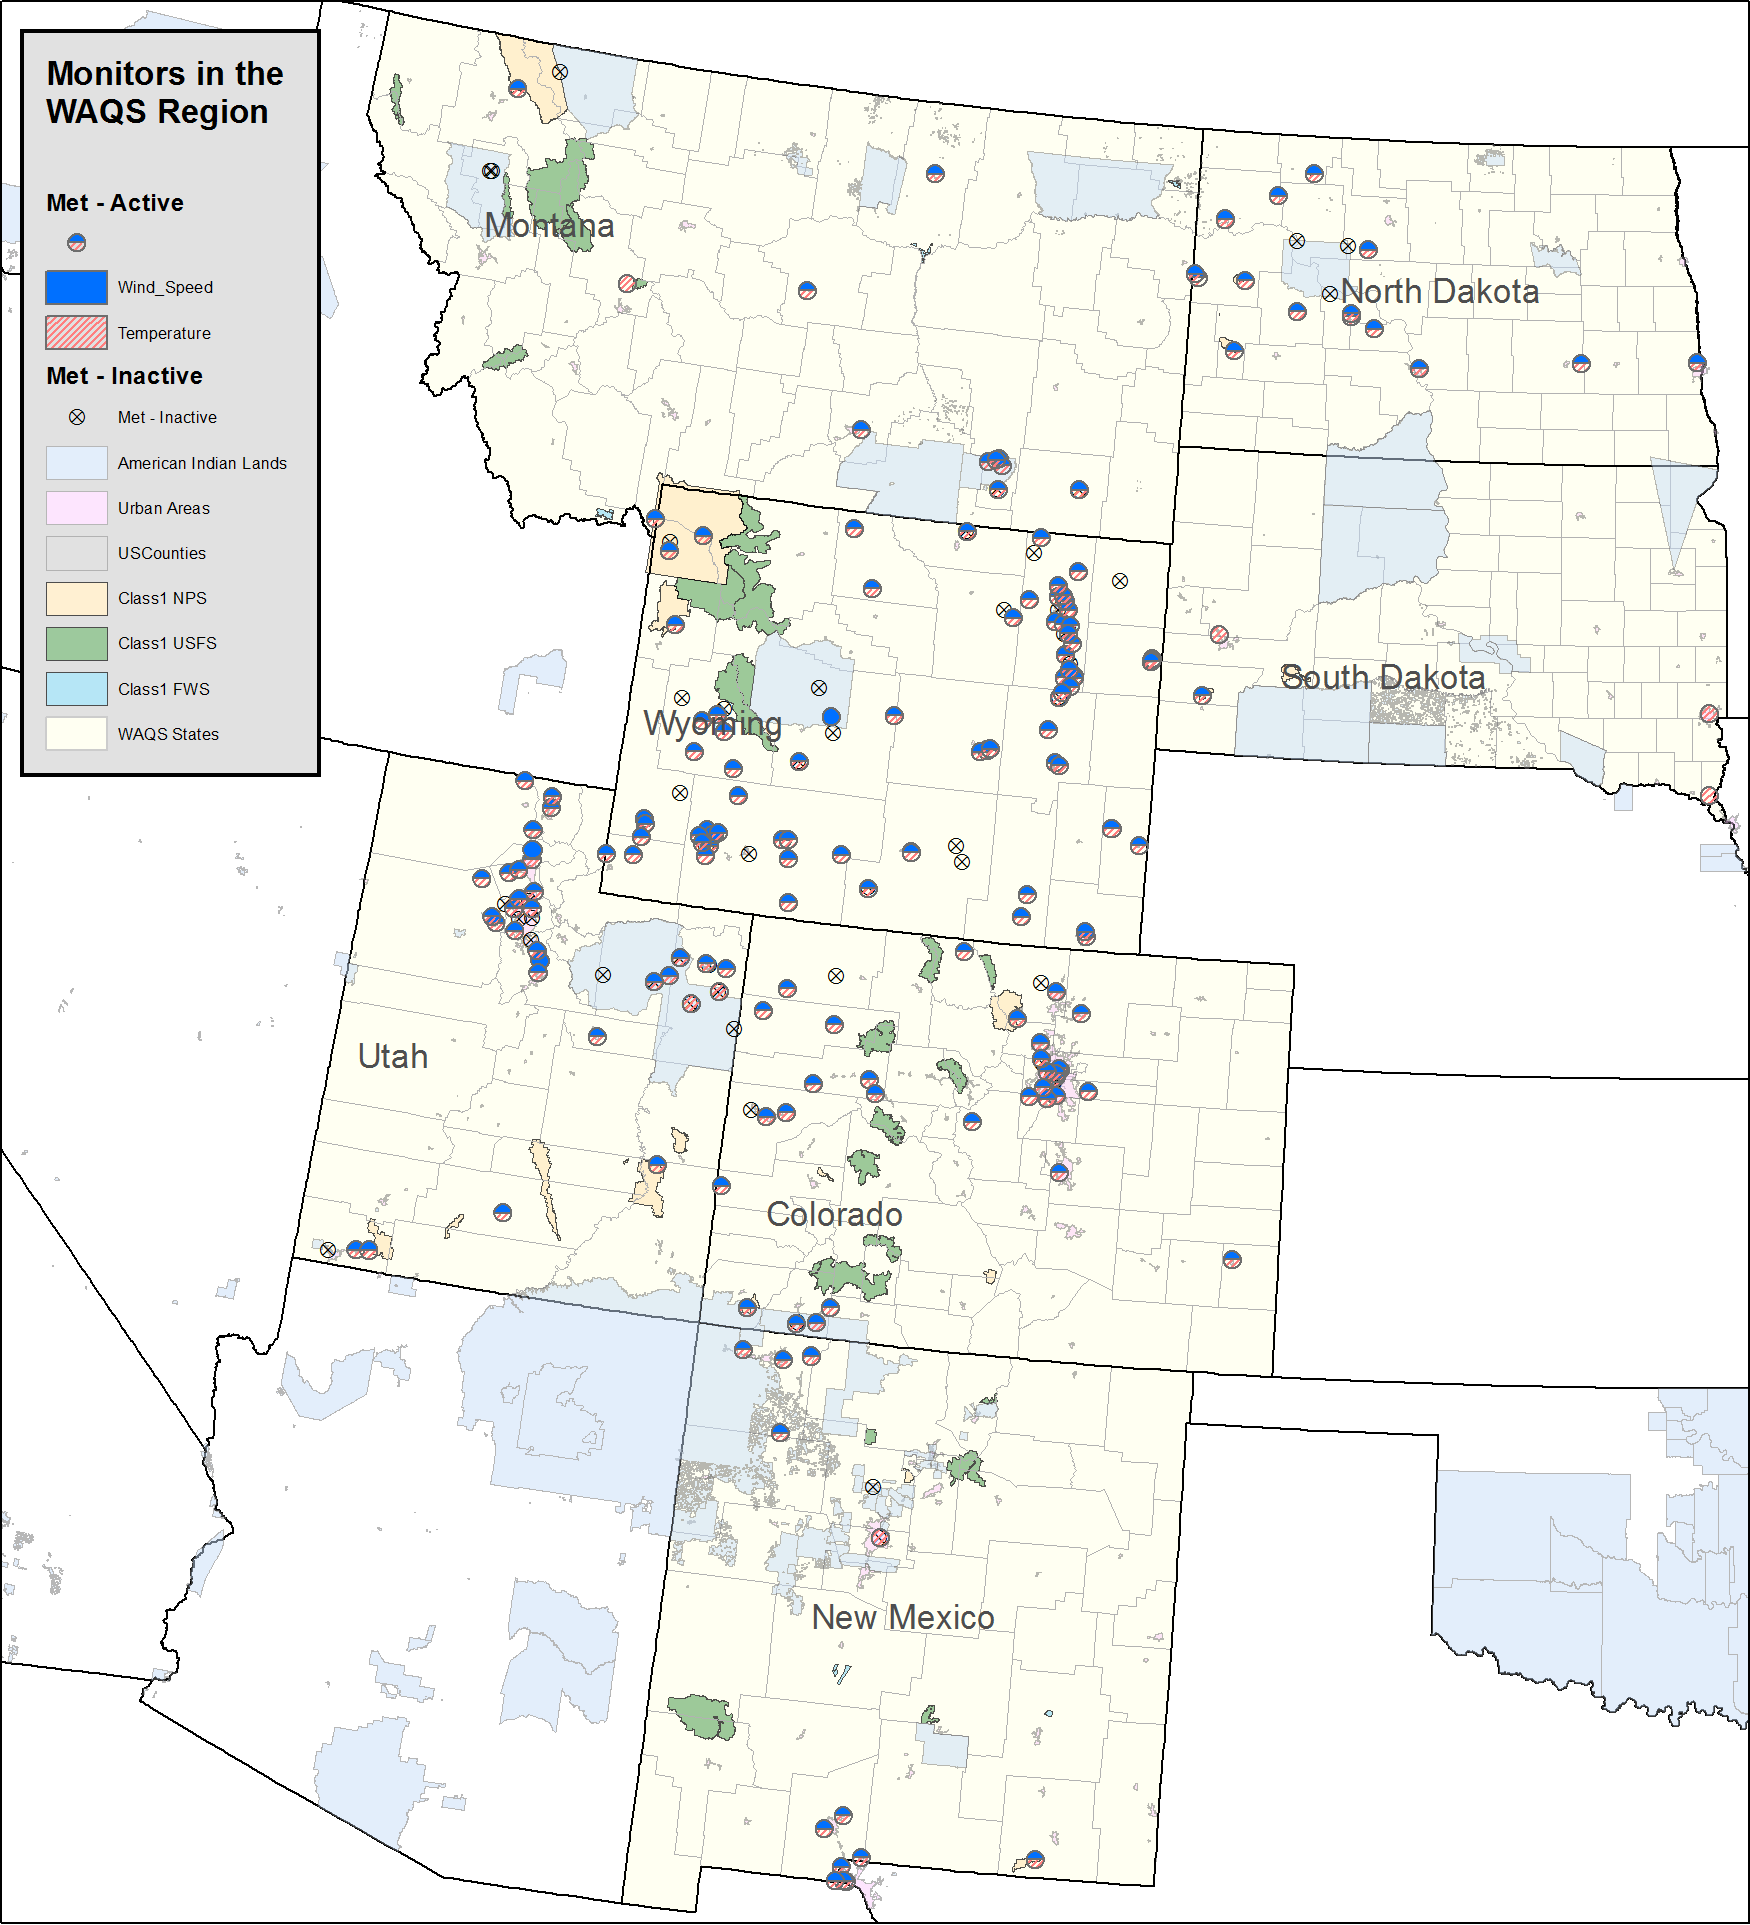
Meteorology Wind speed and Temperature
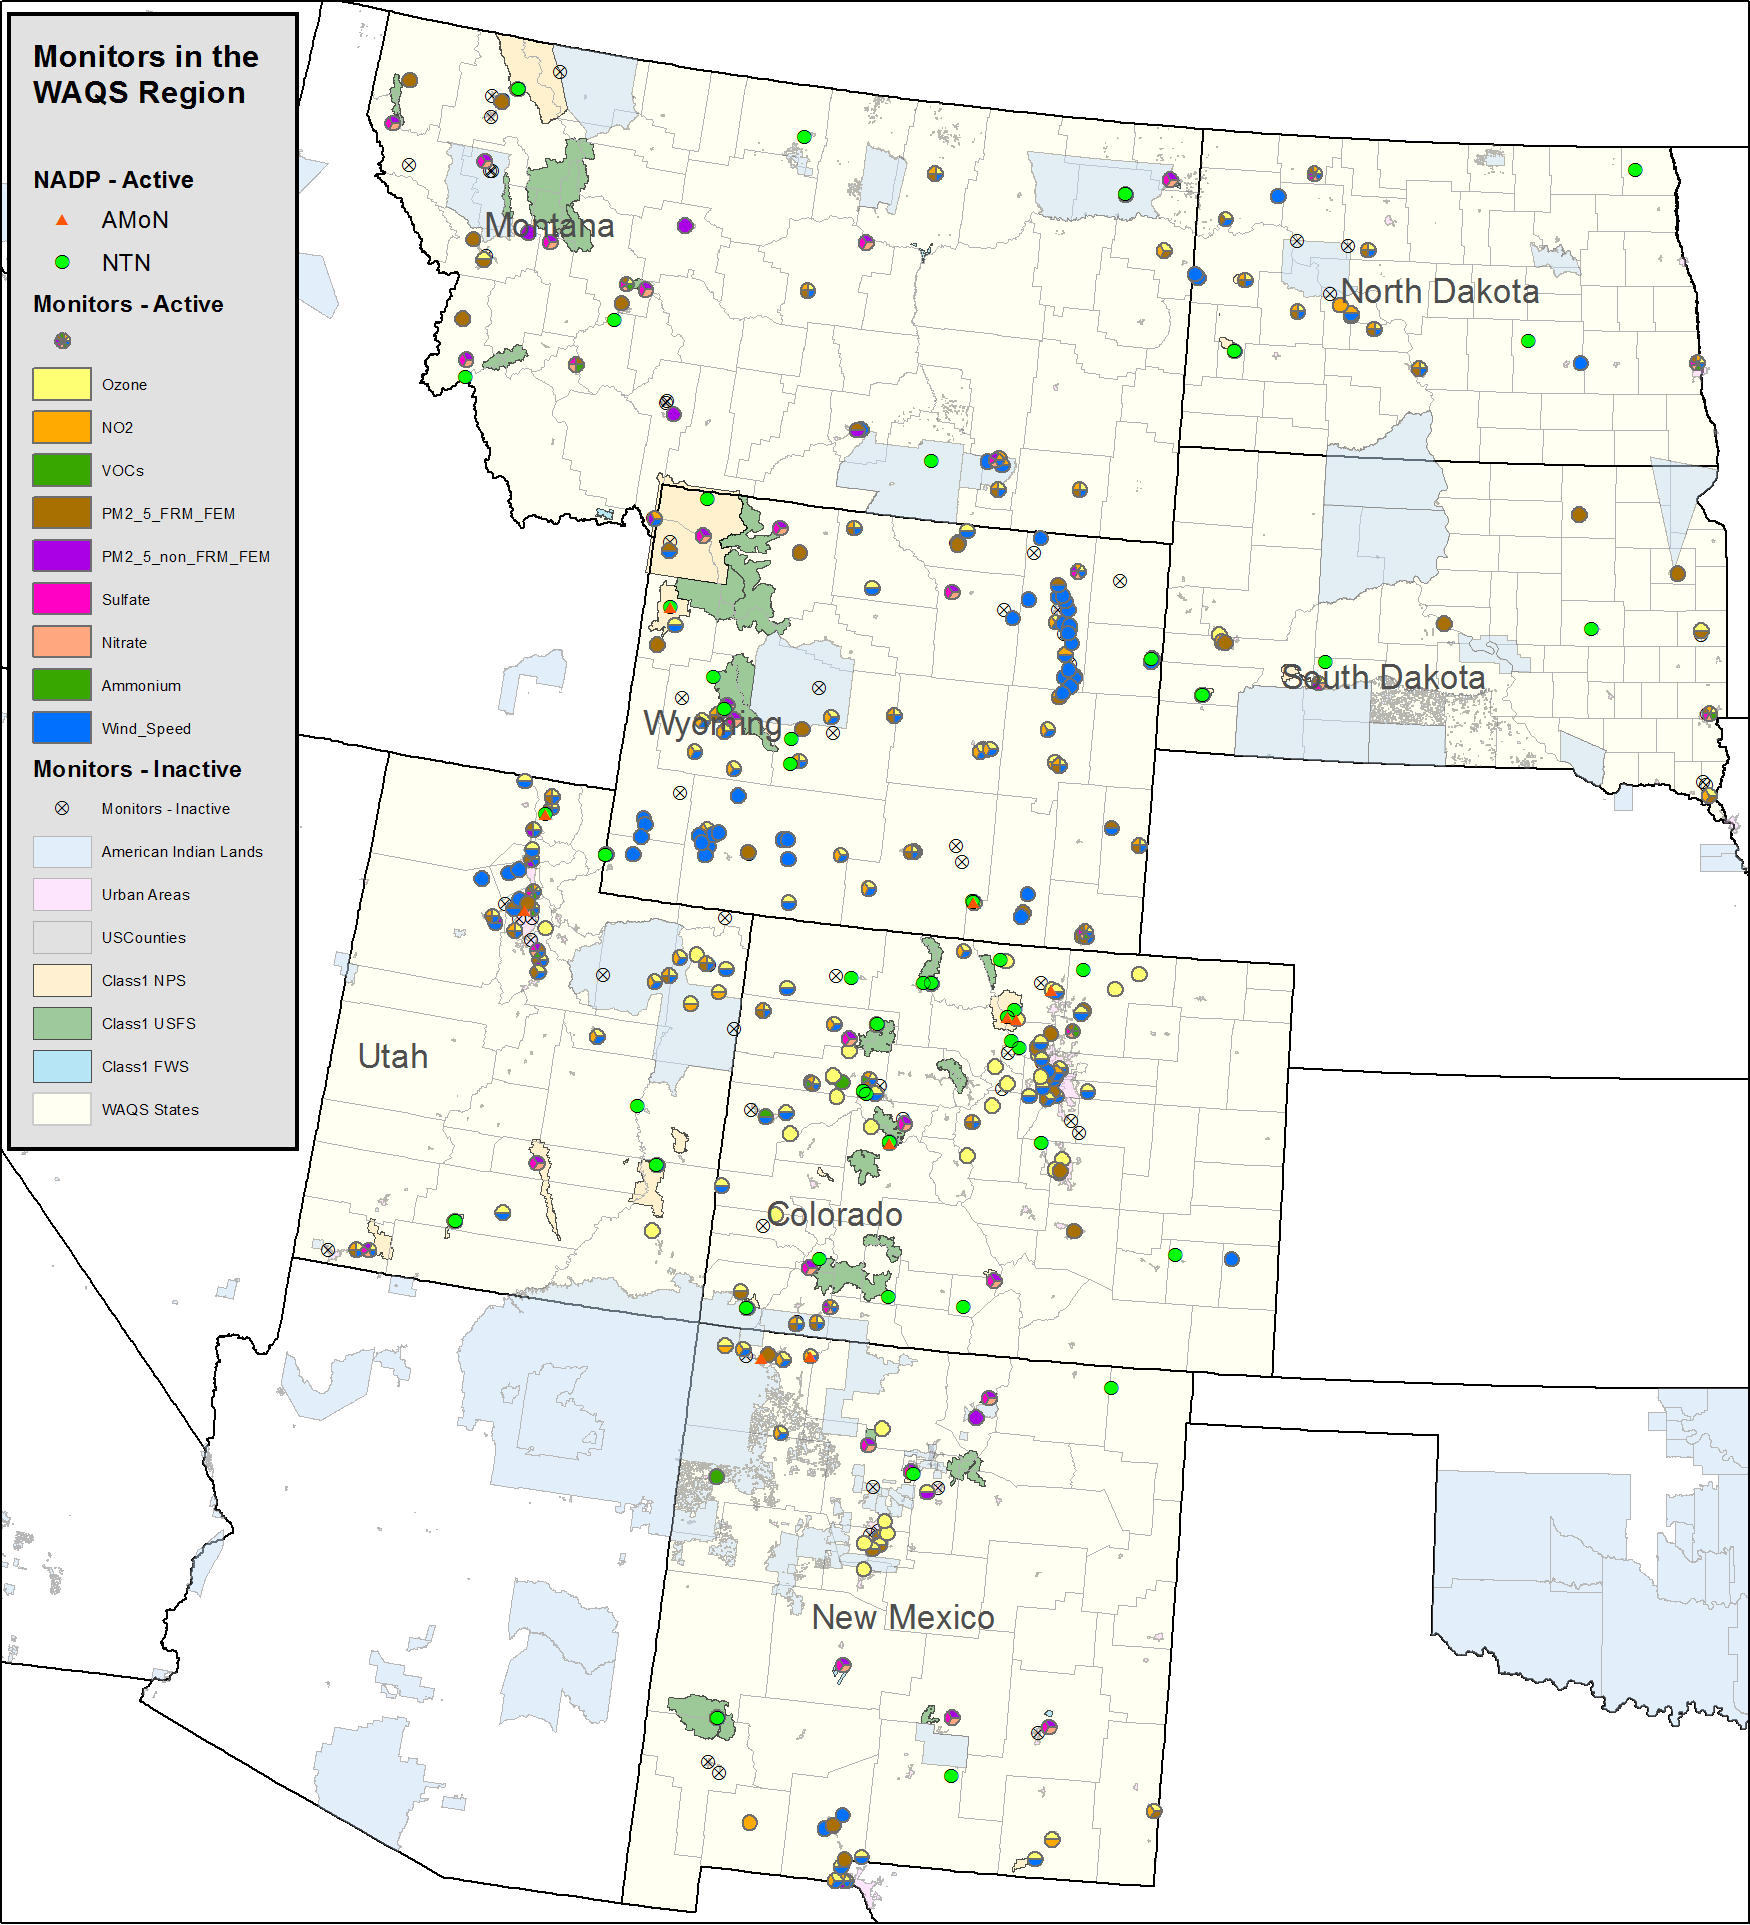
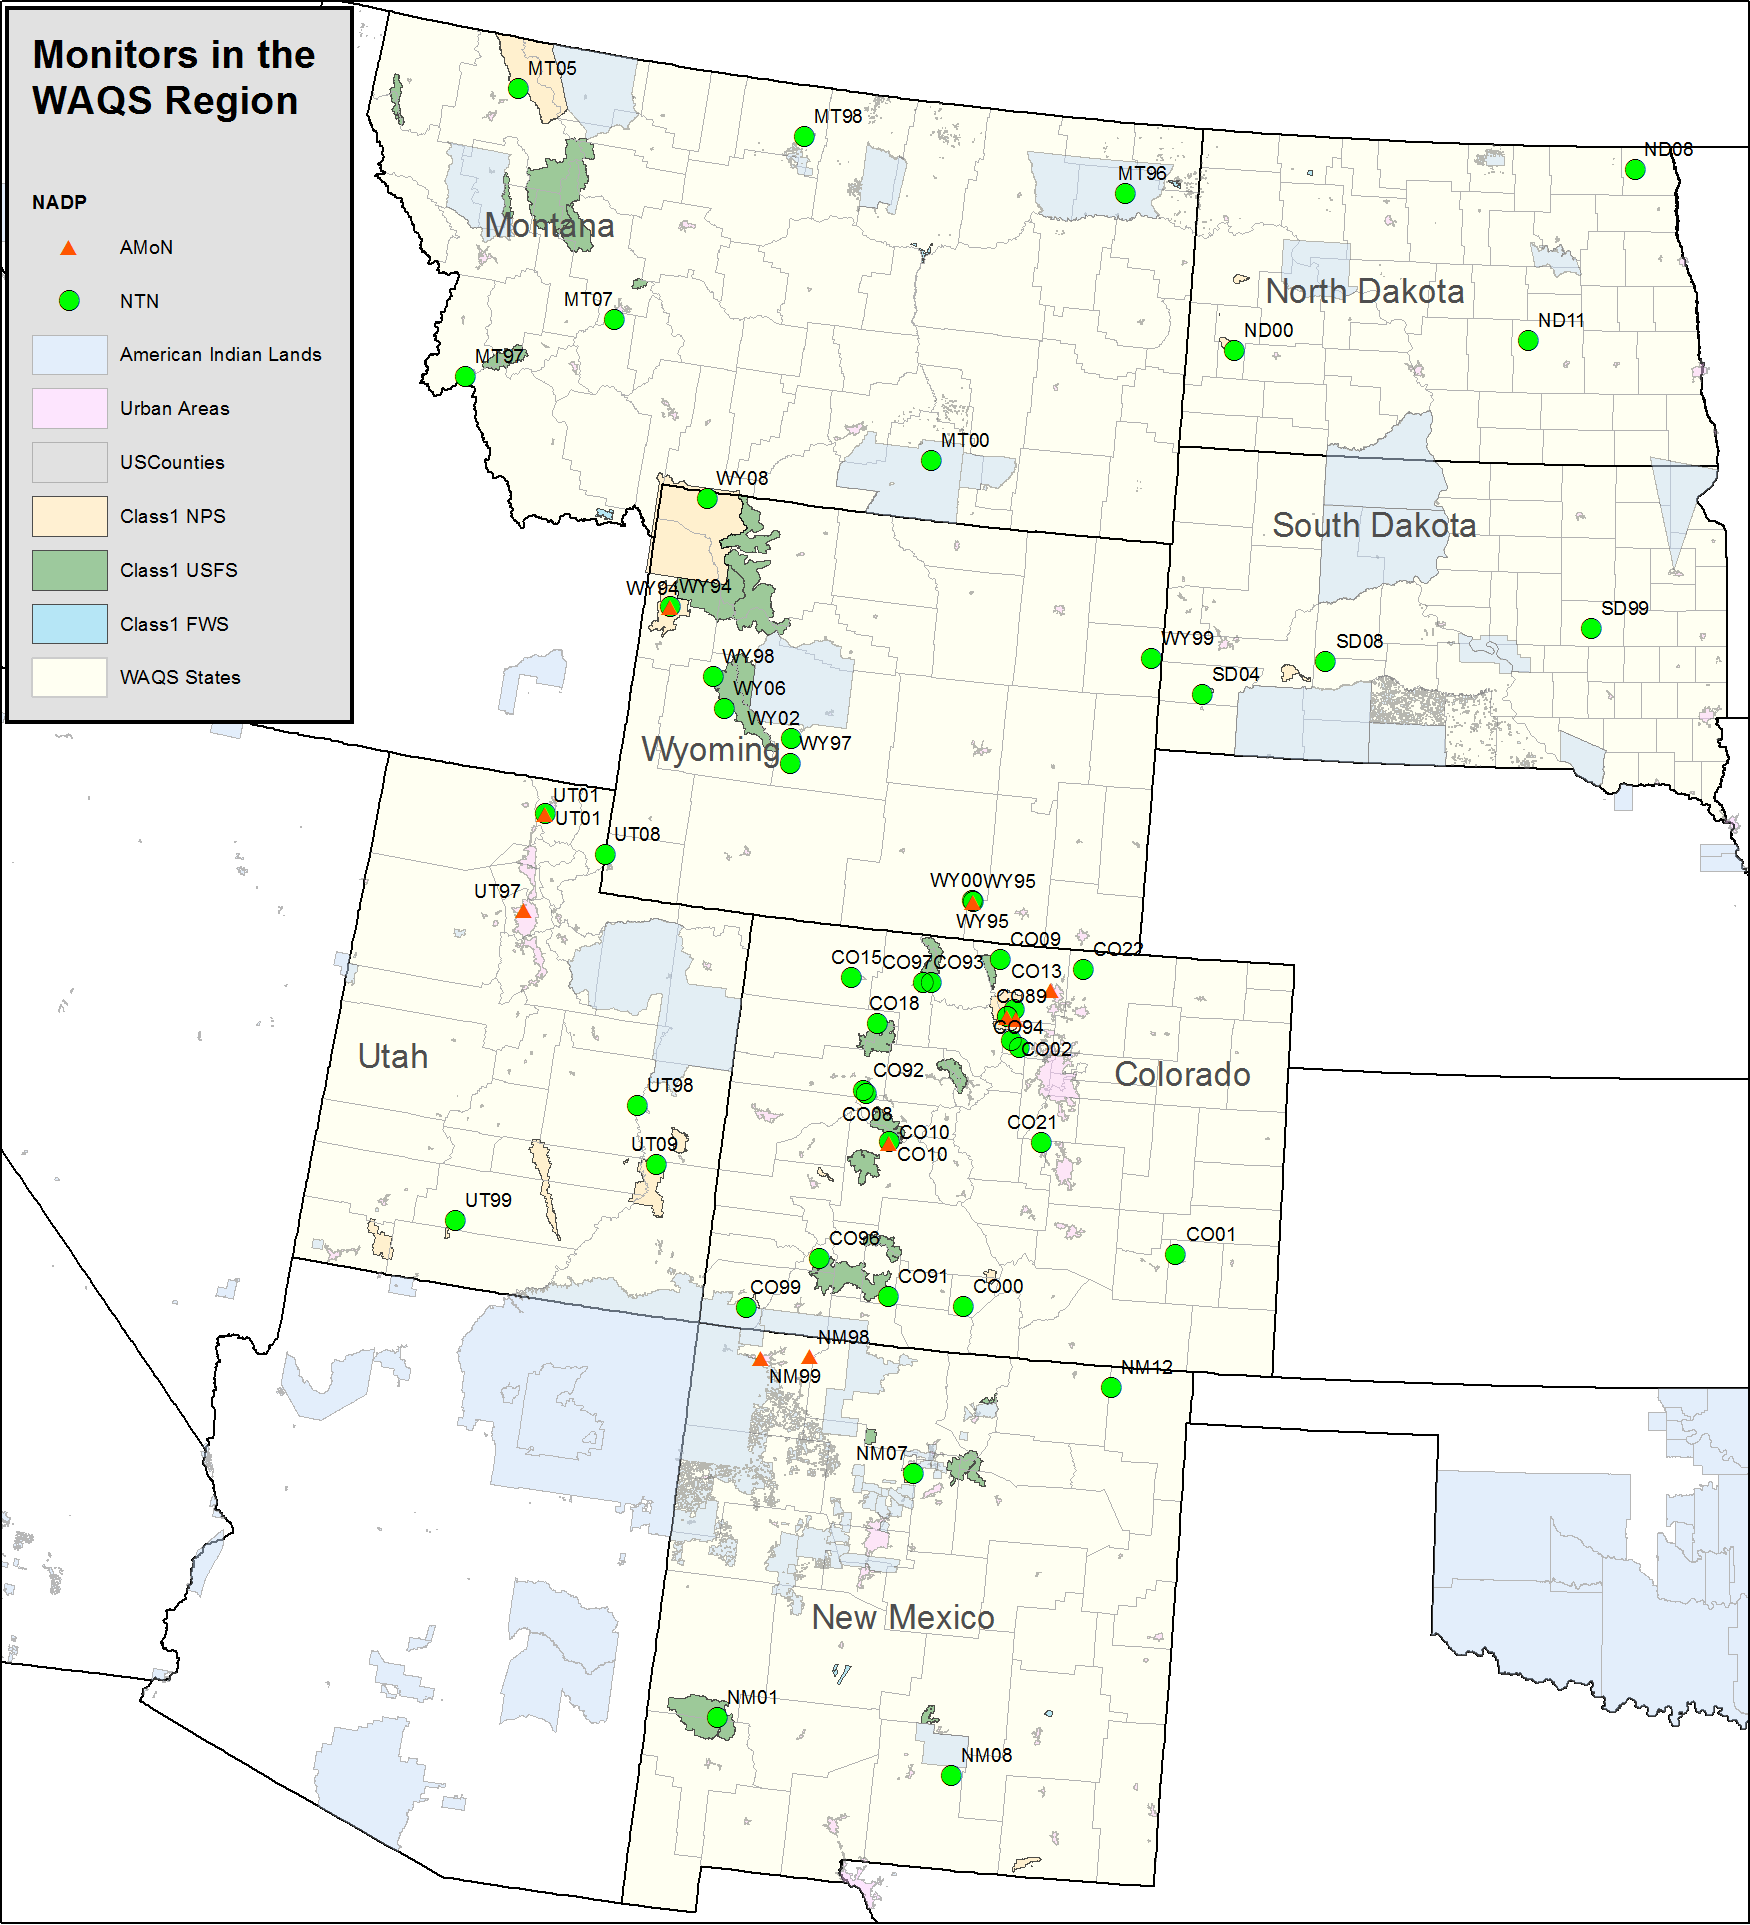
NADP sites AMoN and NTN
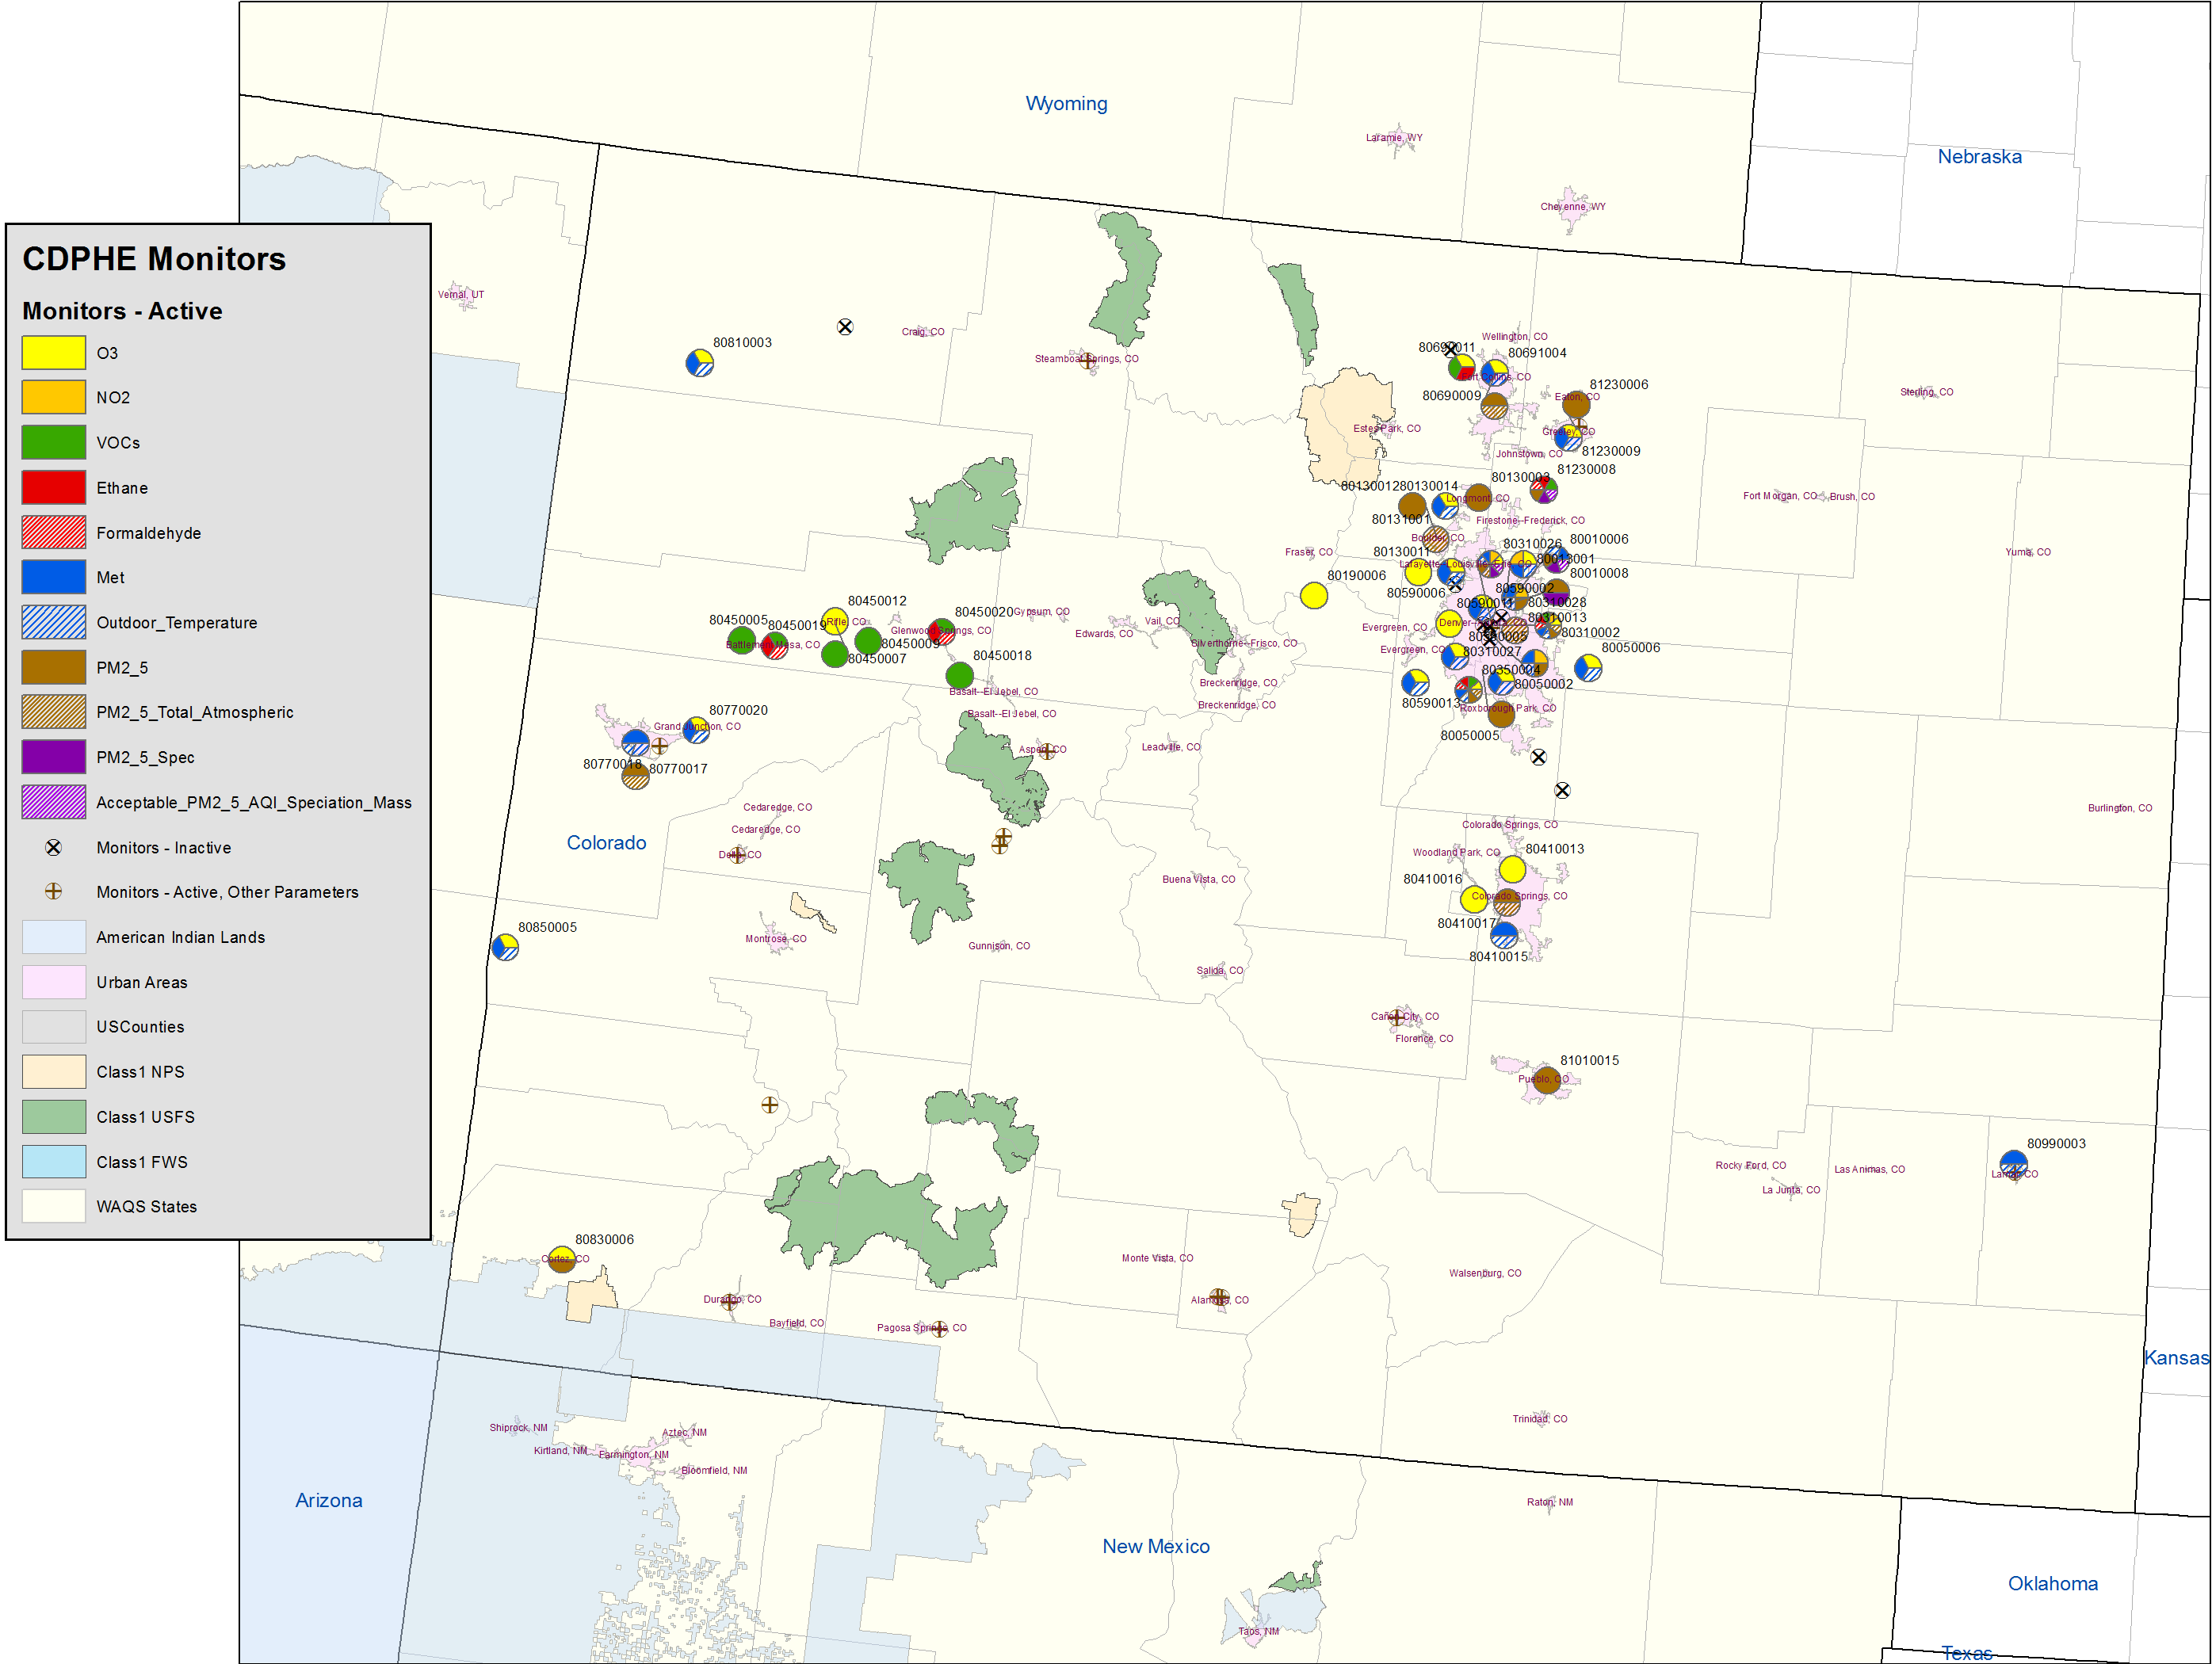
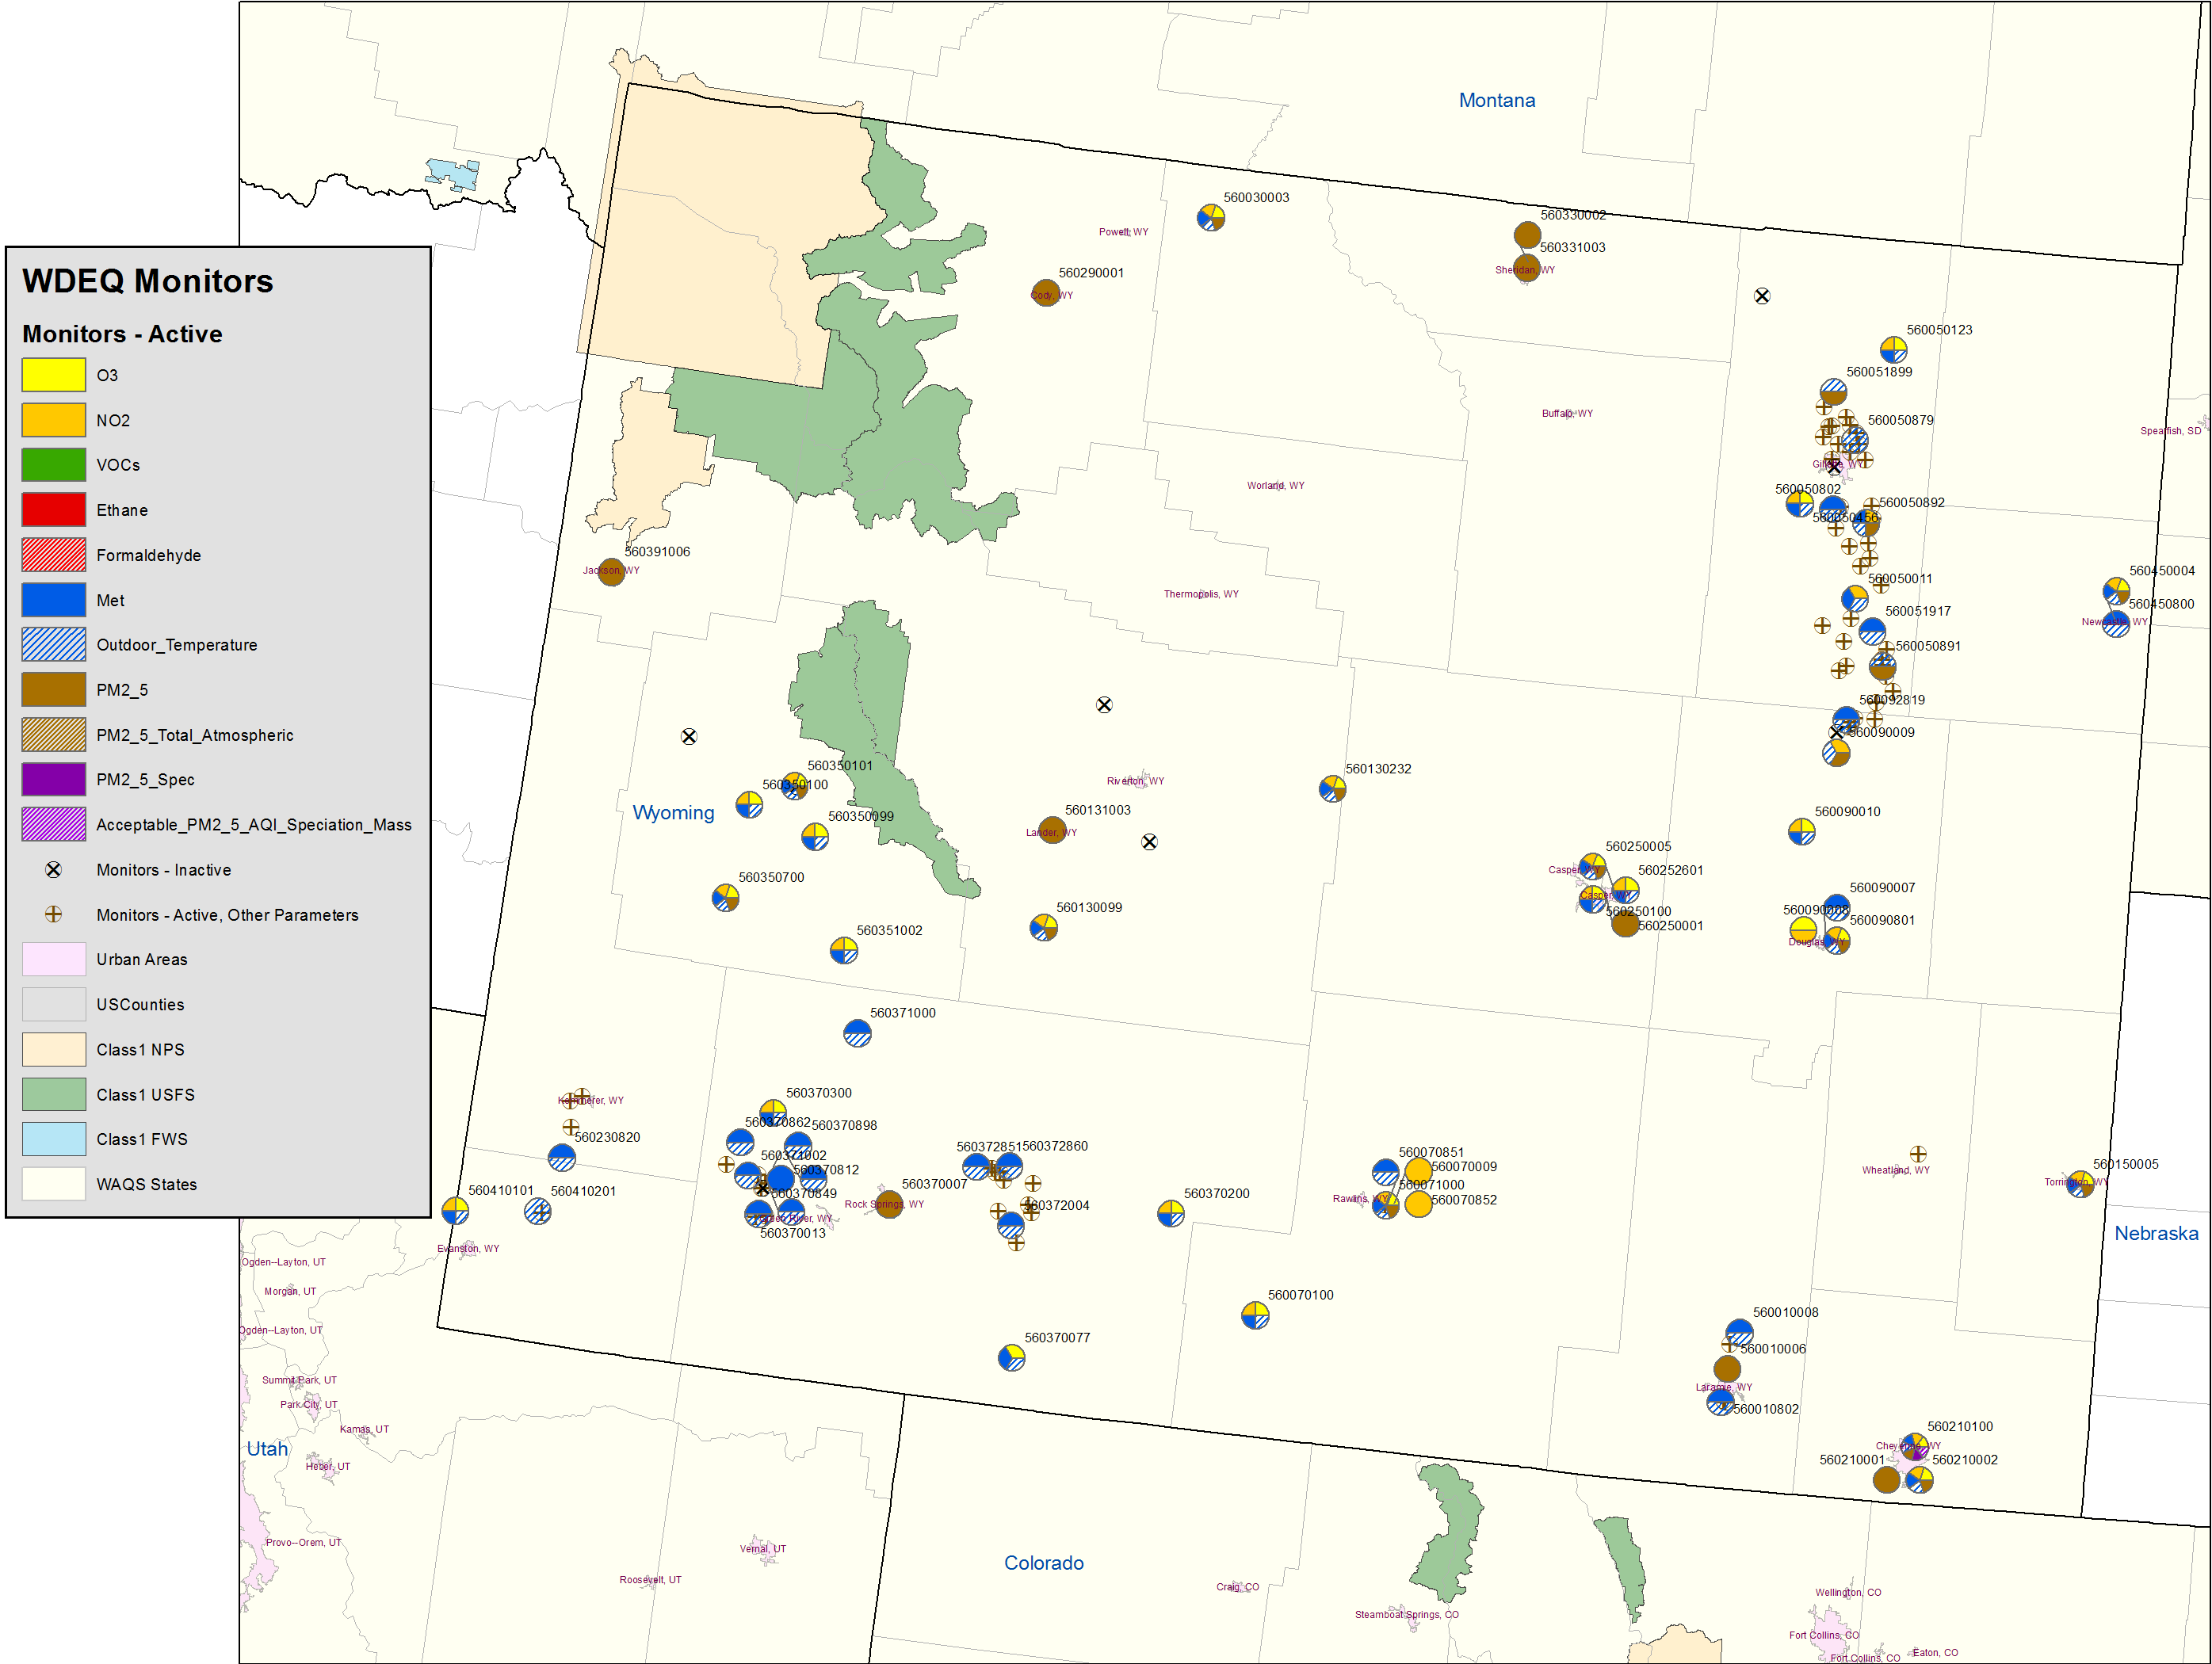
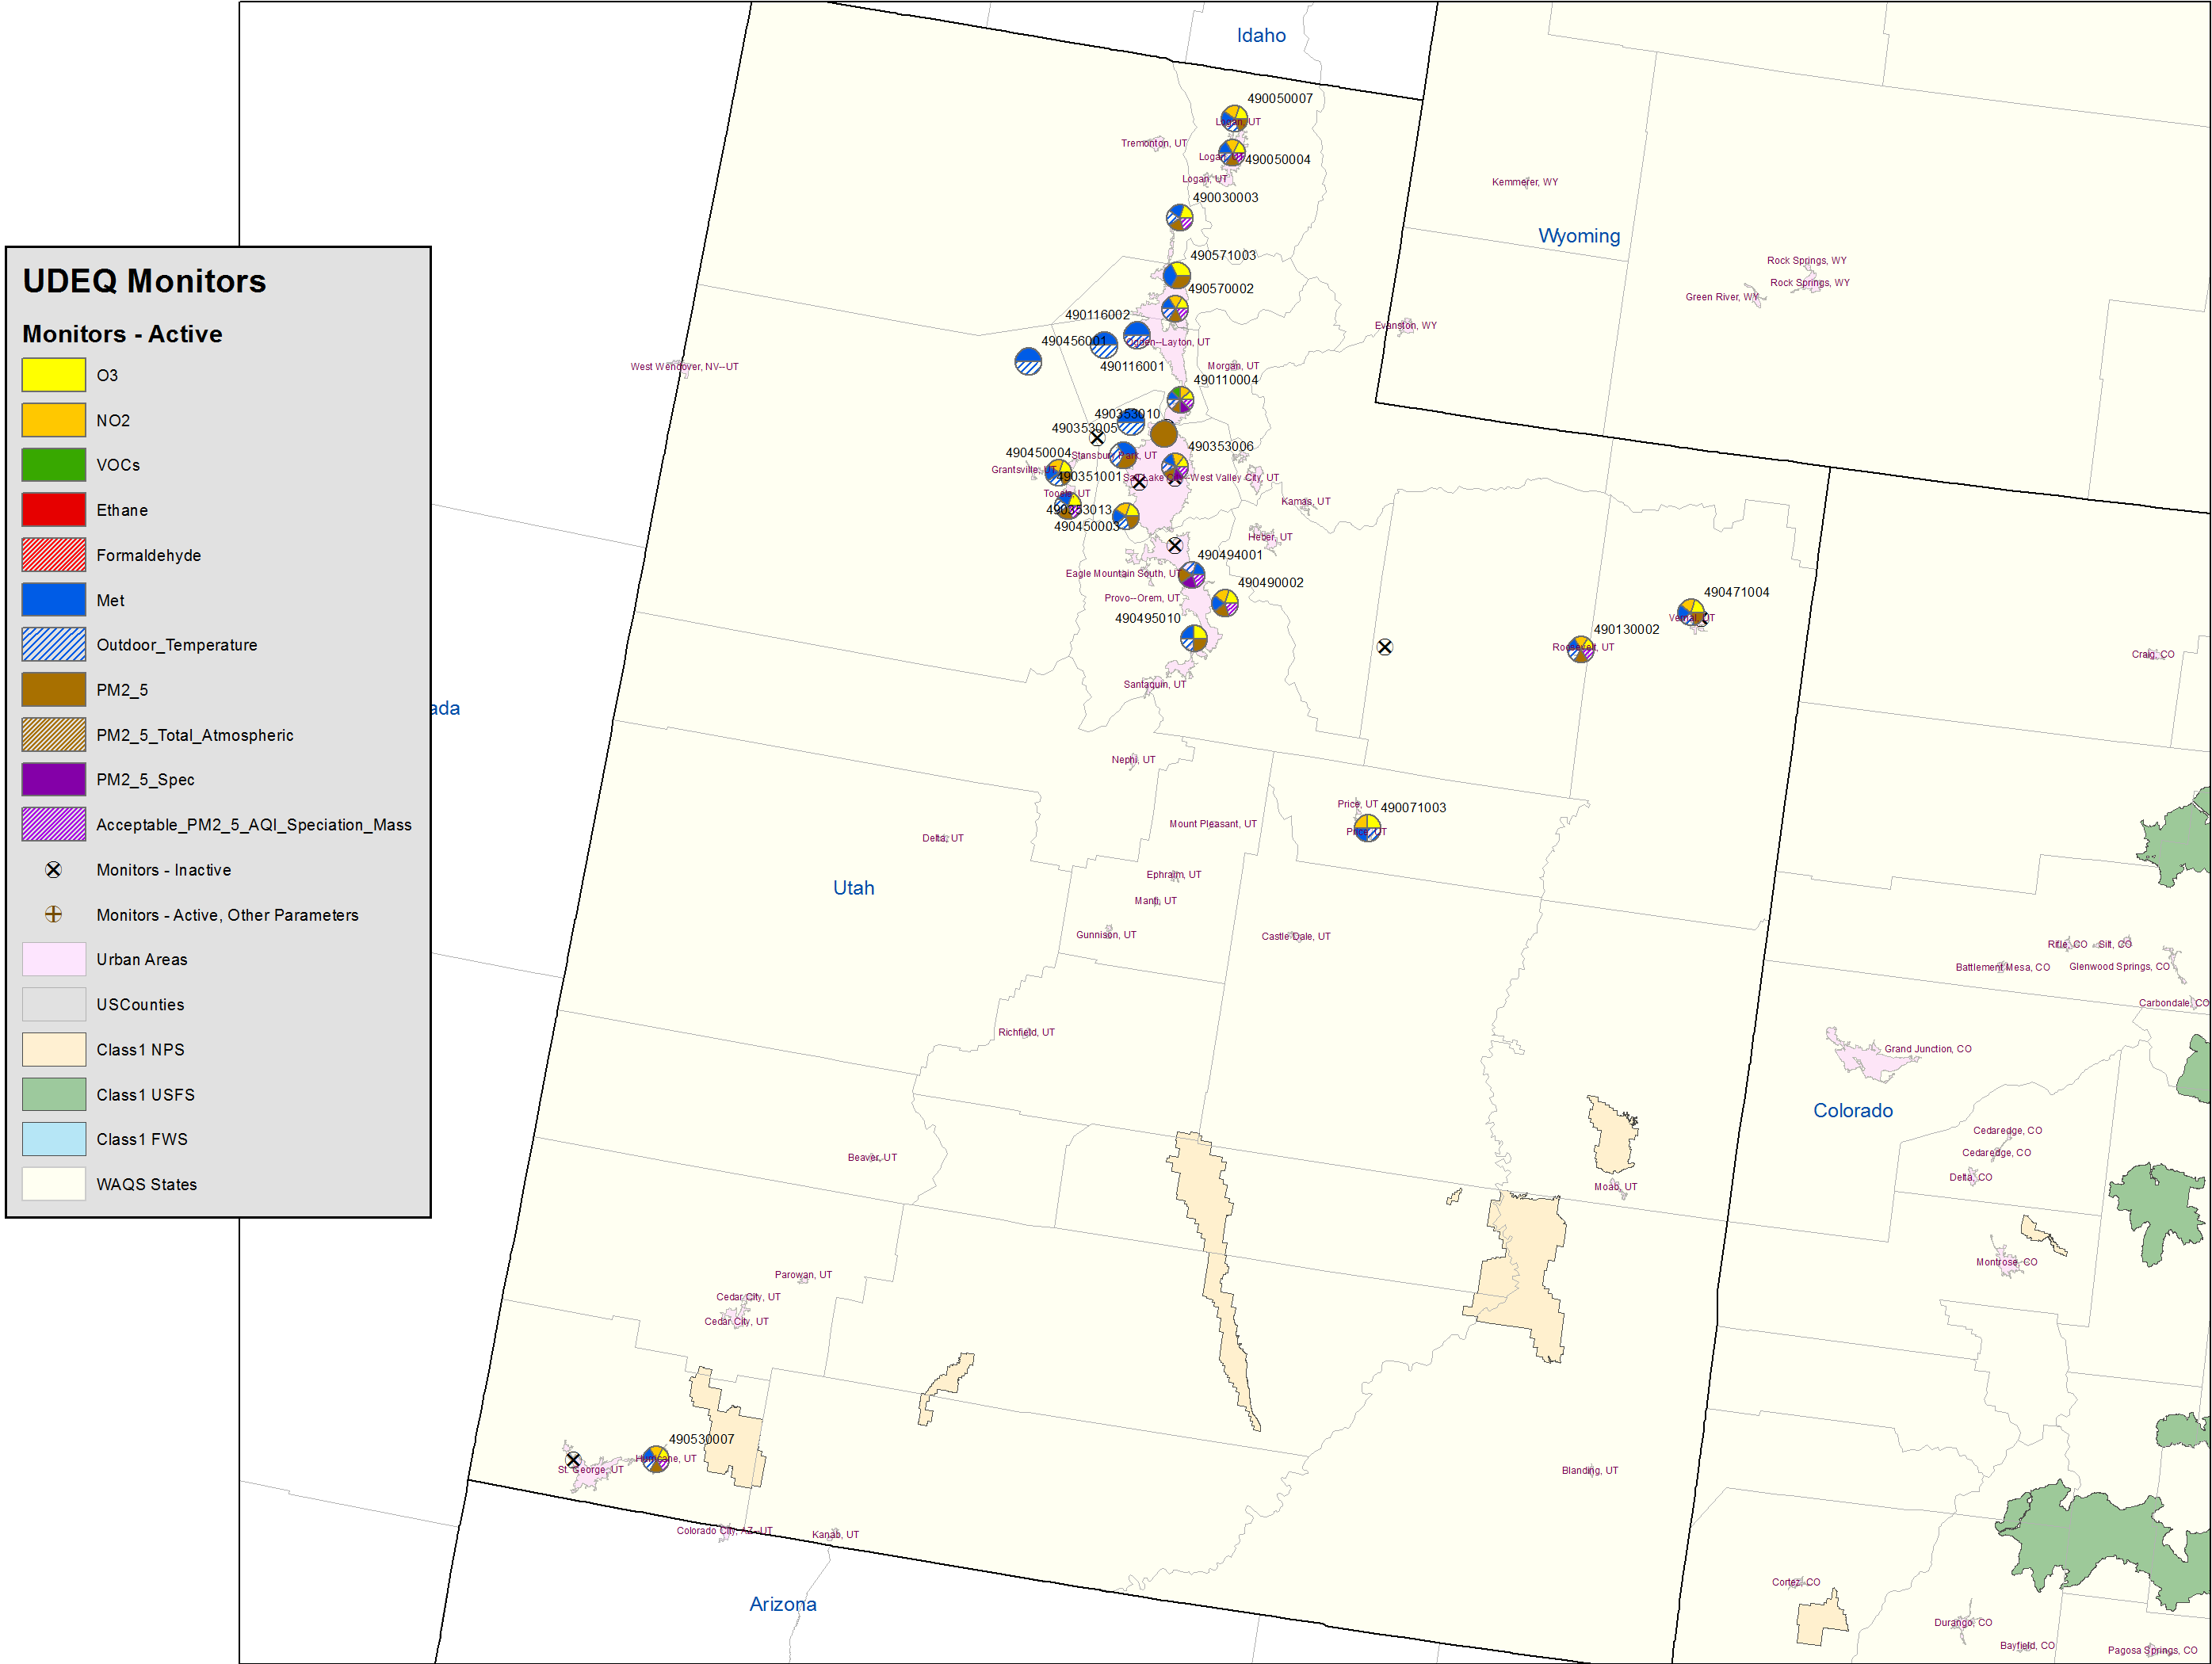
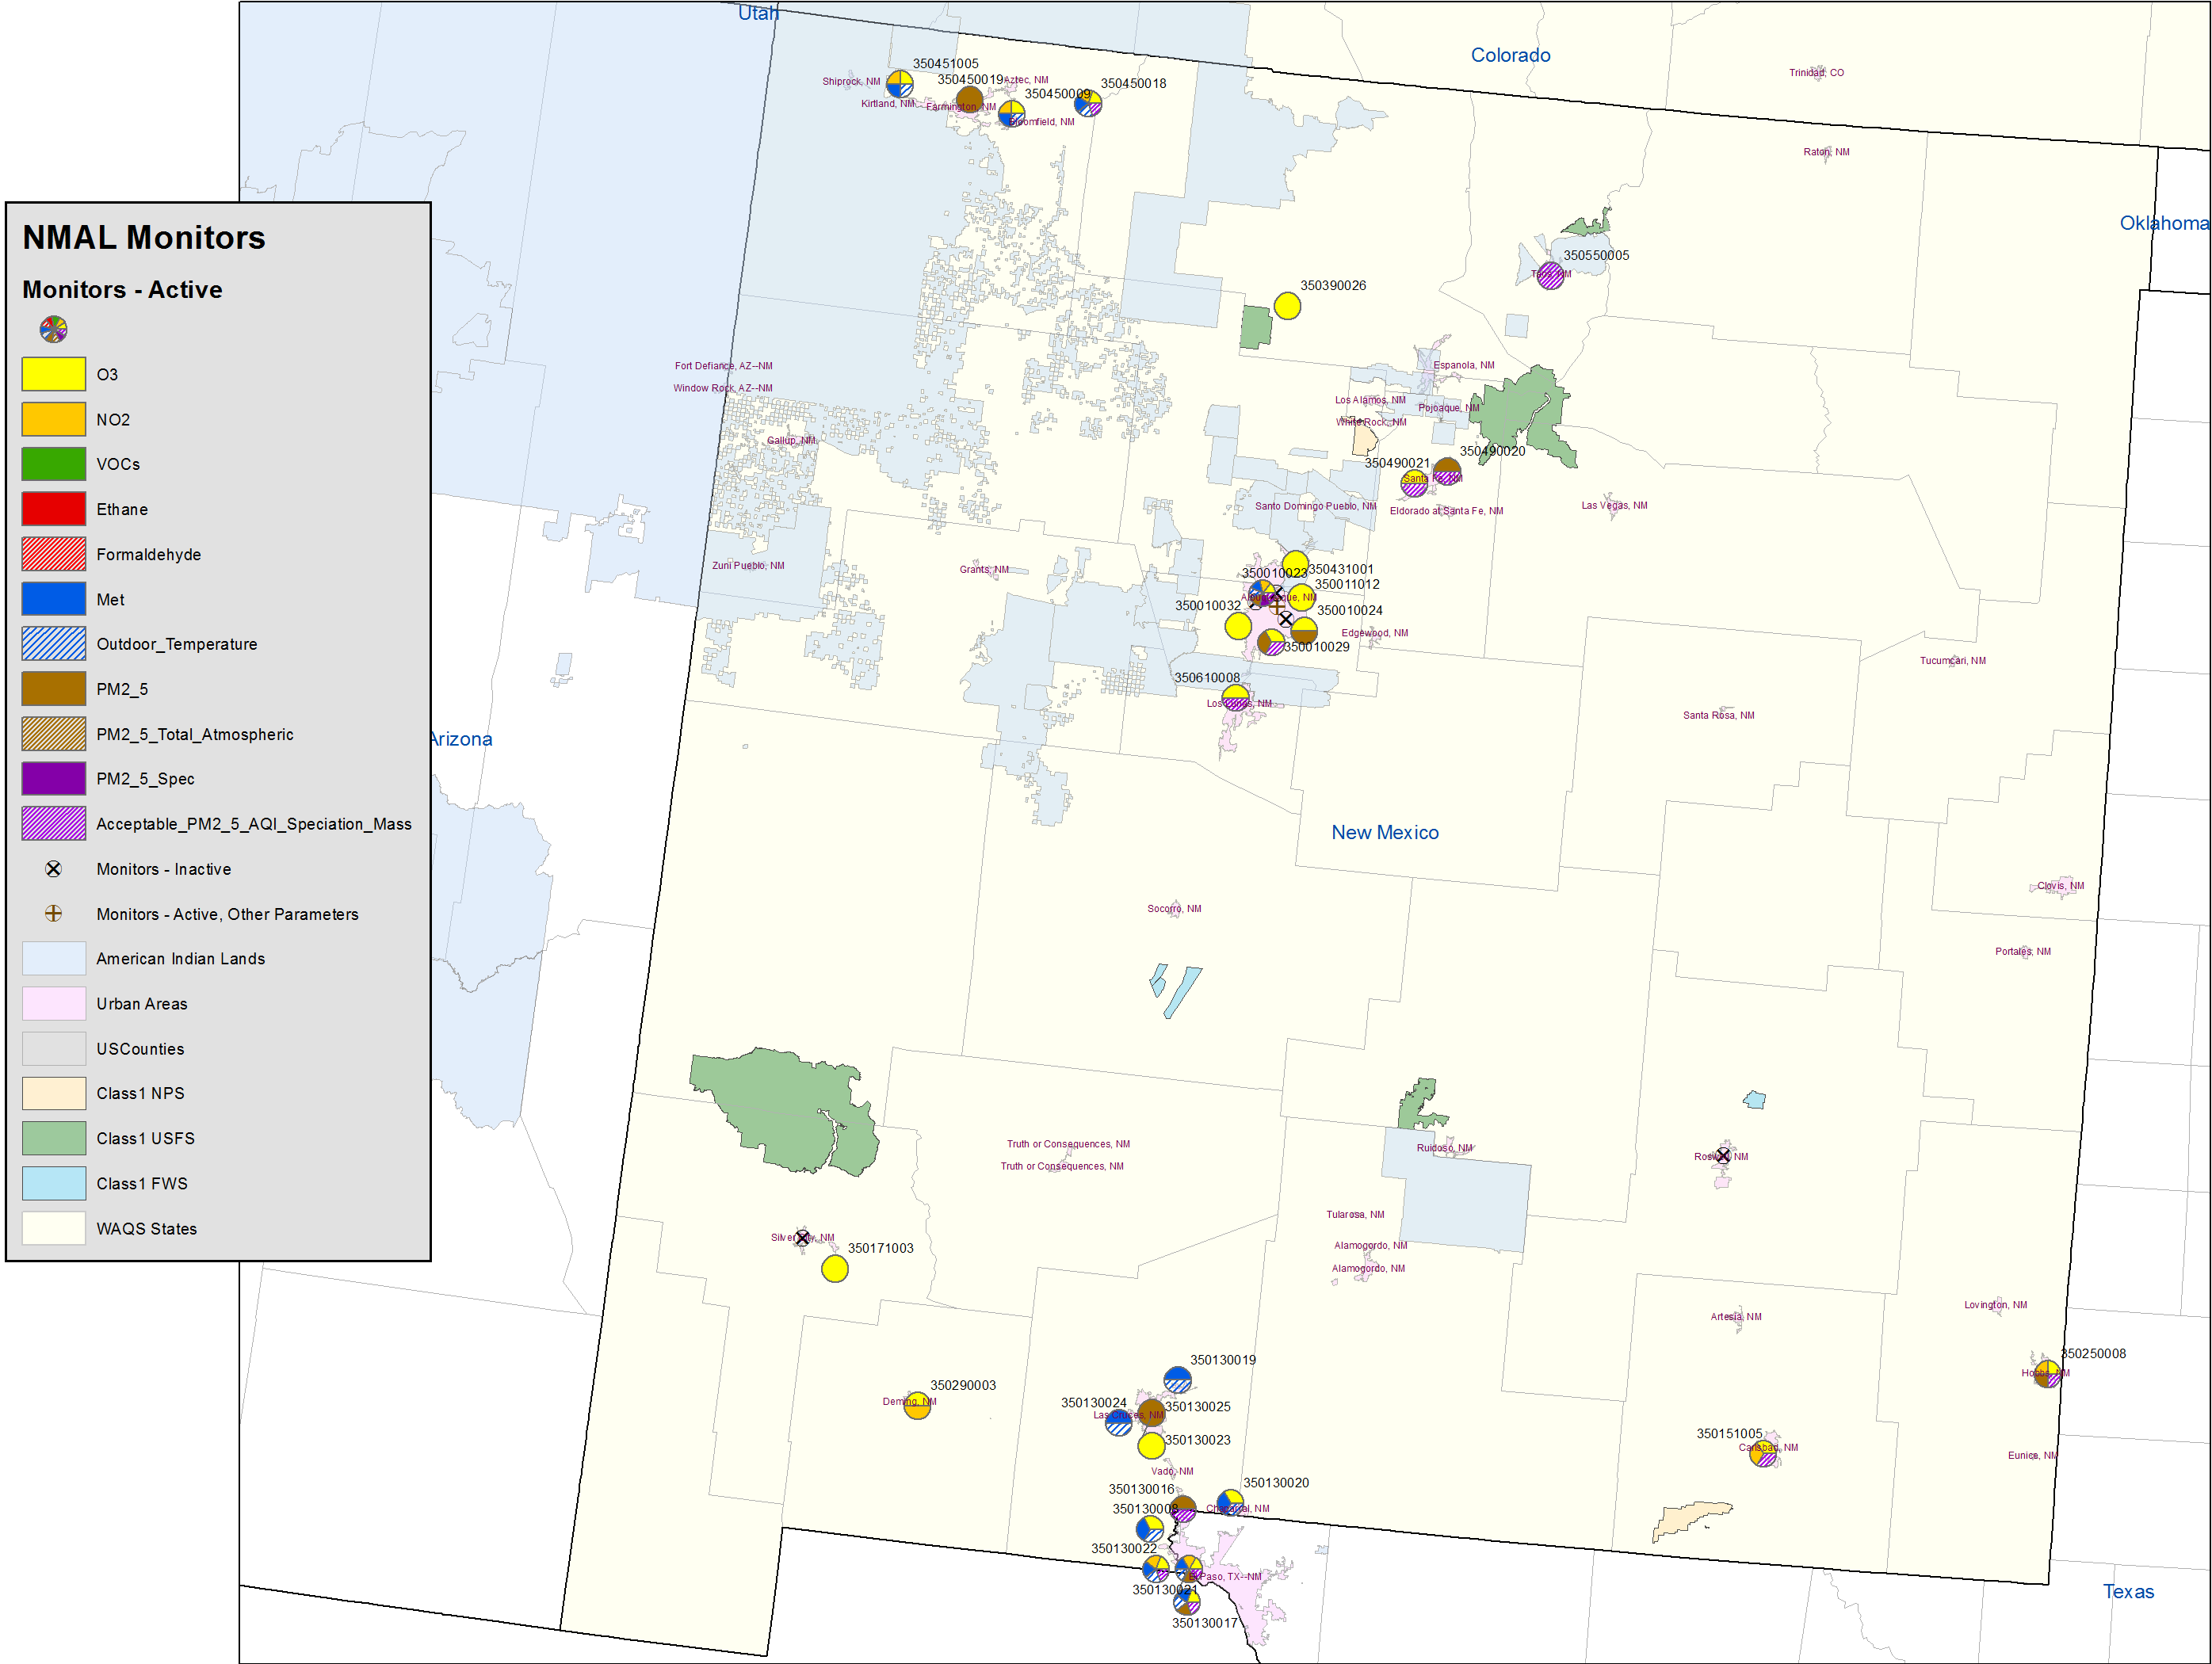
By Agency and/or Organization Maps showing monitors affiliated with organizations considered in the WAQS MNA
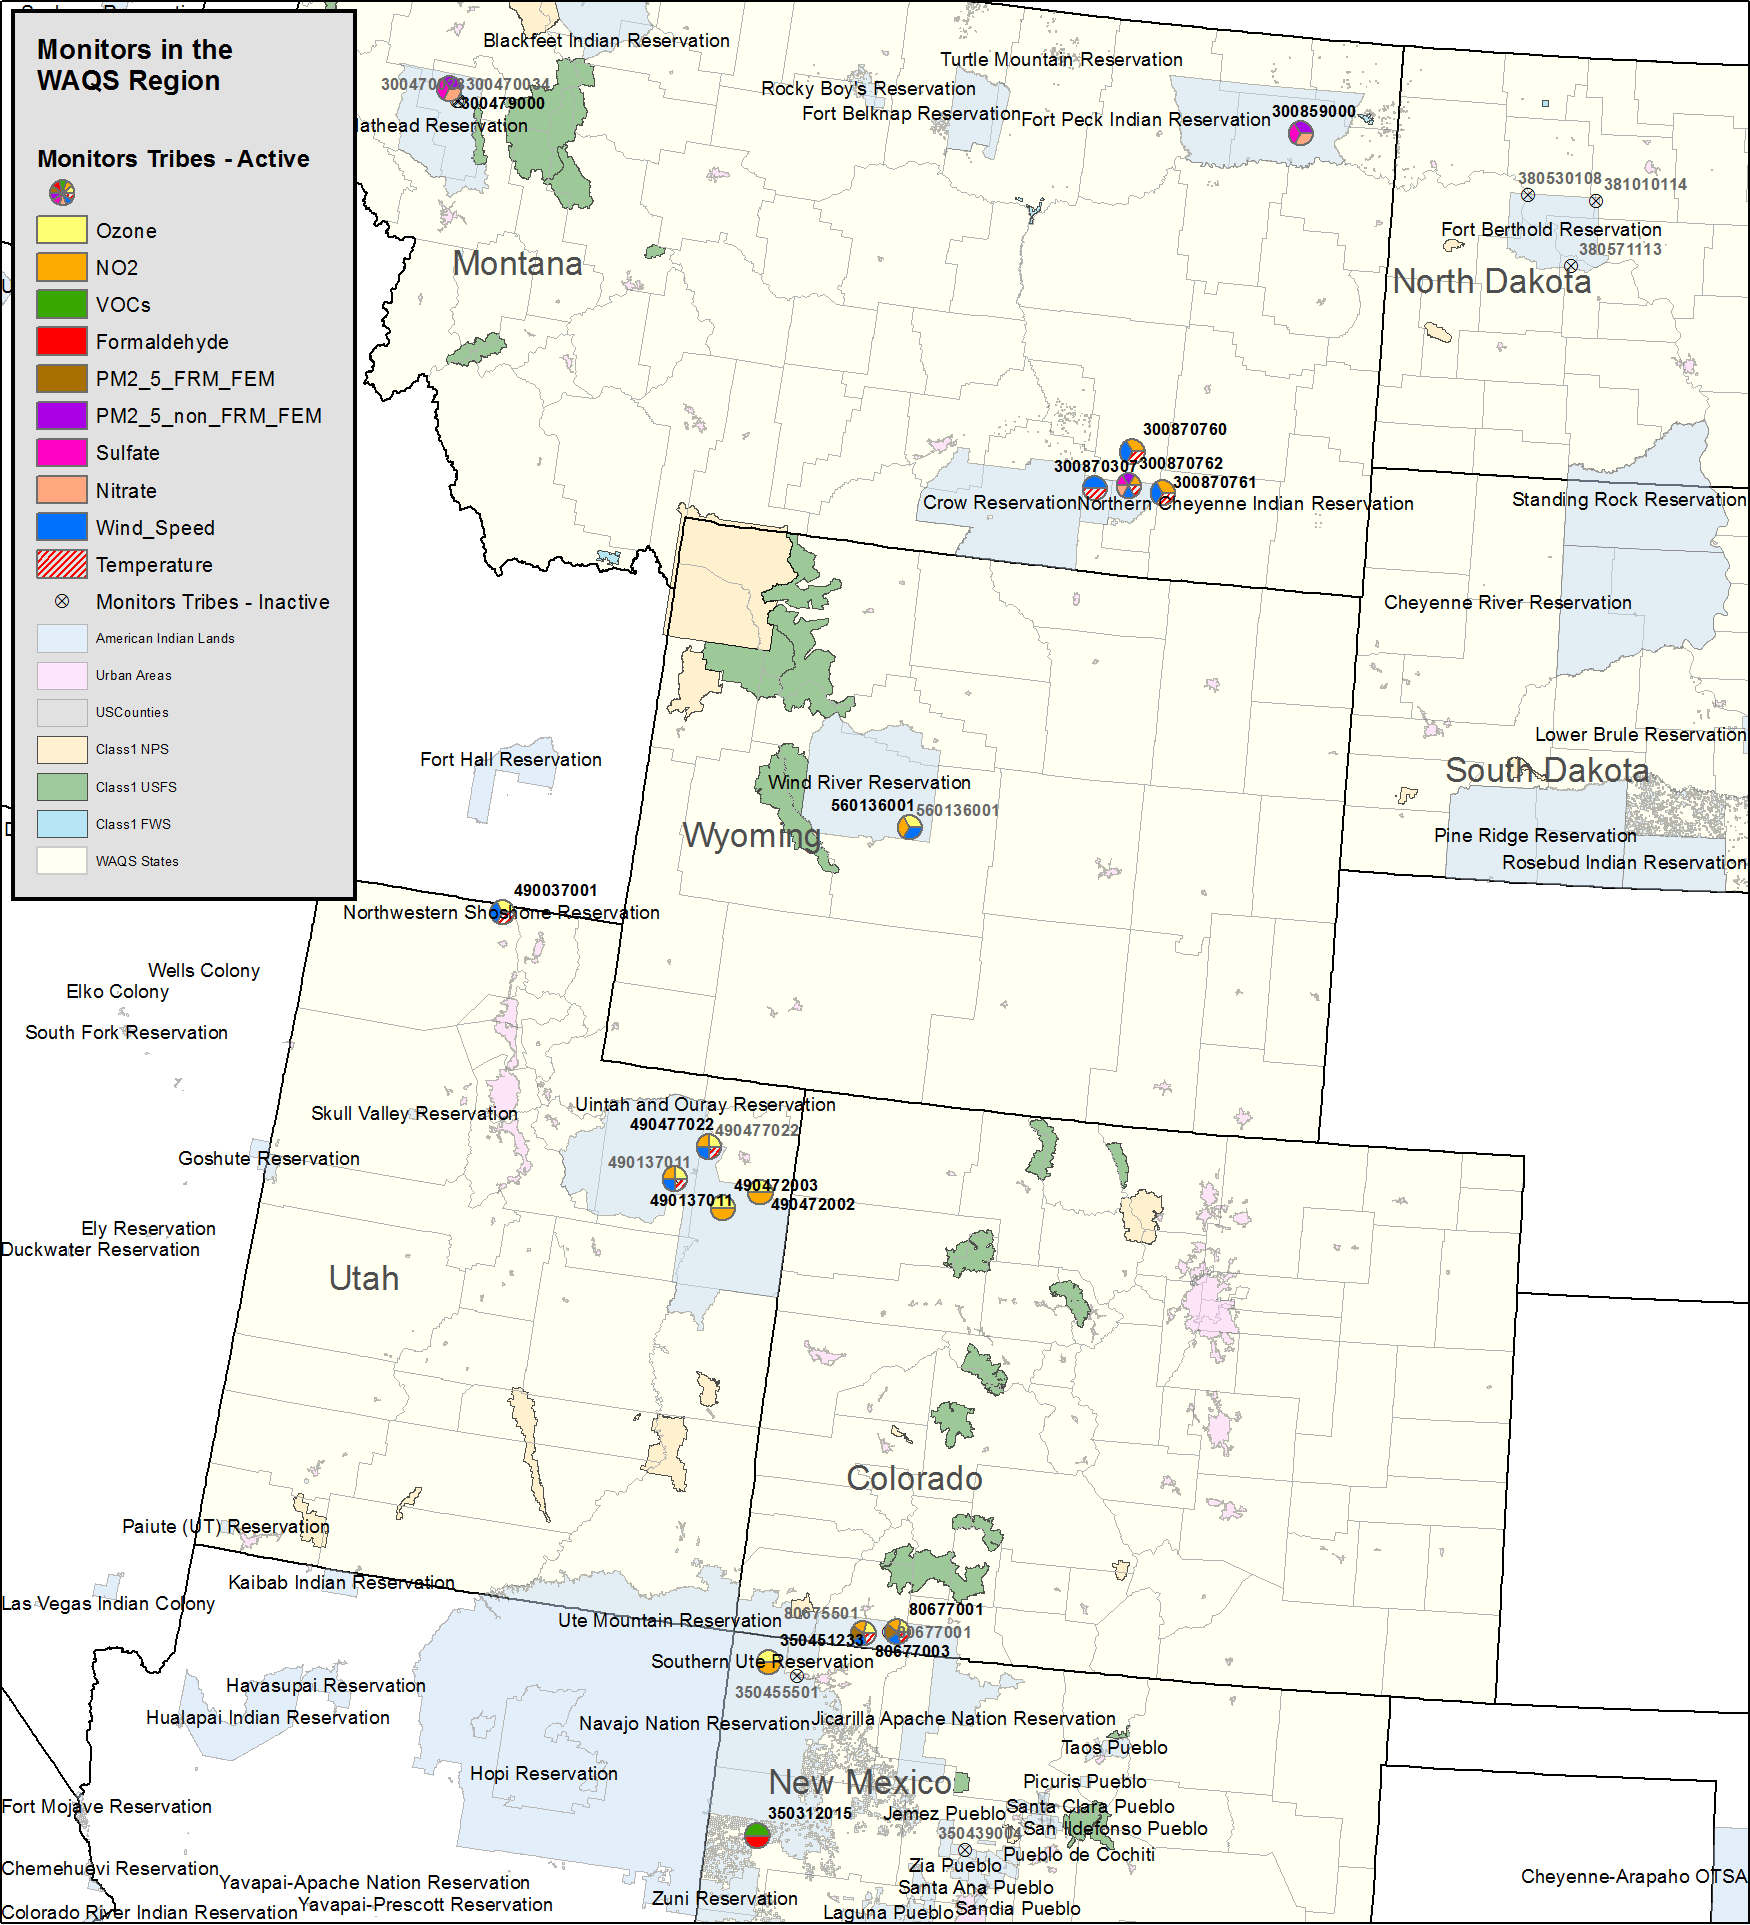
Tribes
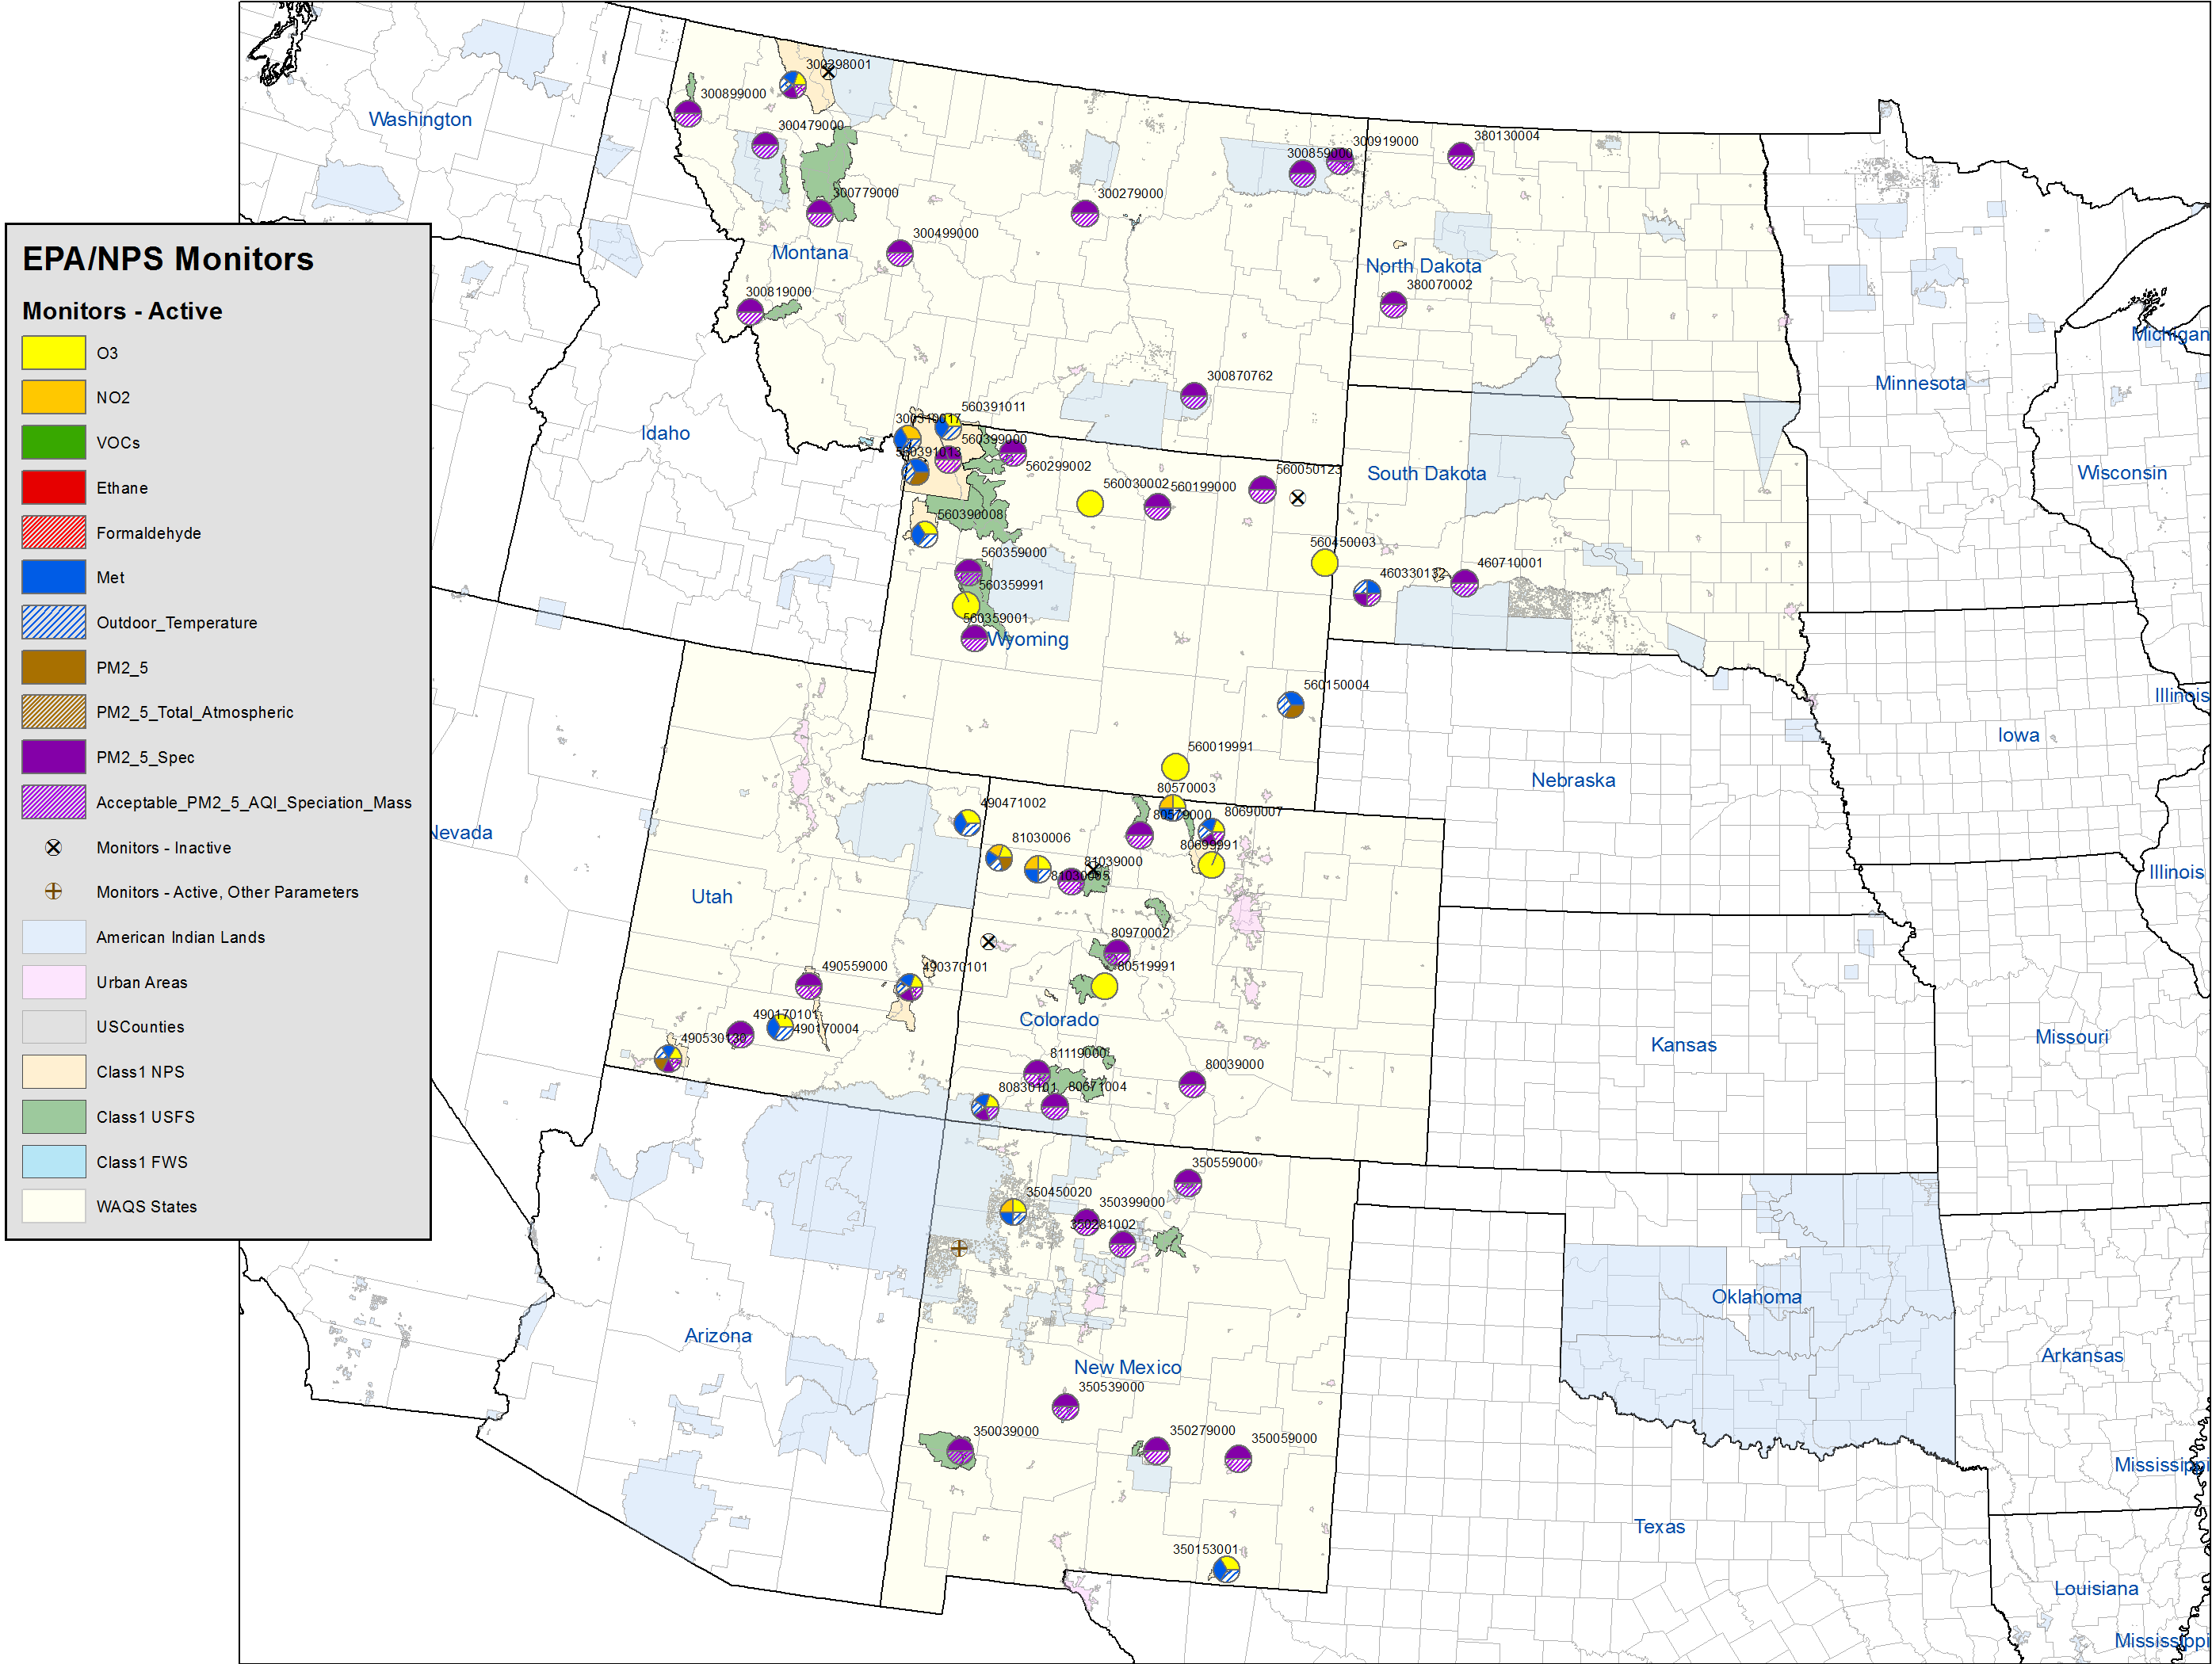
EPA-NPS
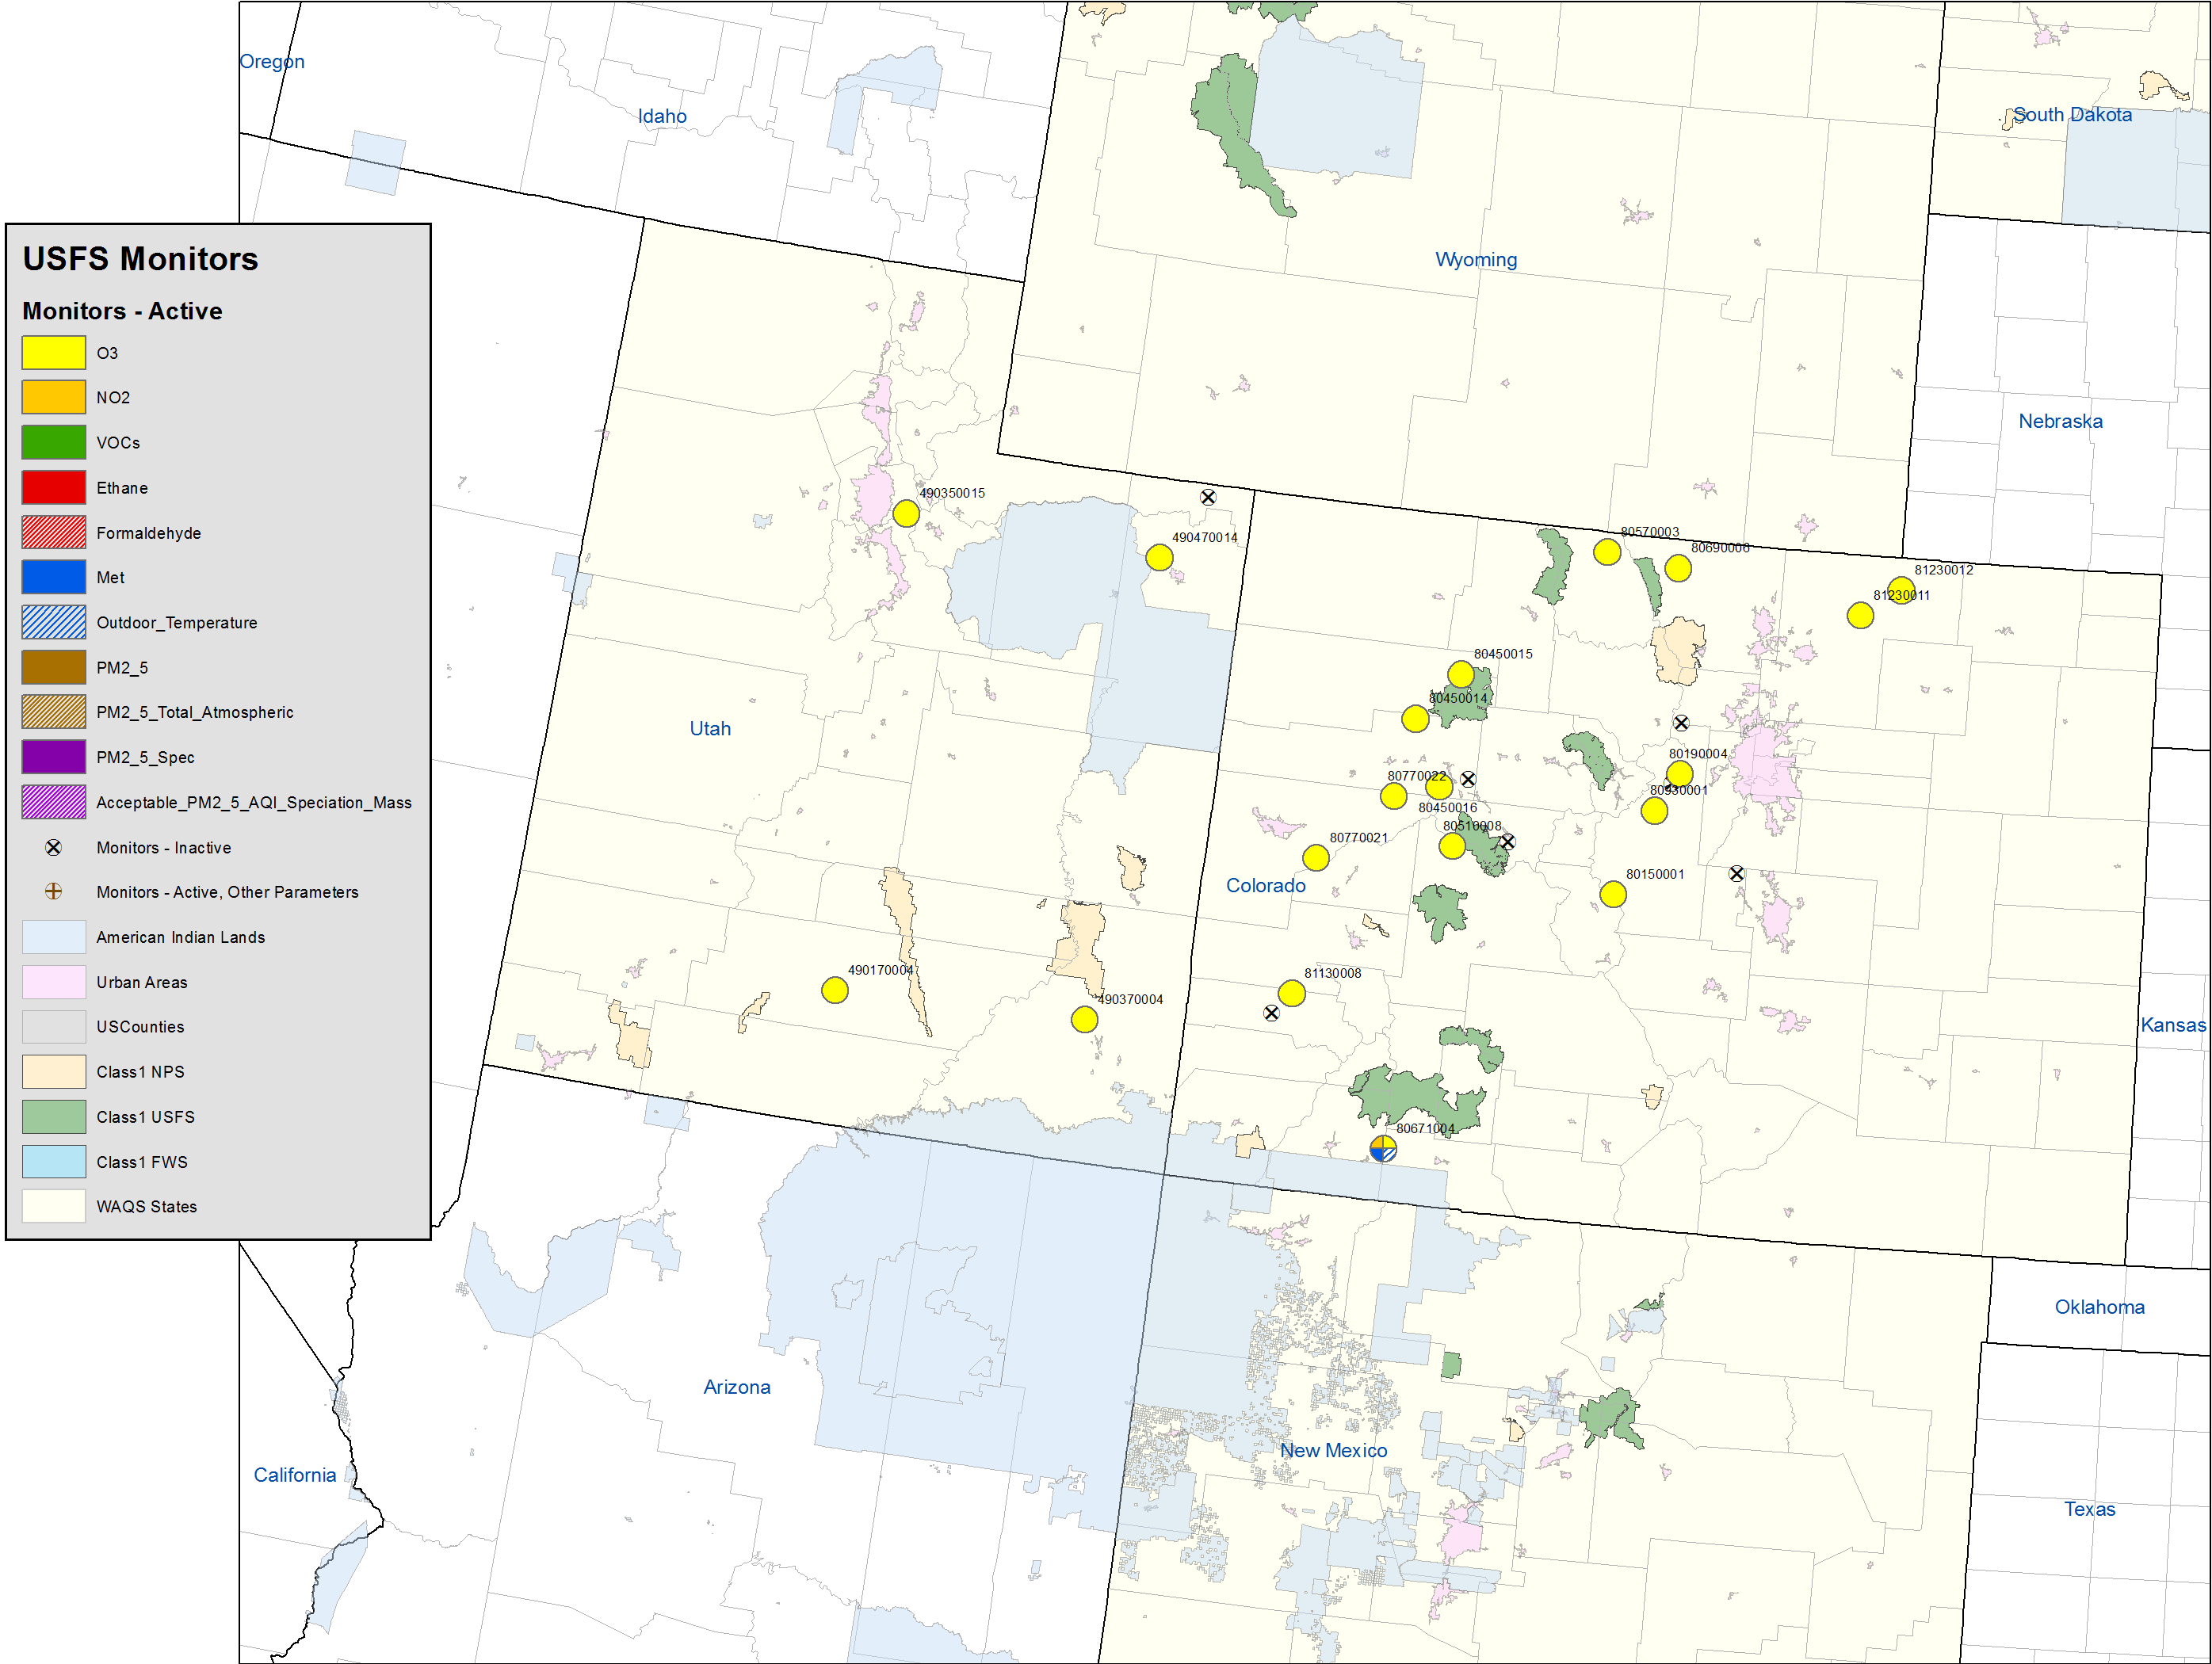
USFS
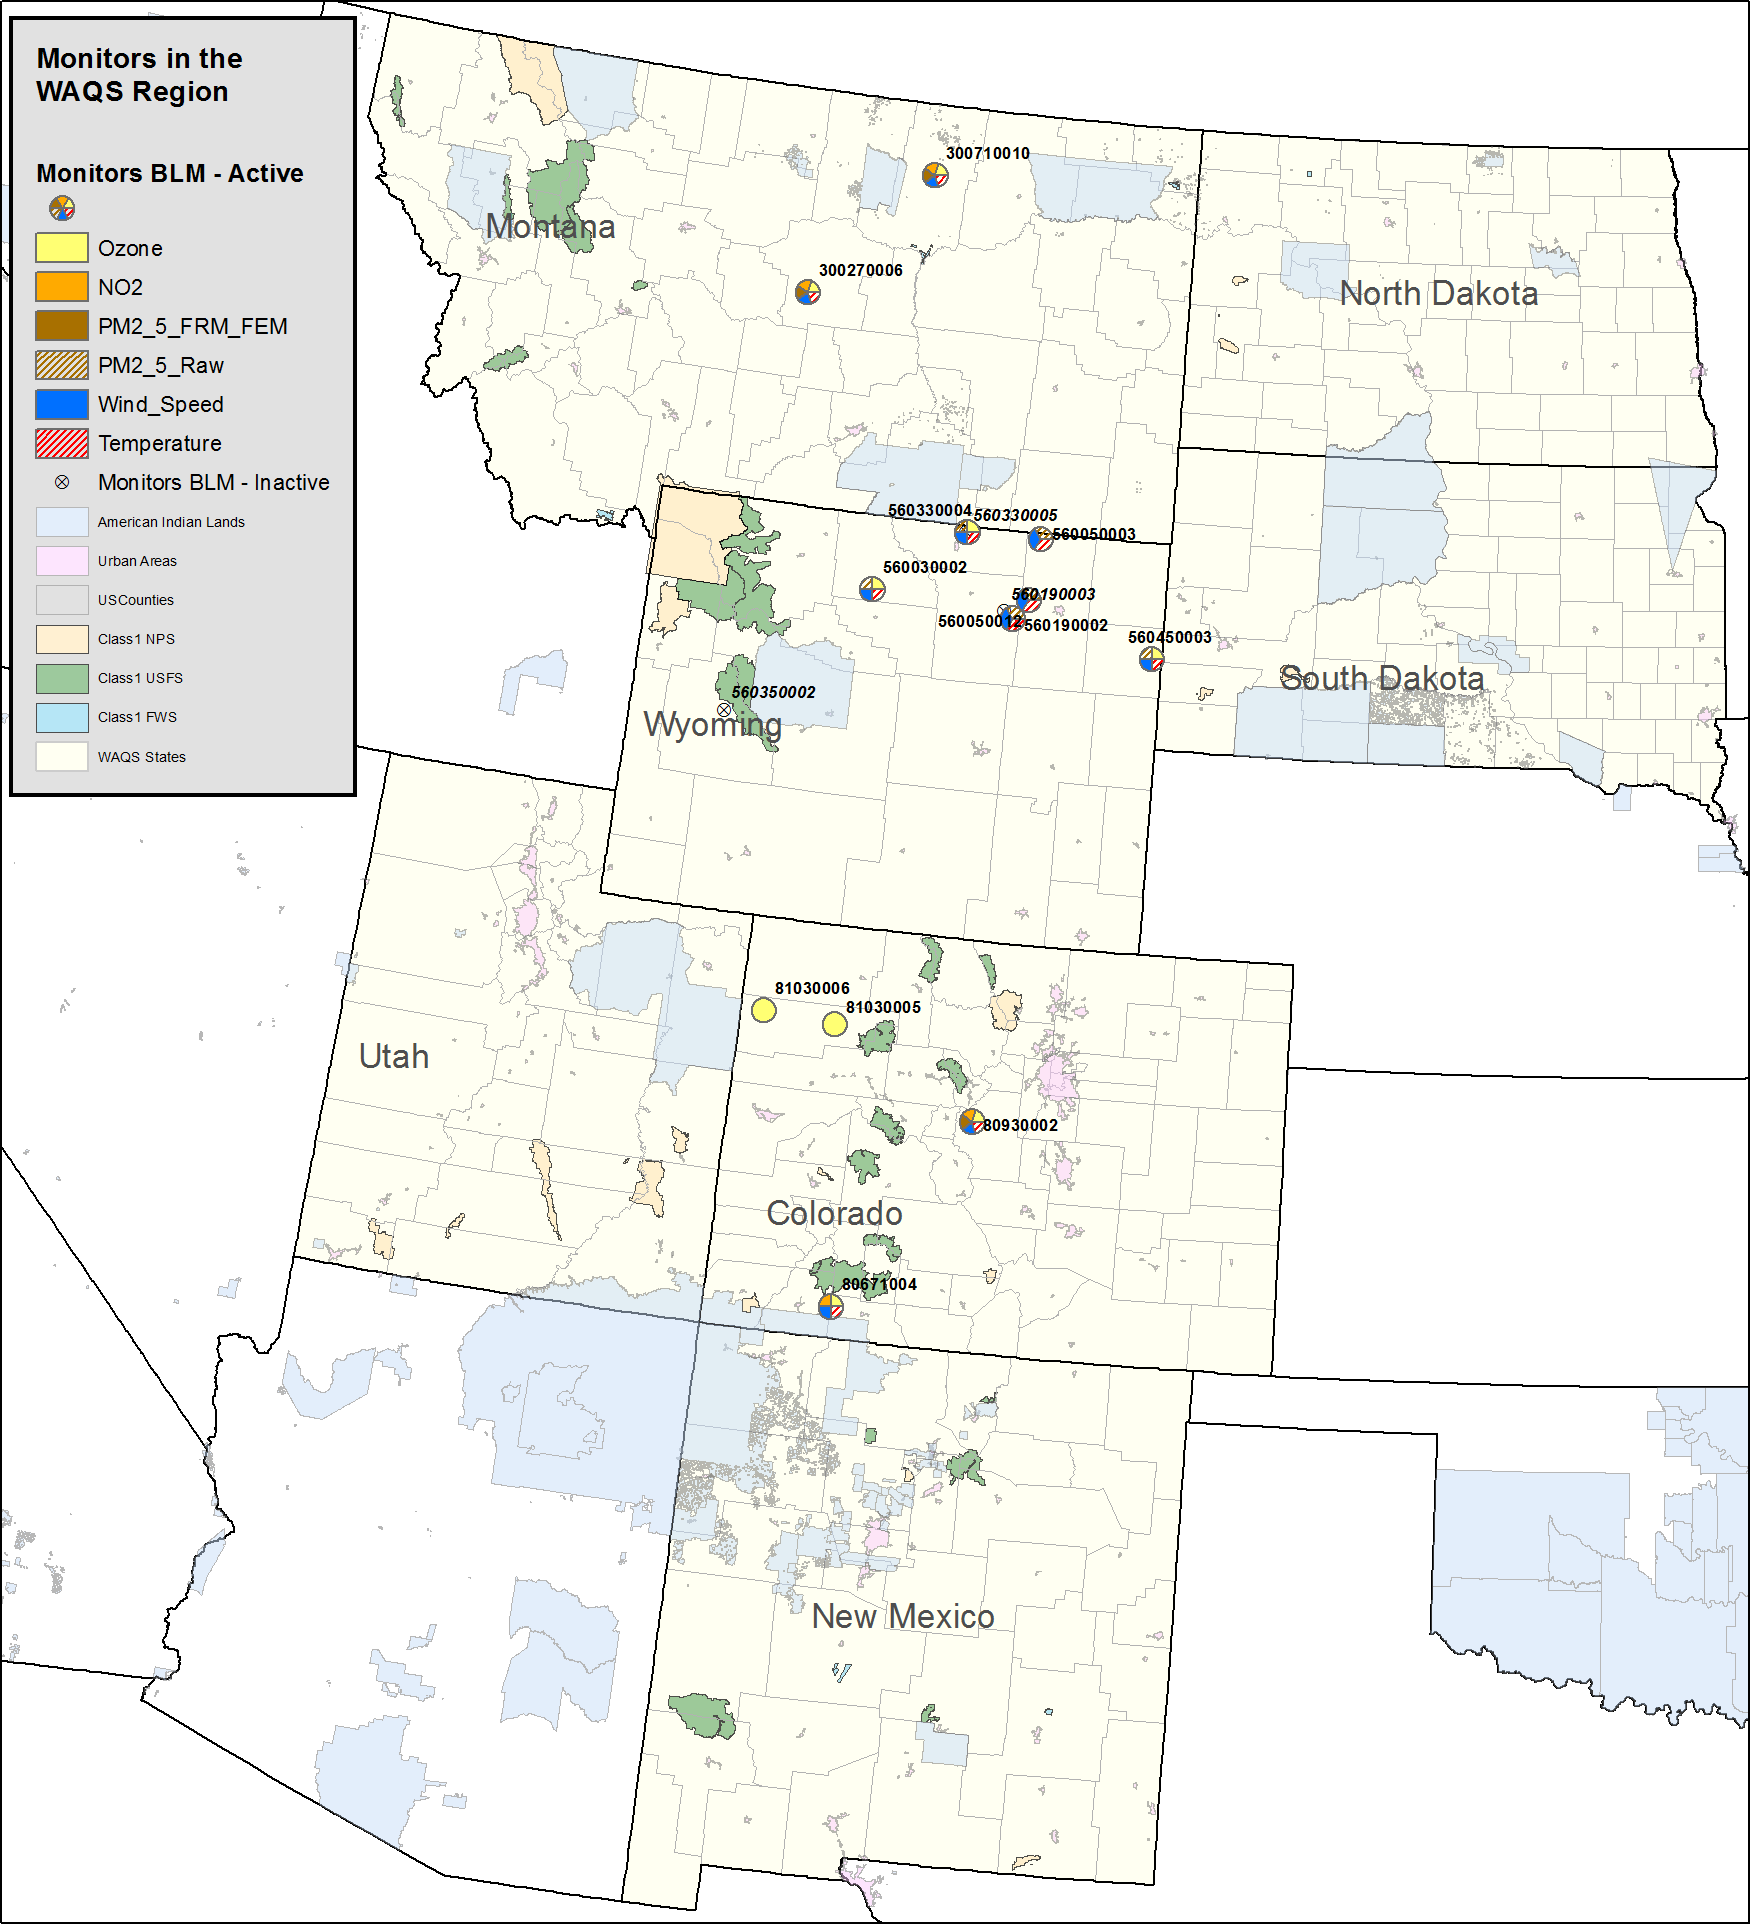
BLM
Colorado-DPHE
Wyoming-DEQ
Utah-DEQ
New Mexico, Albuquerque DEQ
Montana-DEQ
Dakotas
Other (N/A)
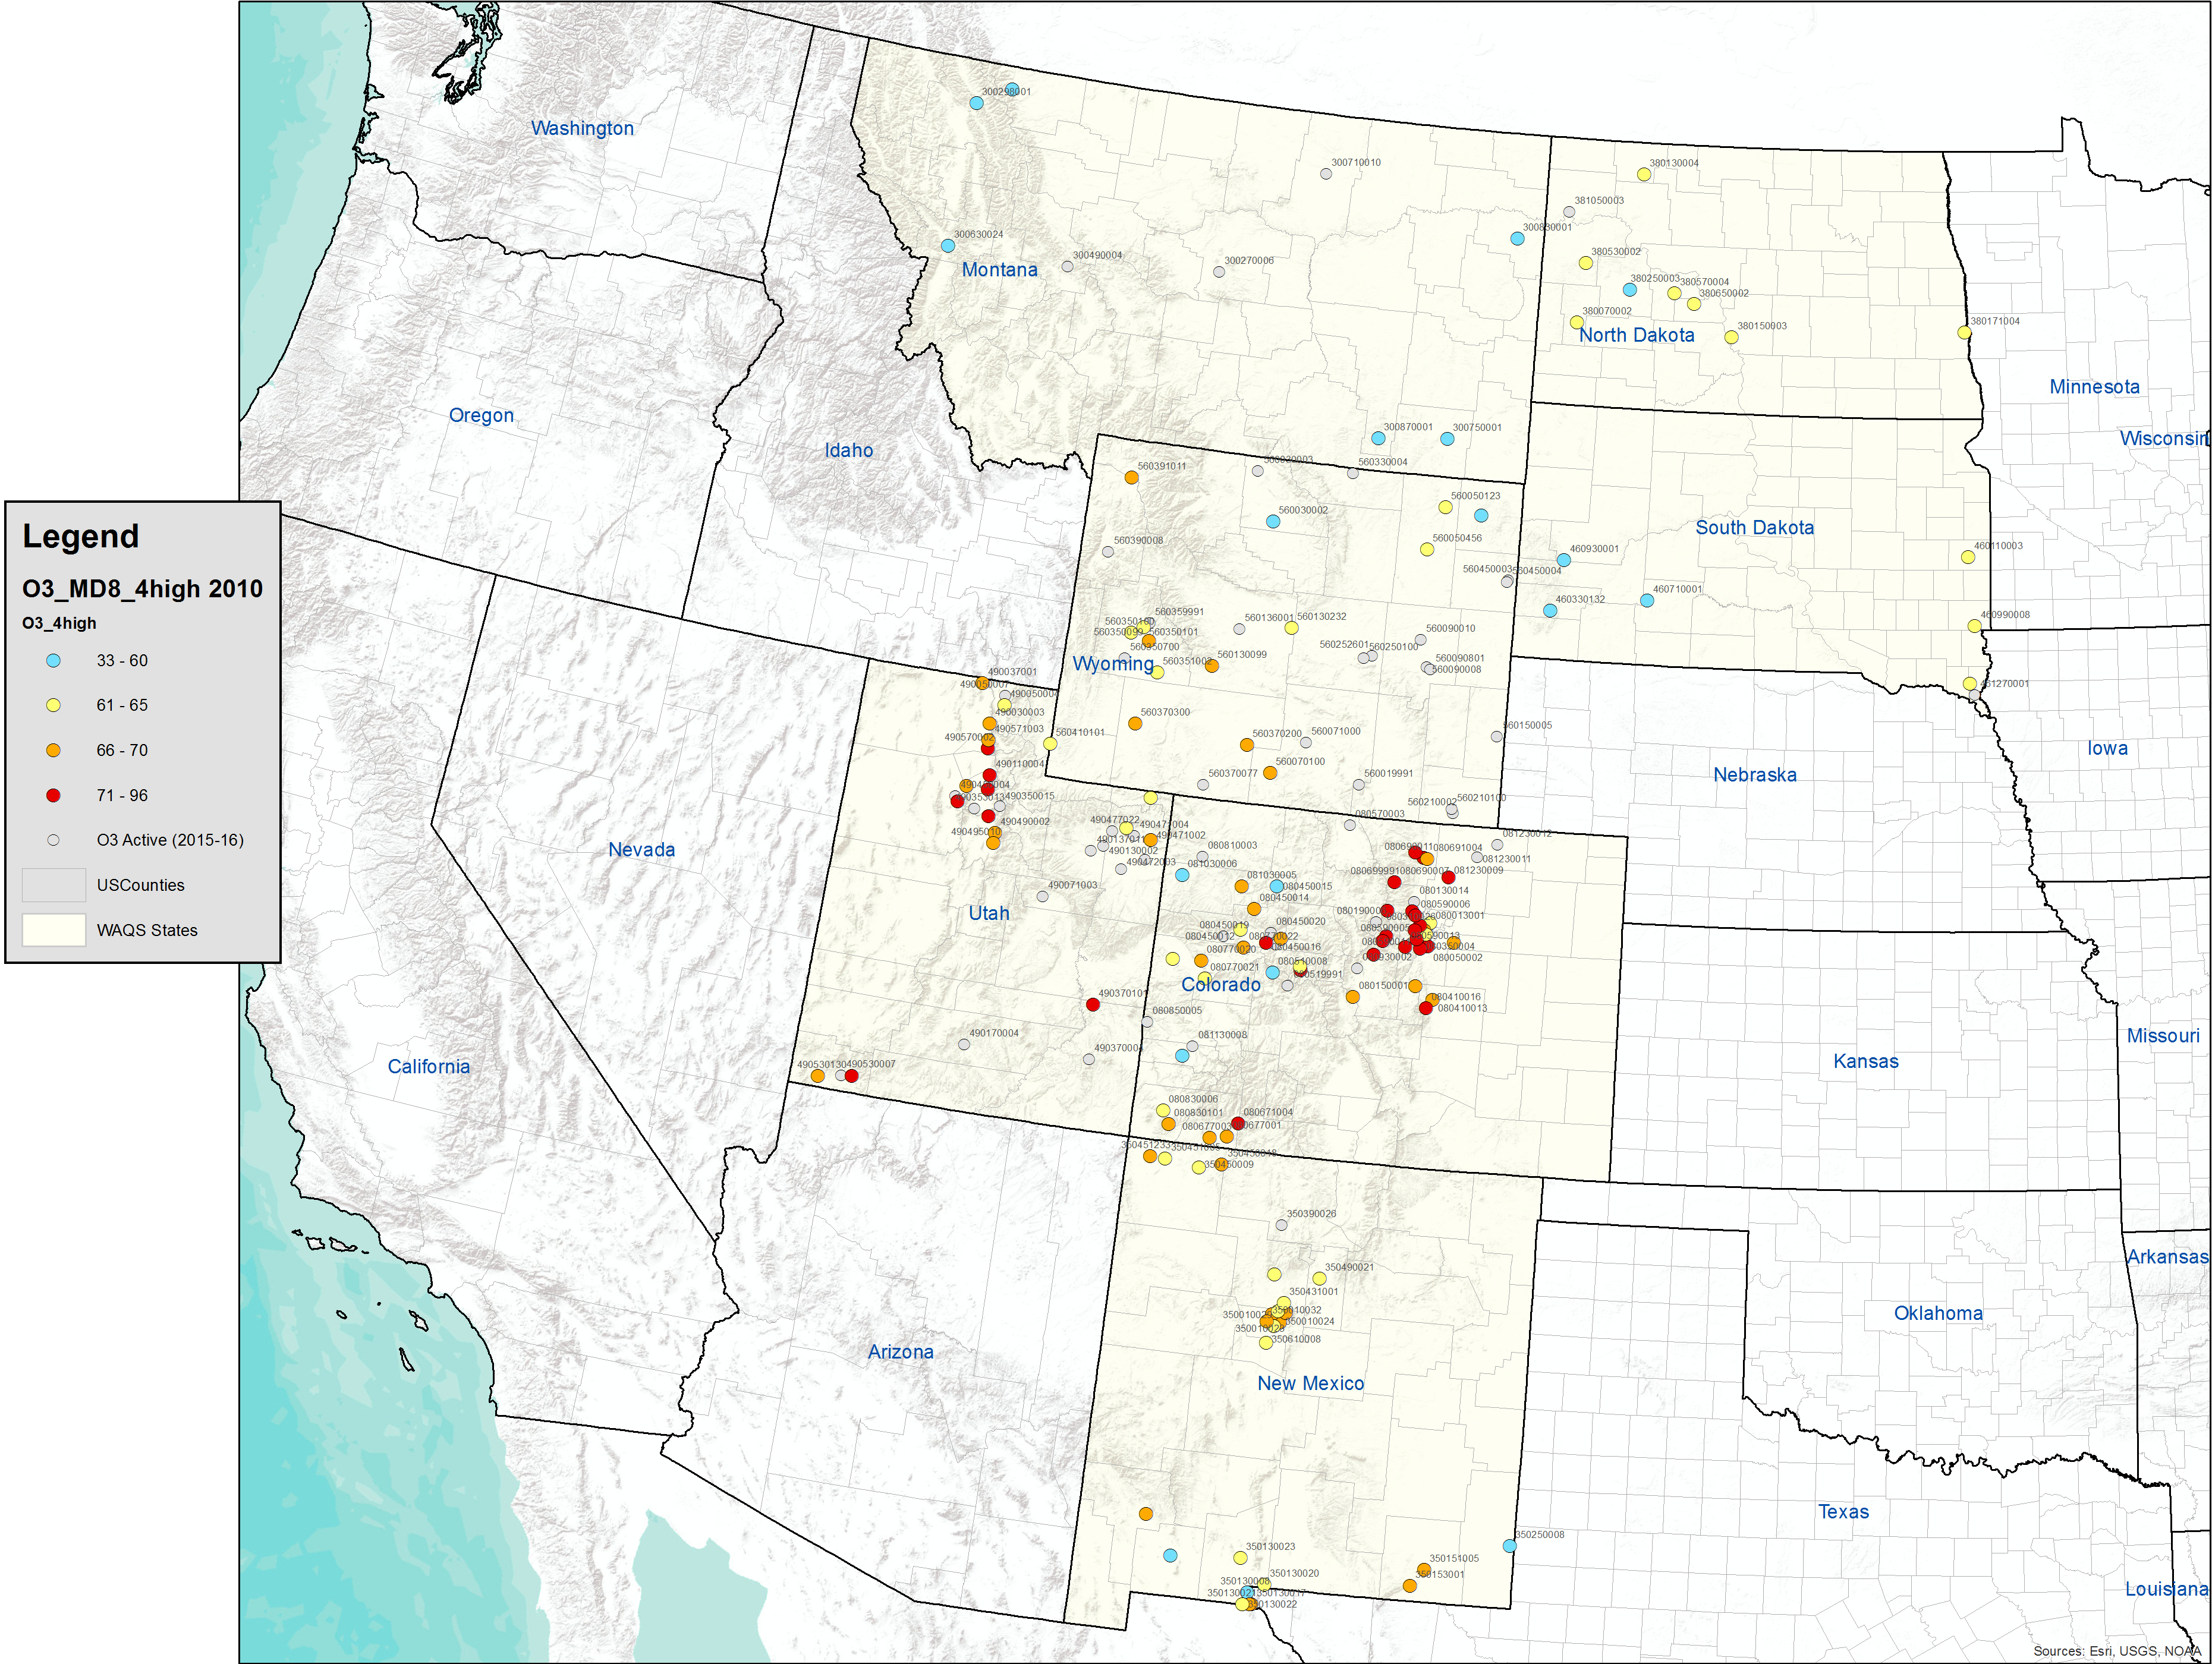
Current Conditions
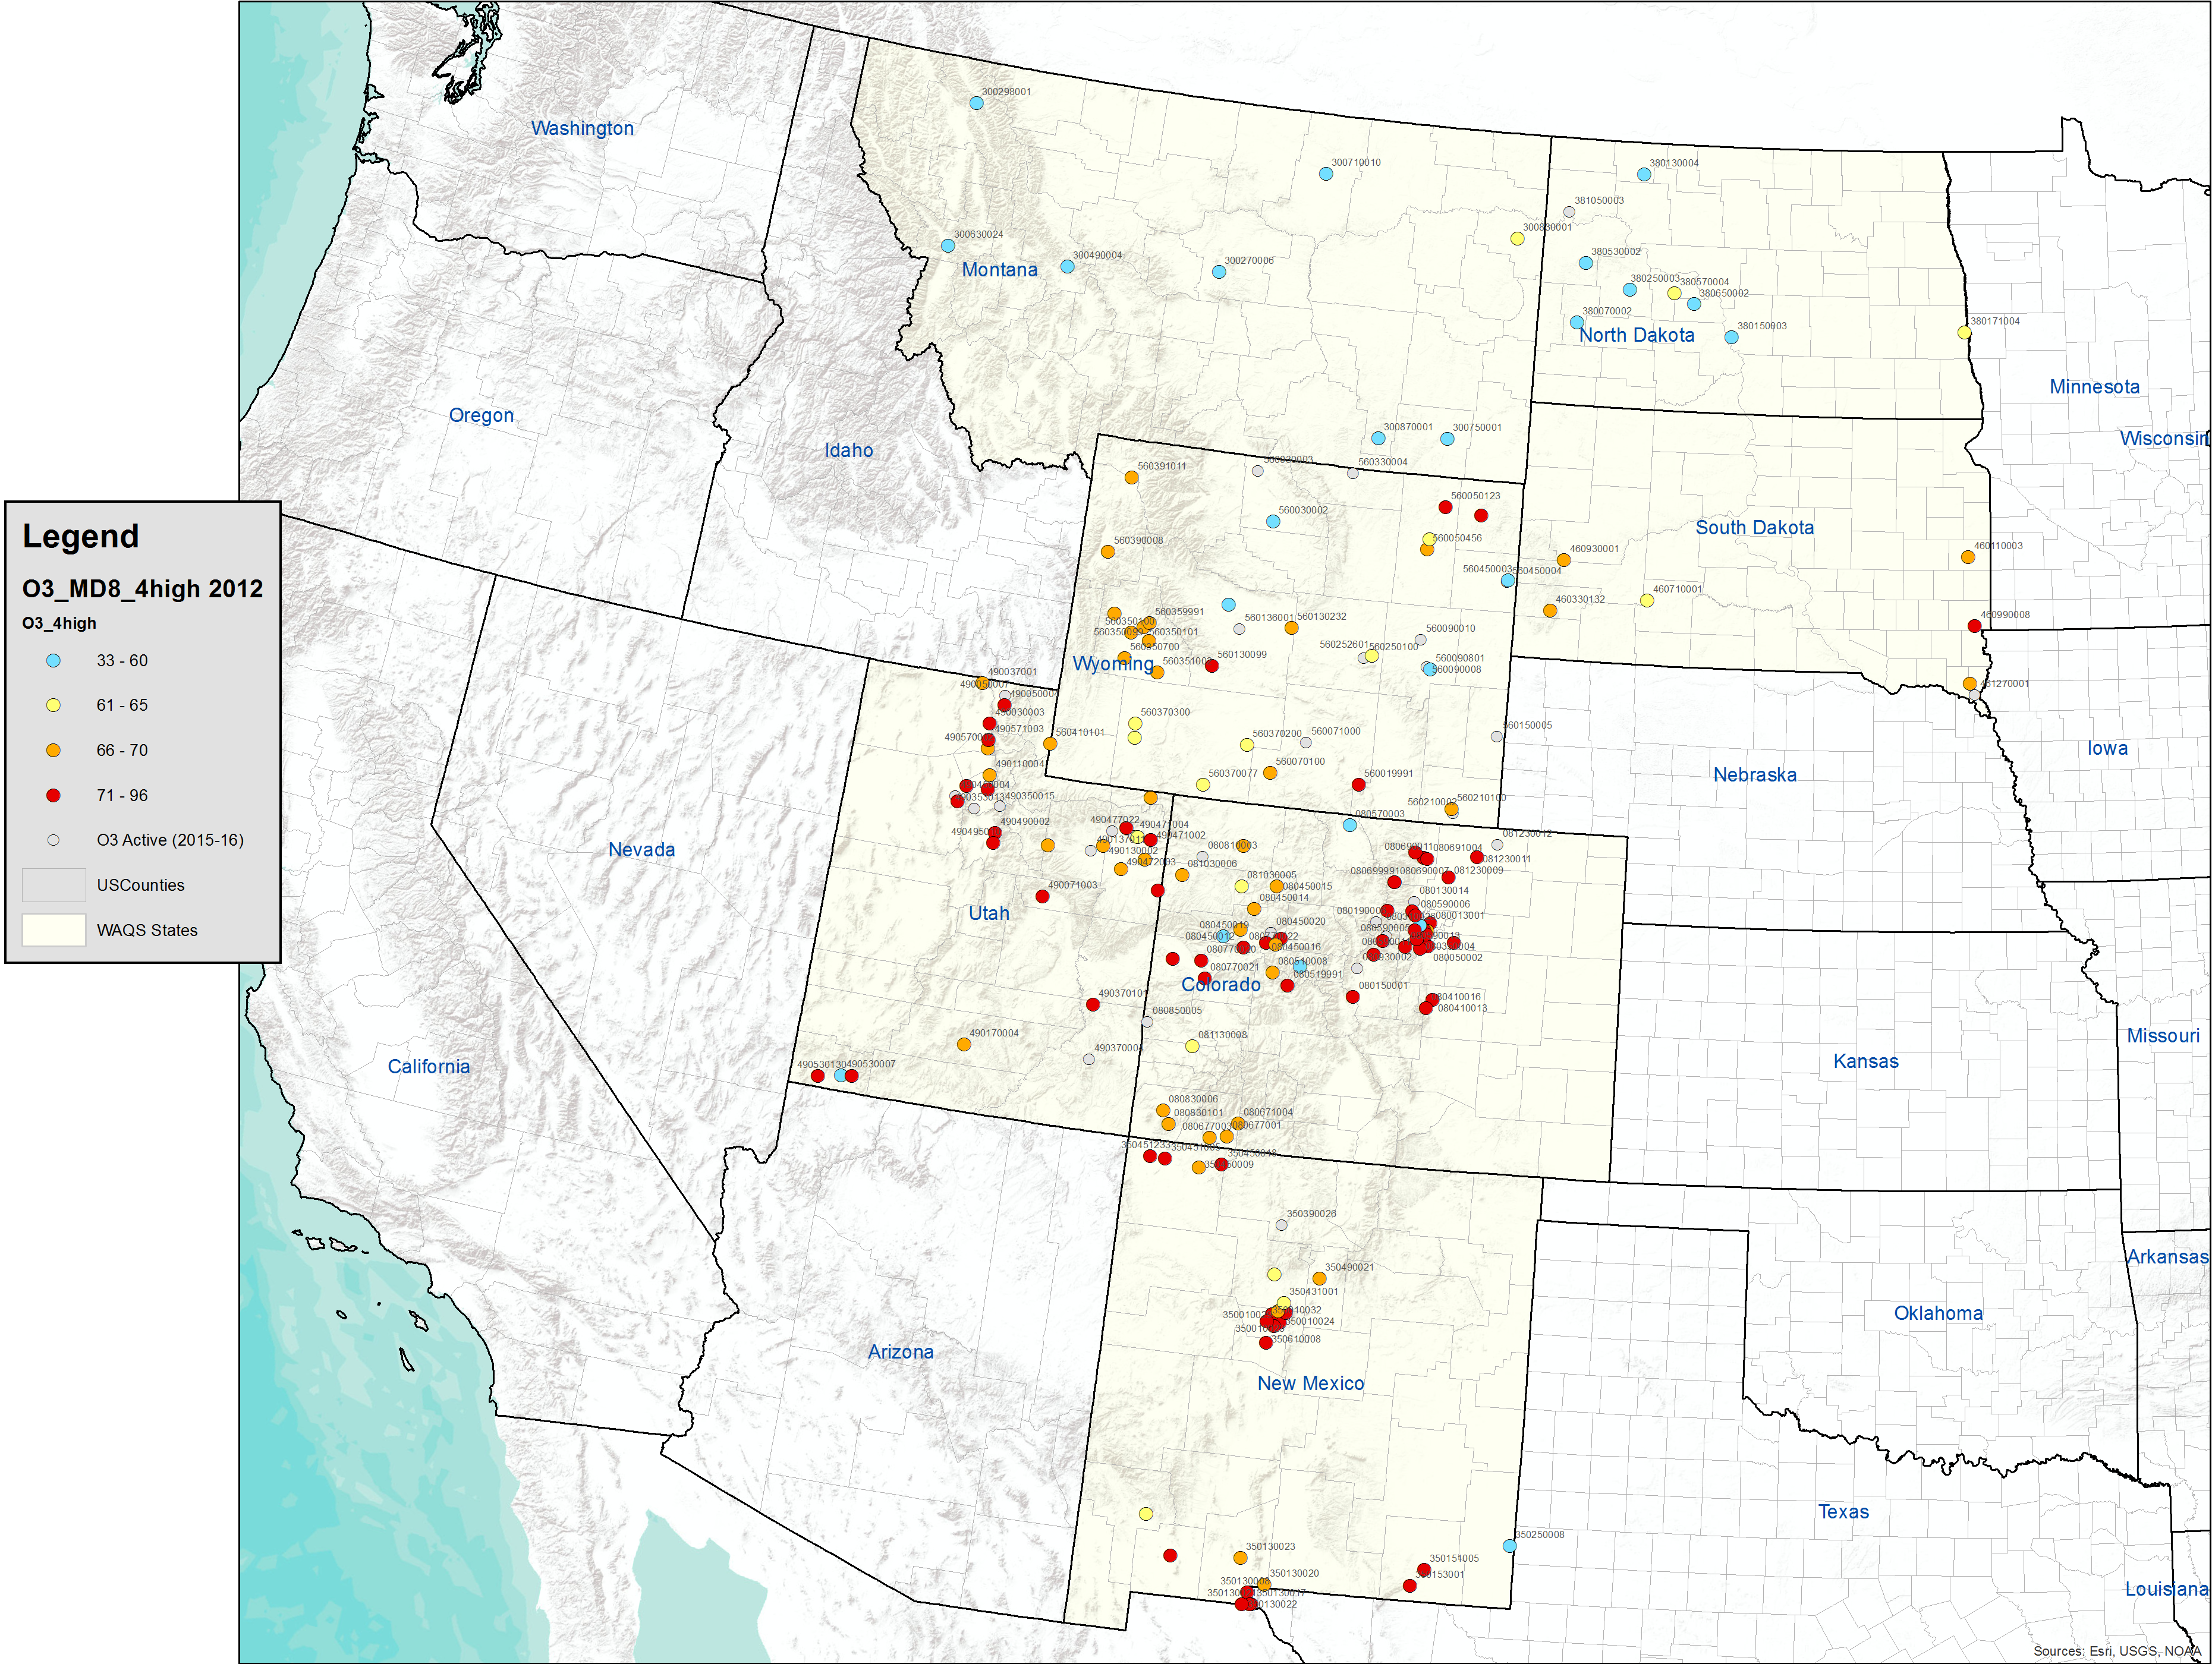
4th Highest Maximum Daily 8-hour average (MD8). Calculated in the WAQS MNA using EPA's 8-hour average data (2016-12-23 AQS update2)2010 2011 2012 2013 2014 2015
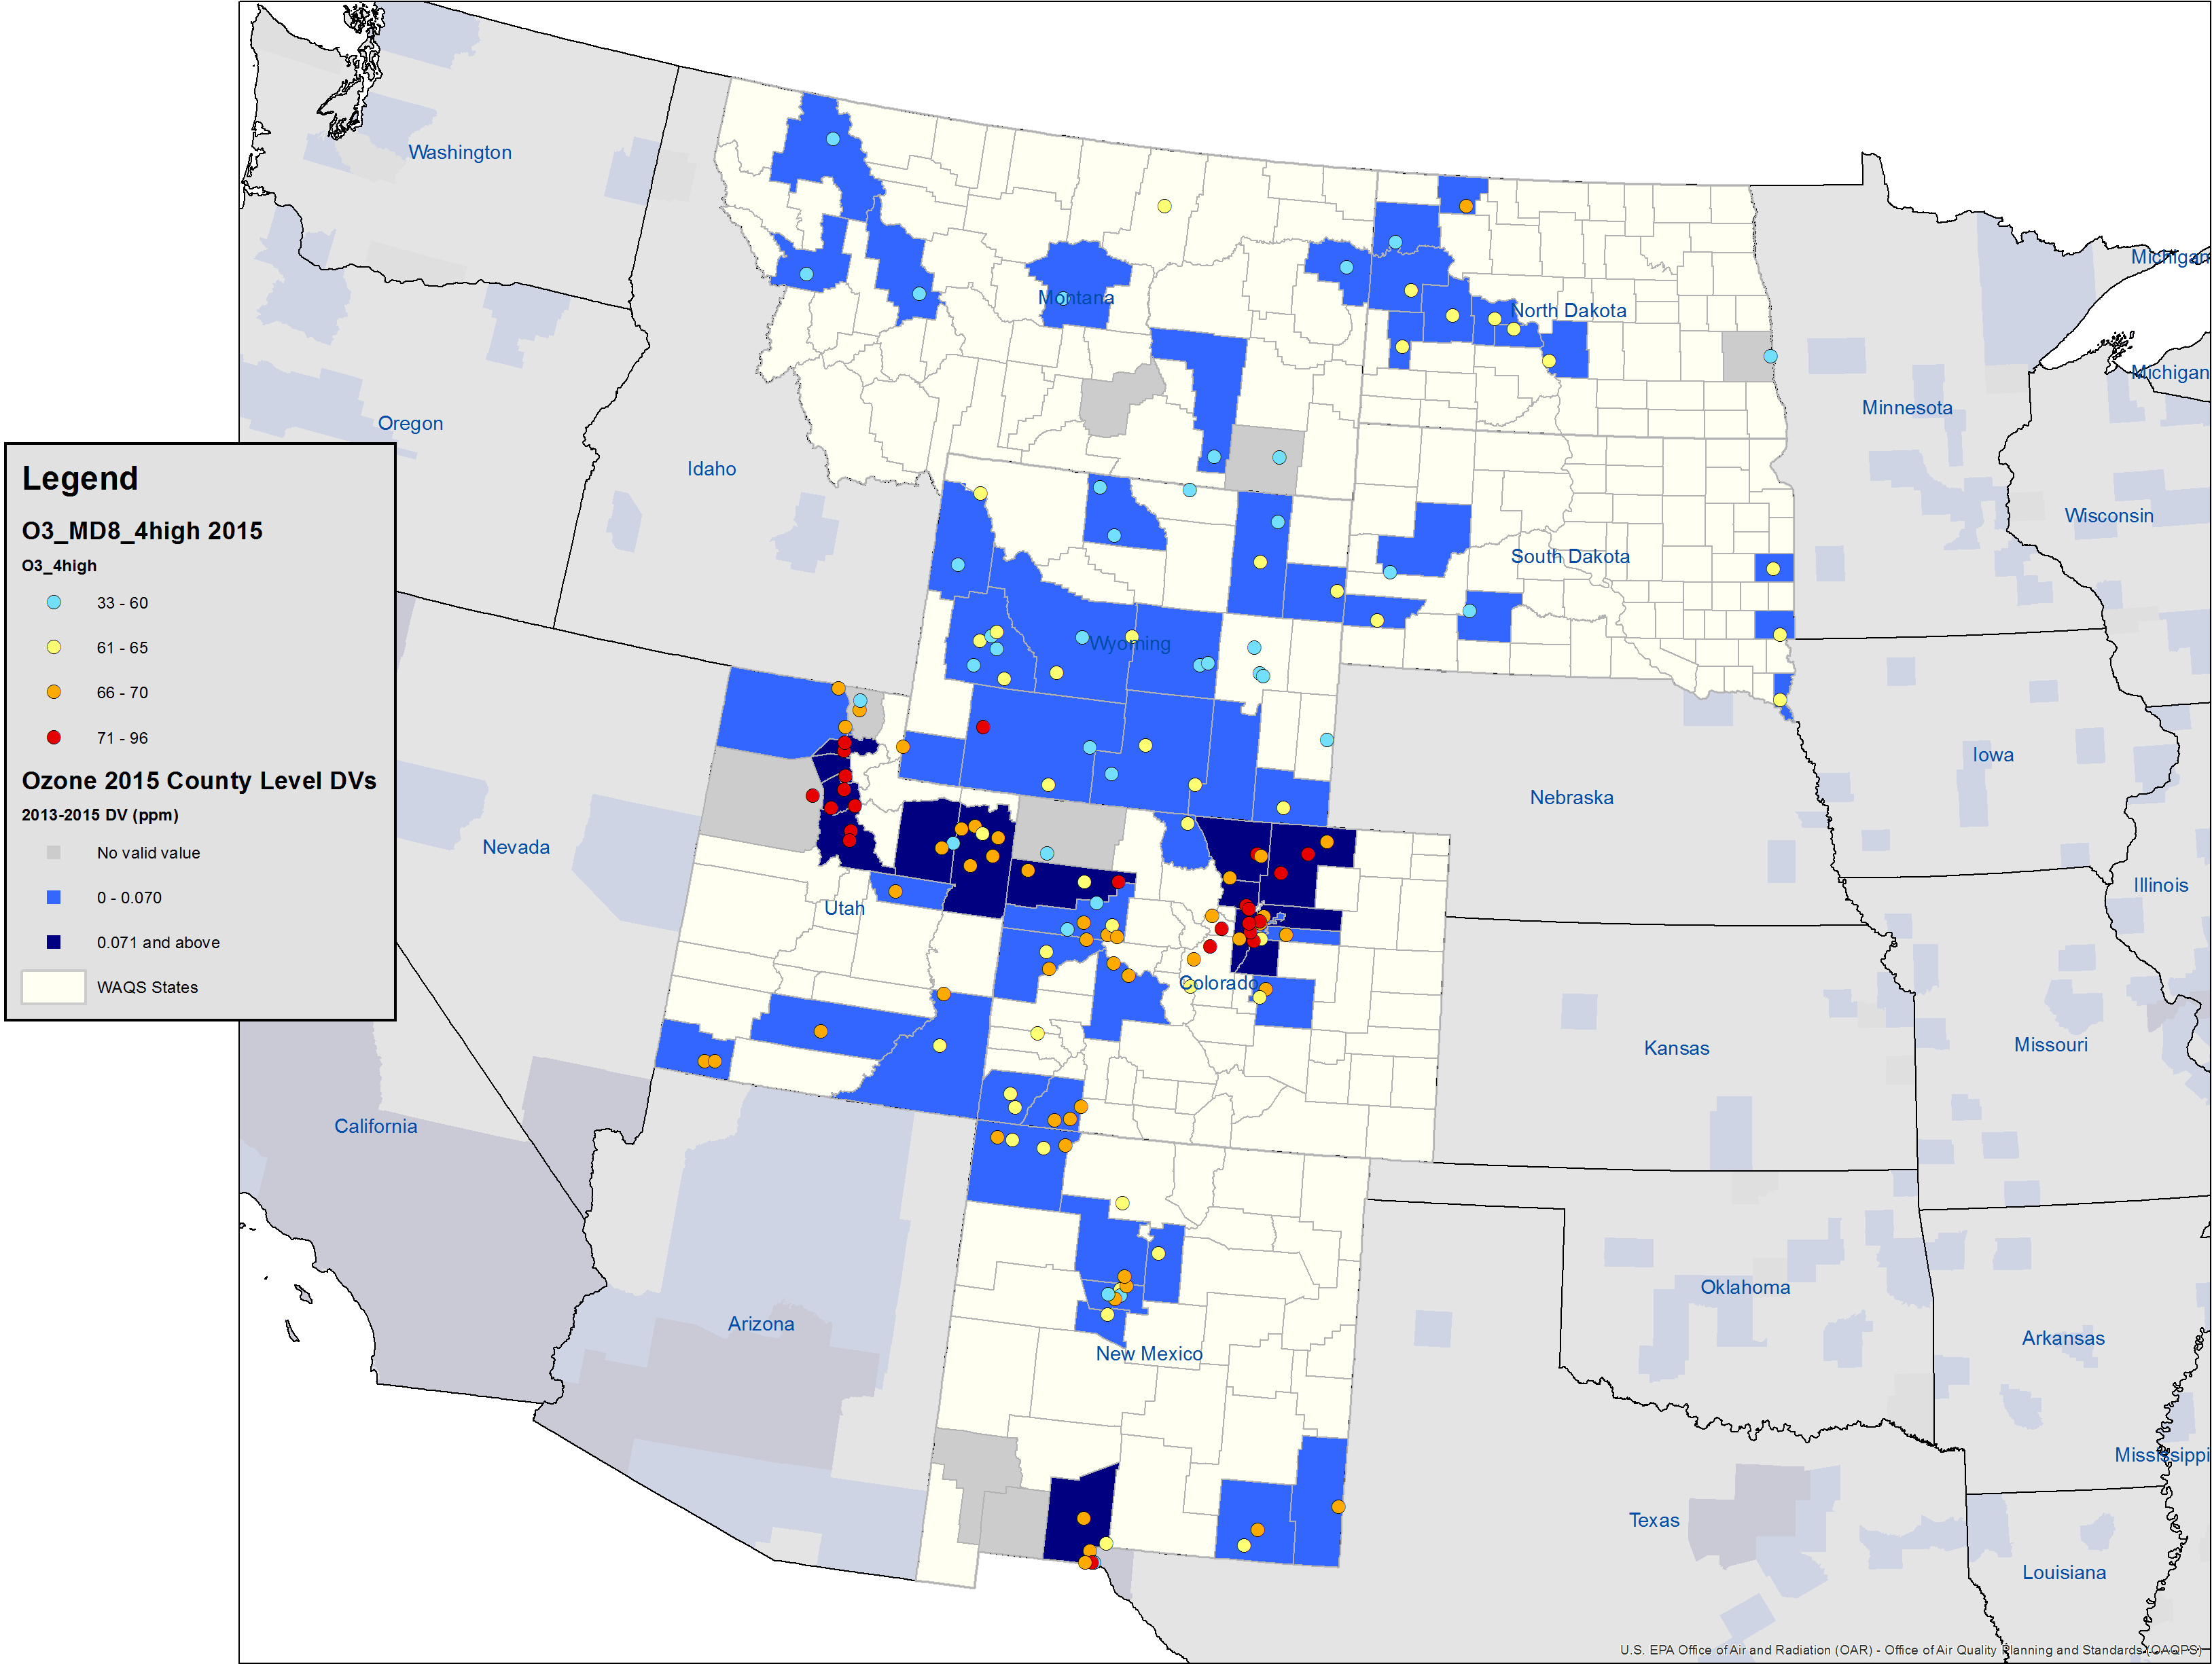
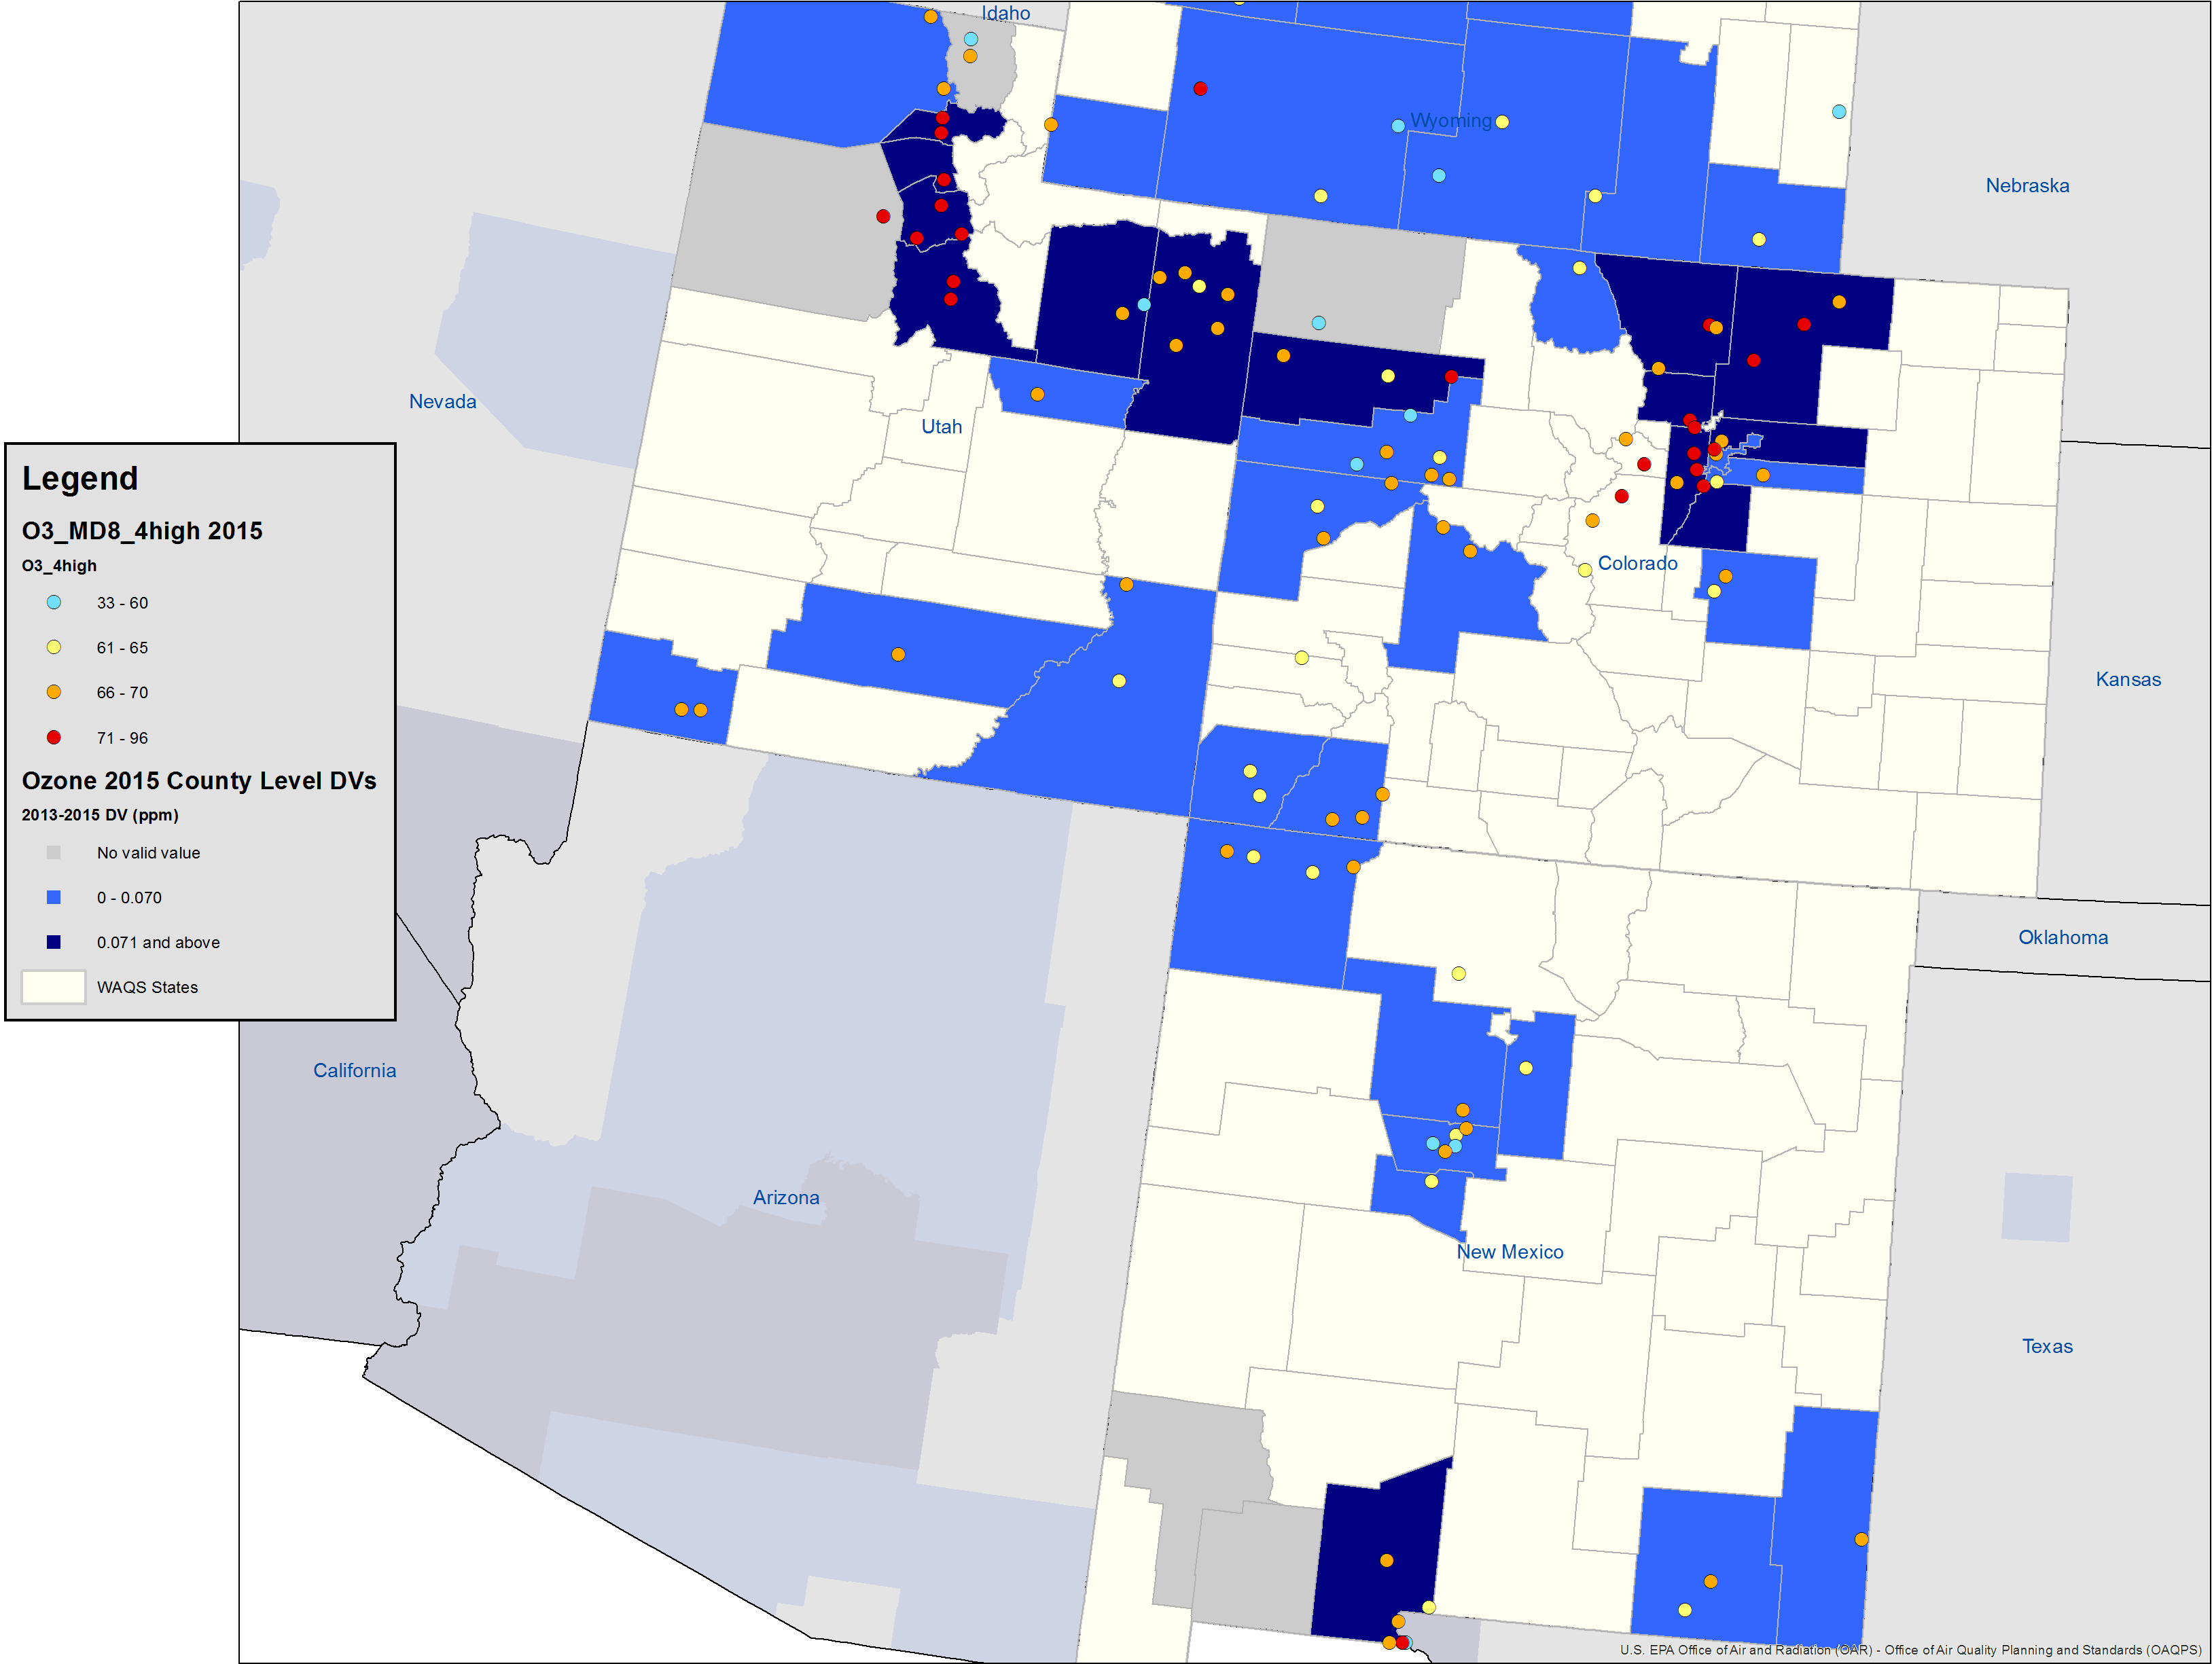
2013-2015 County Level DVs3 (overlaid with Site Level 2015 O3MD8s from WAQS MNA)
O3 MD8
O3 MD8 zoom to show counties with monitor(s) > 70ppb
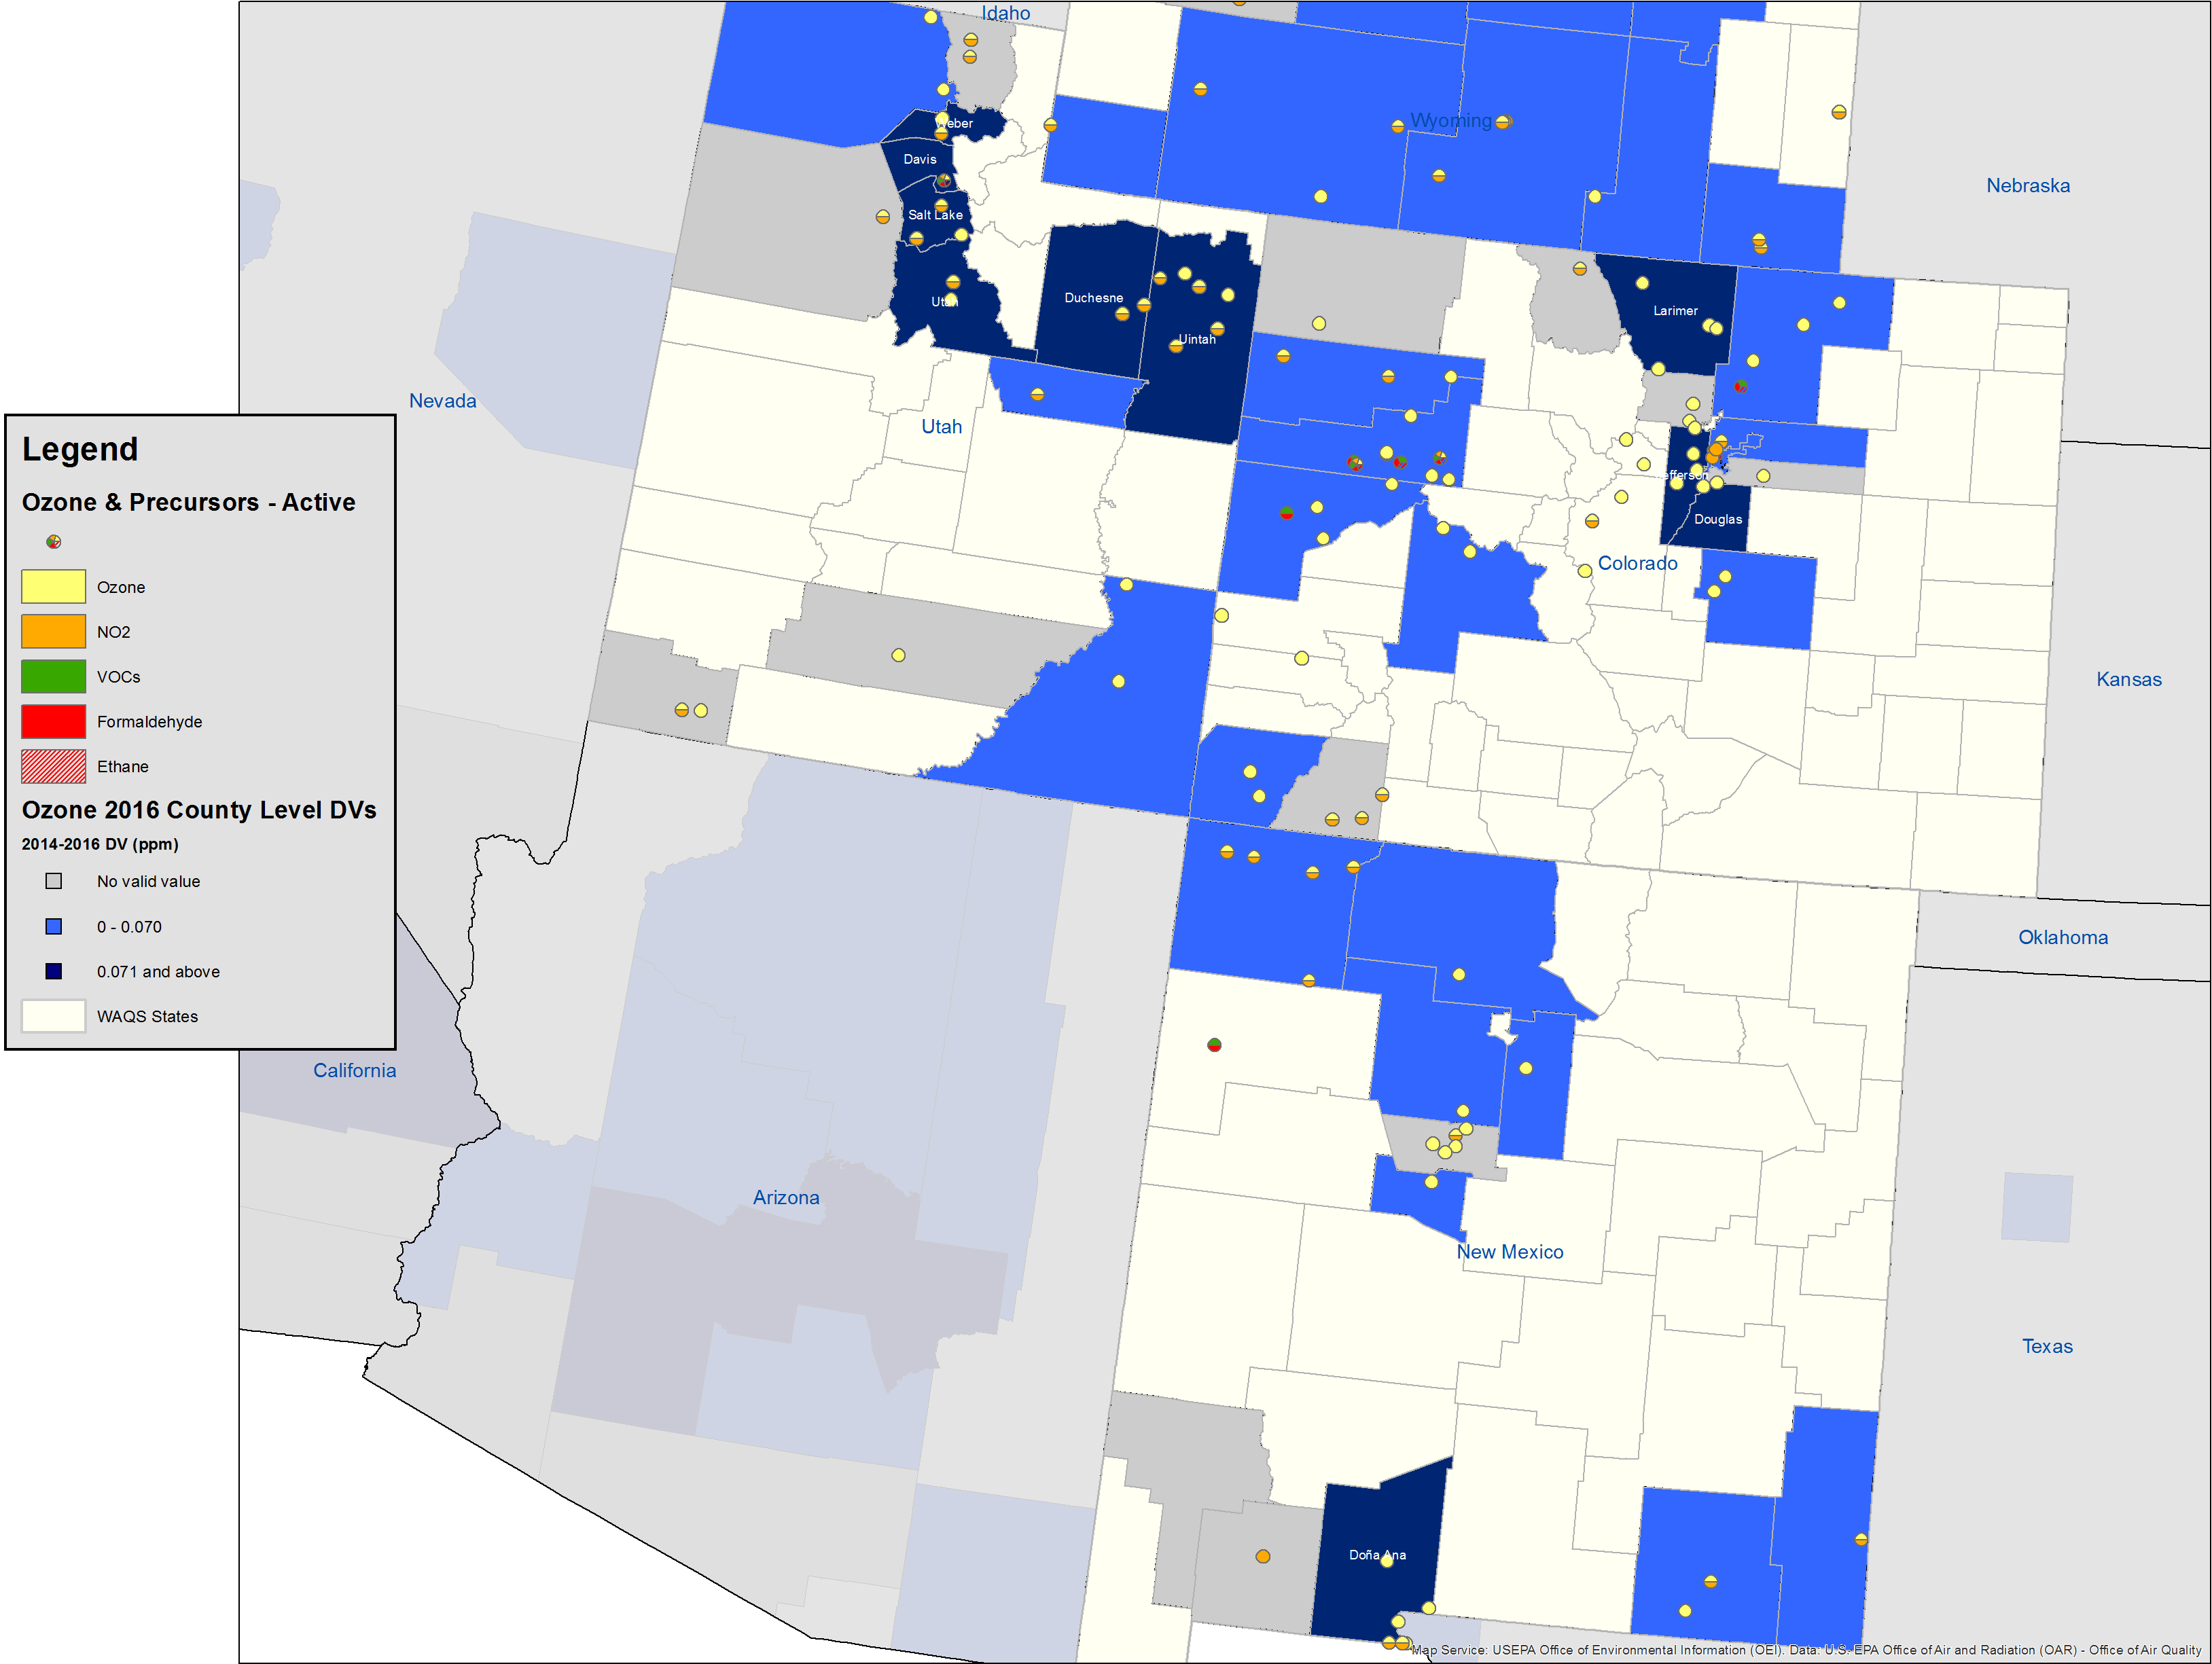
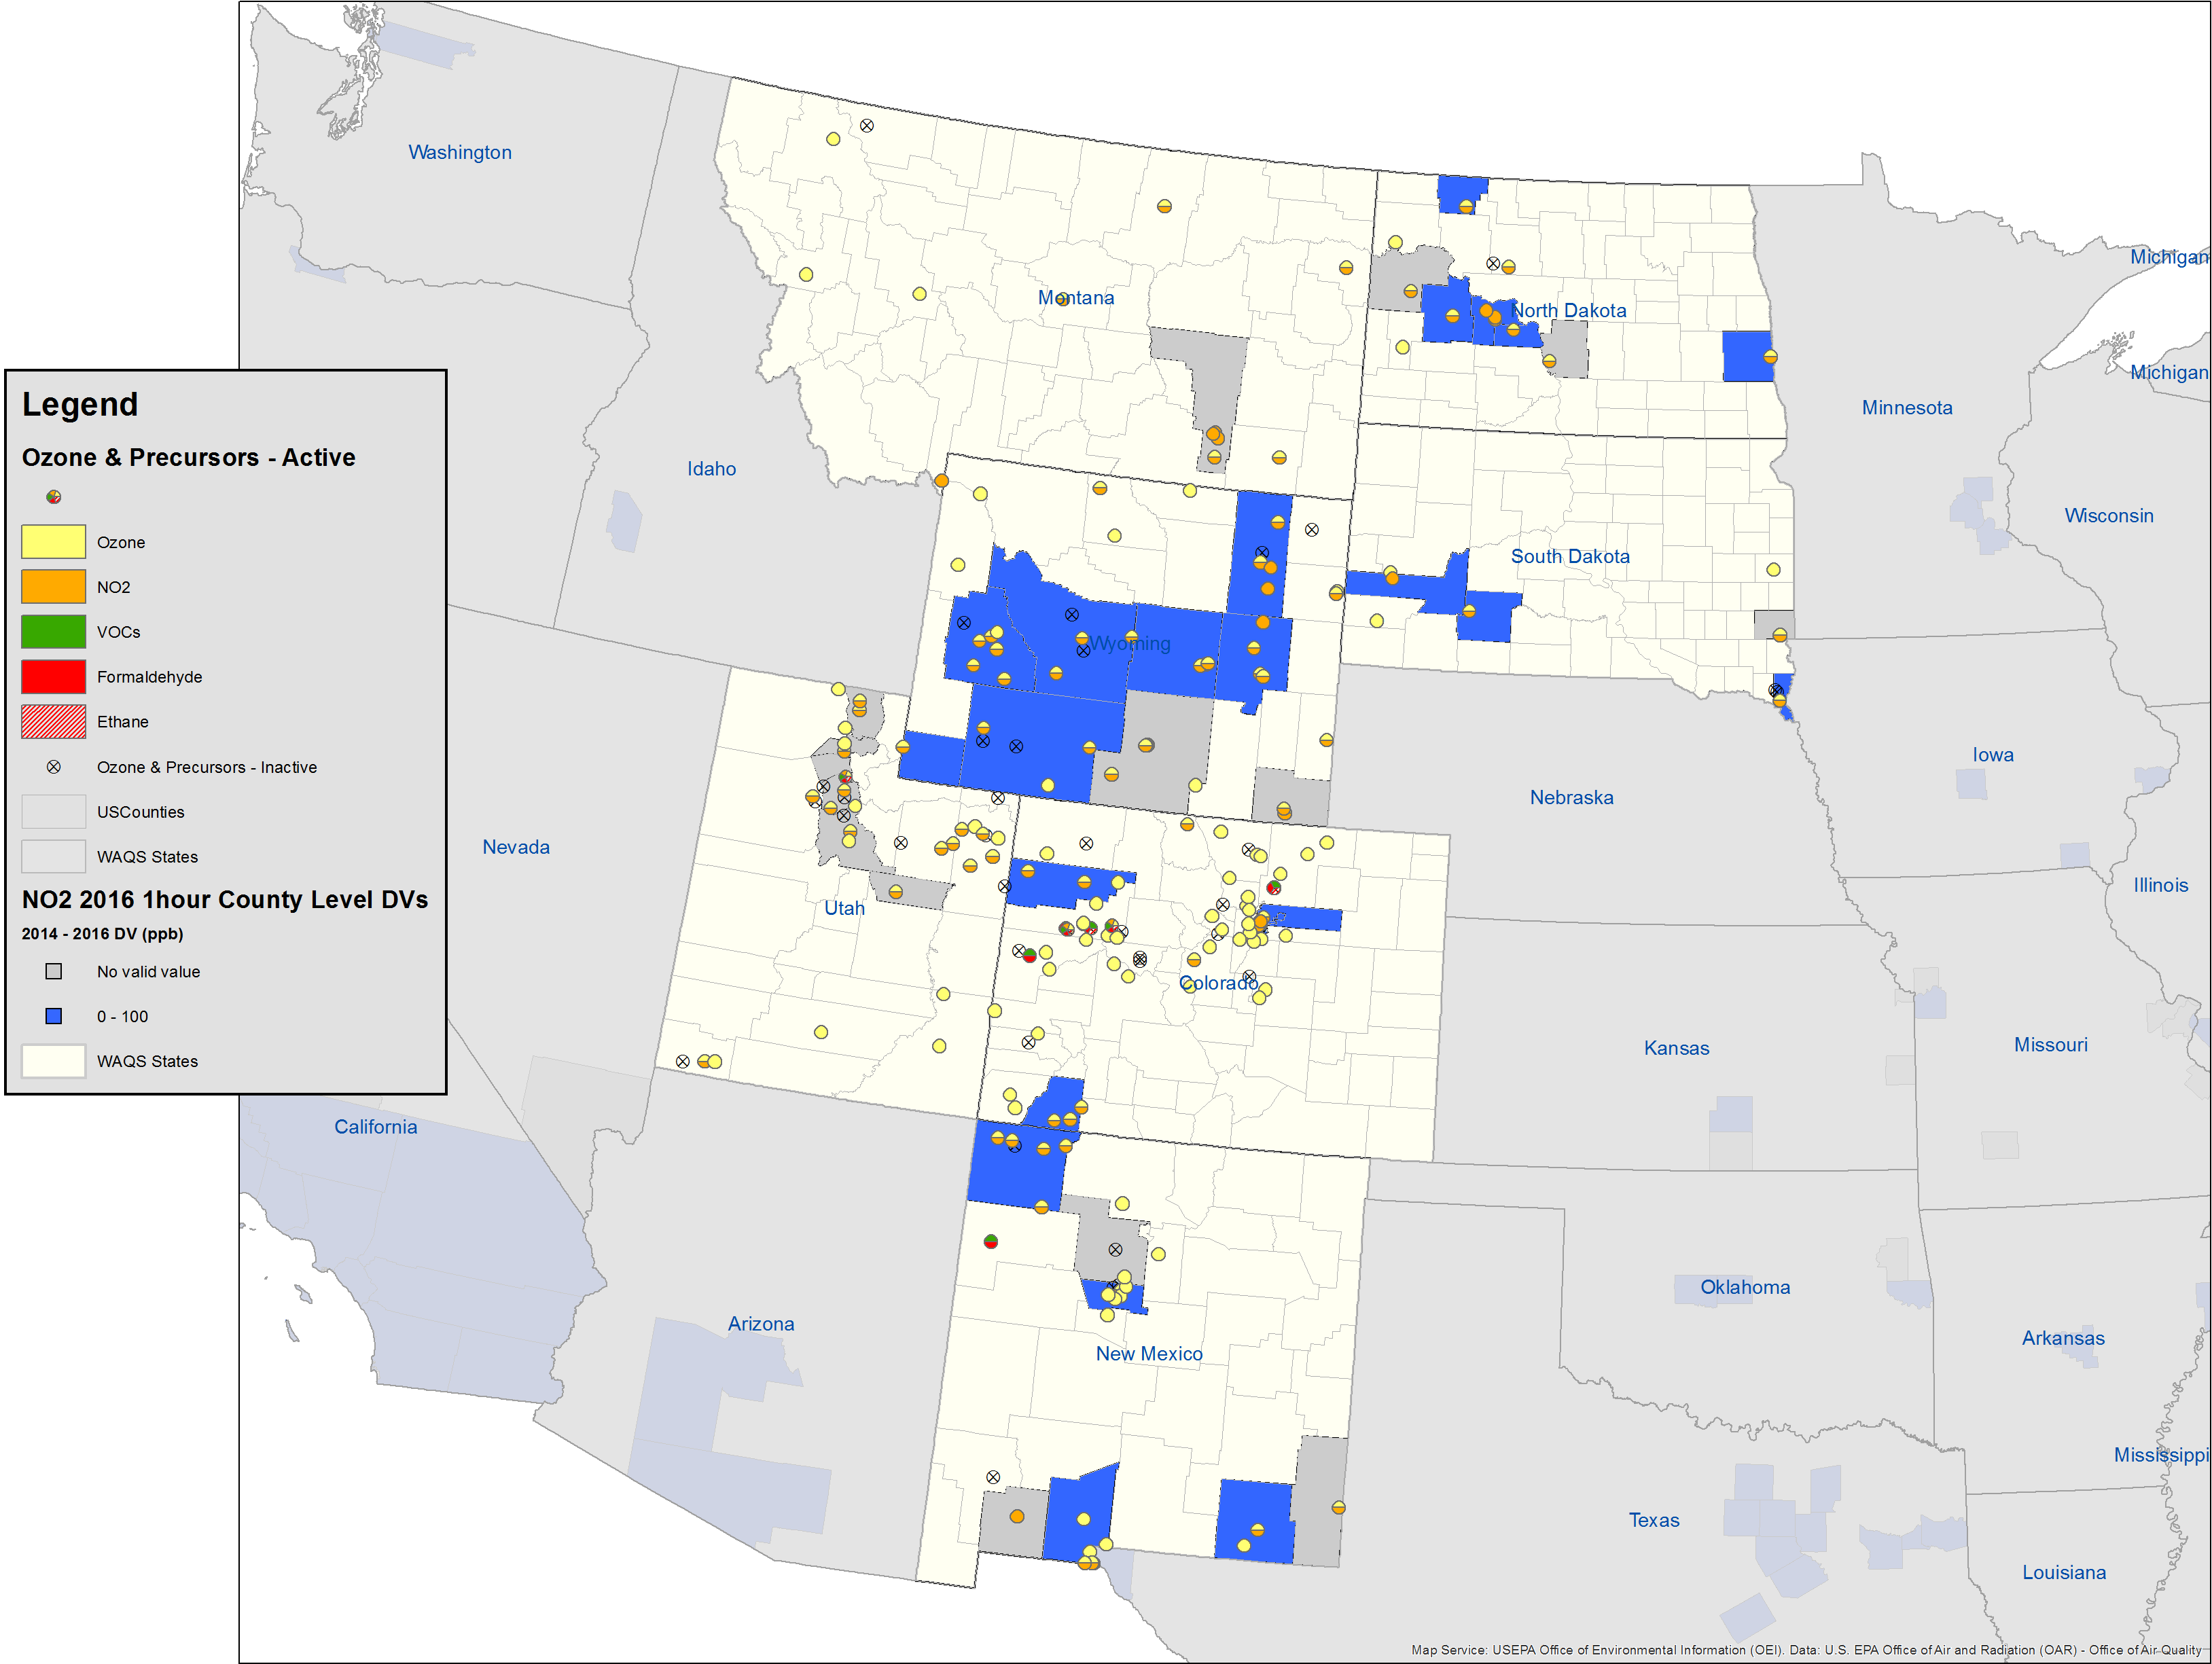
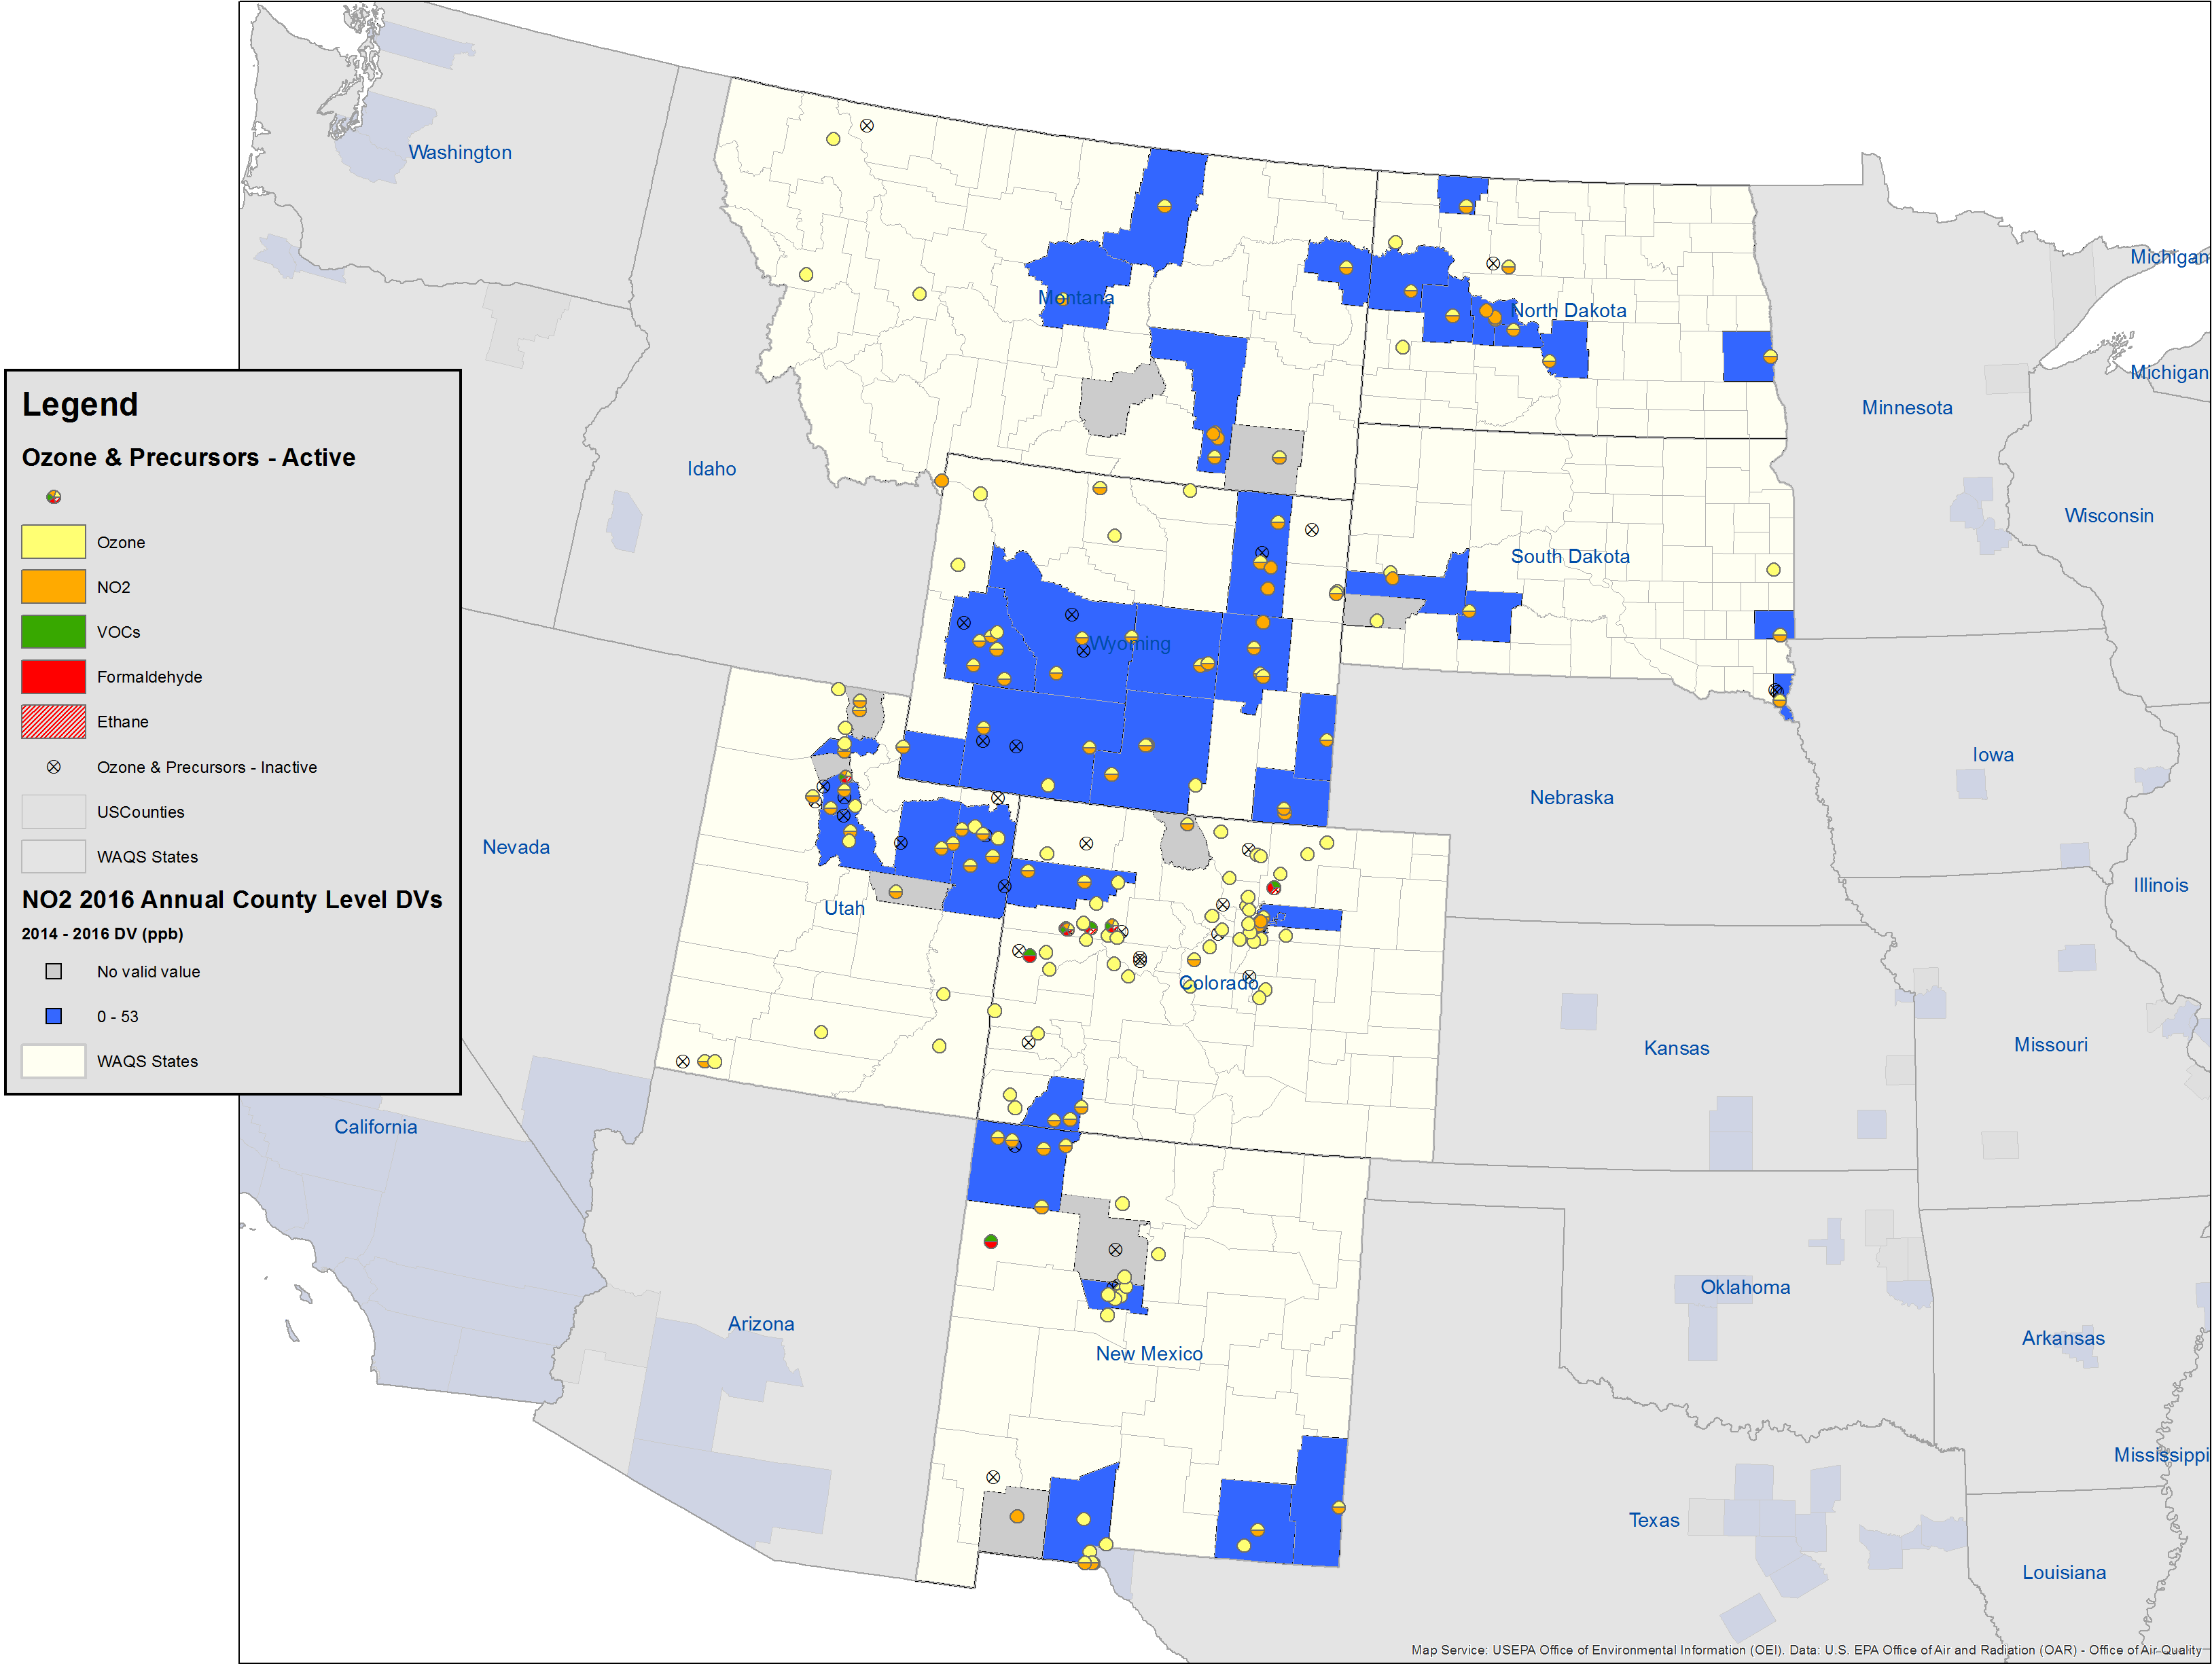
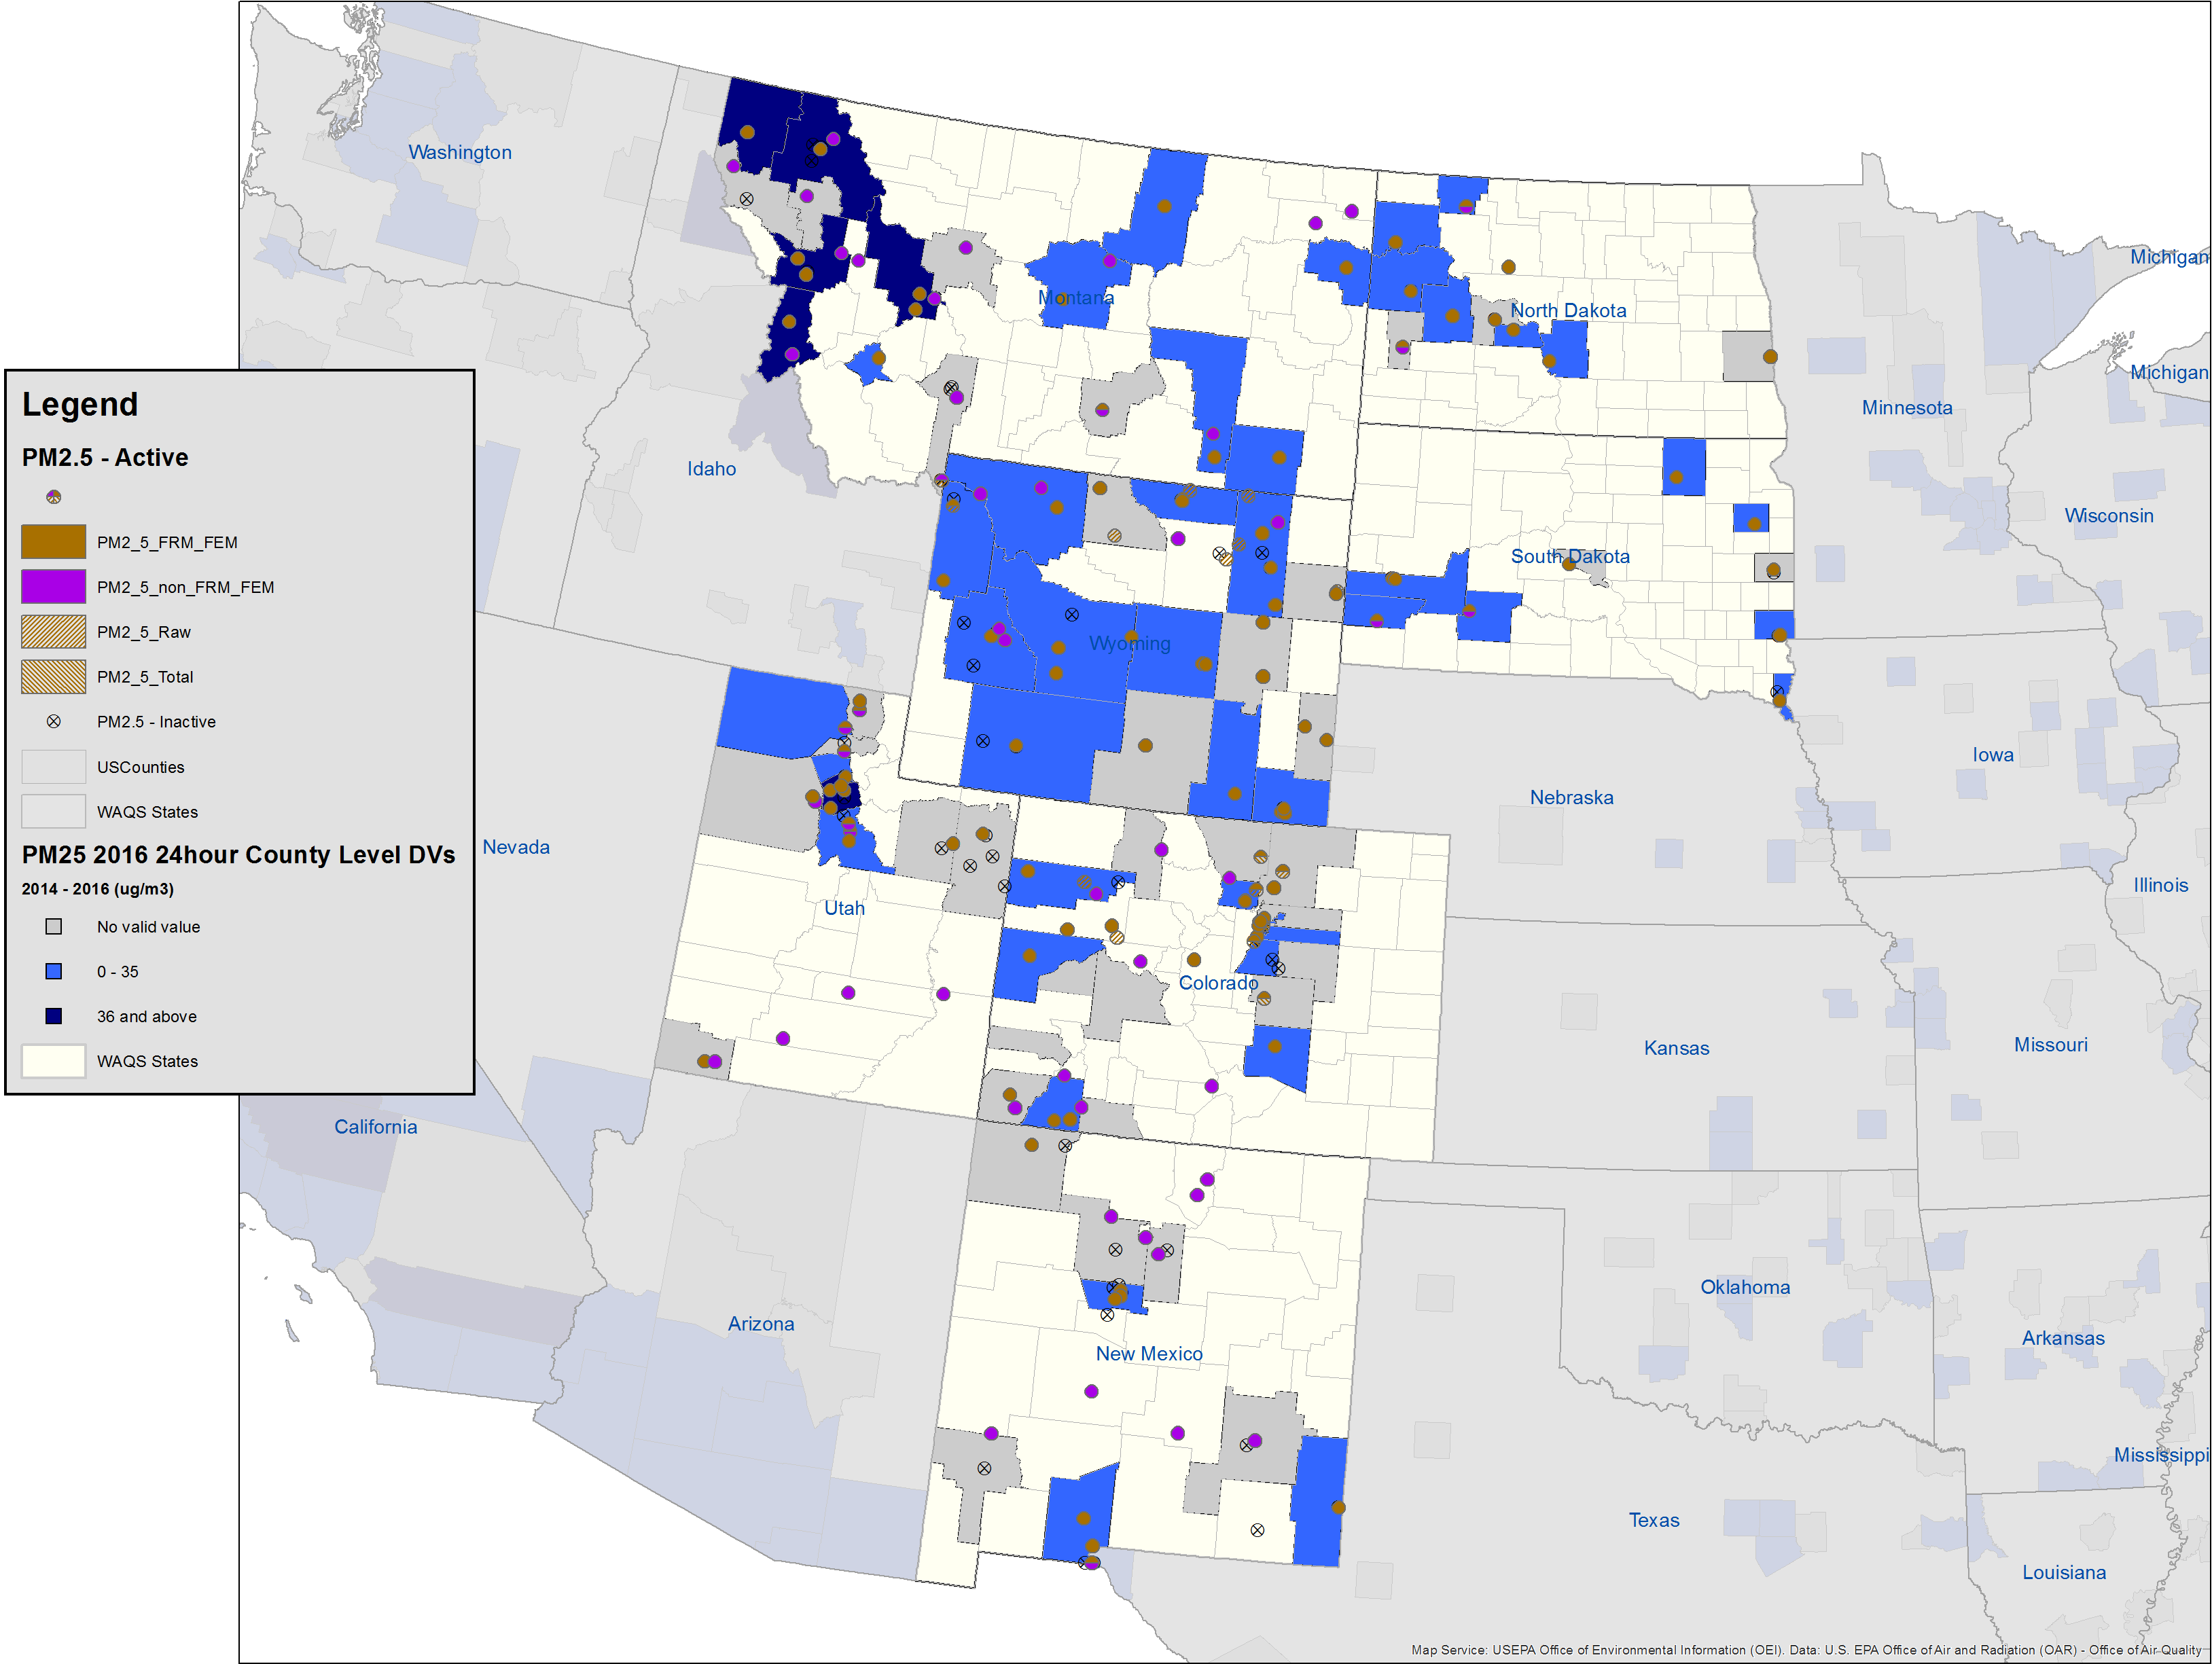
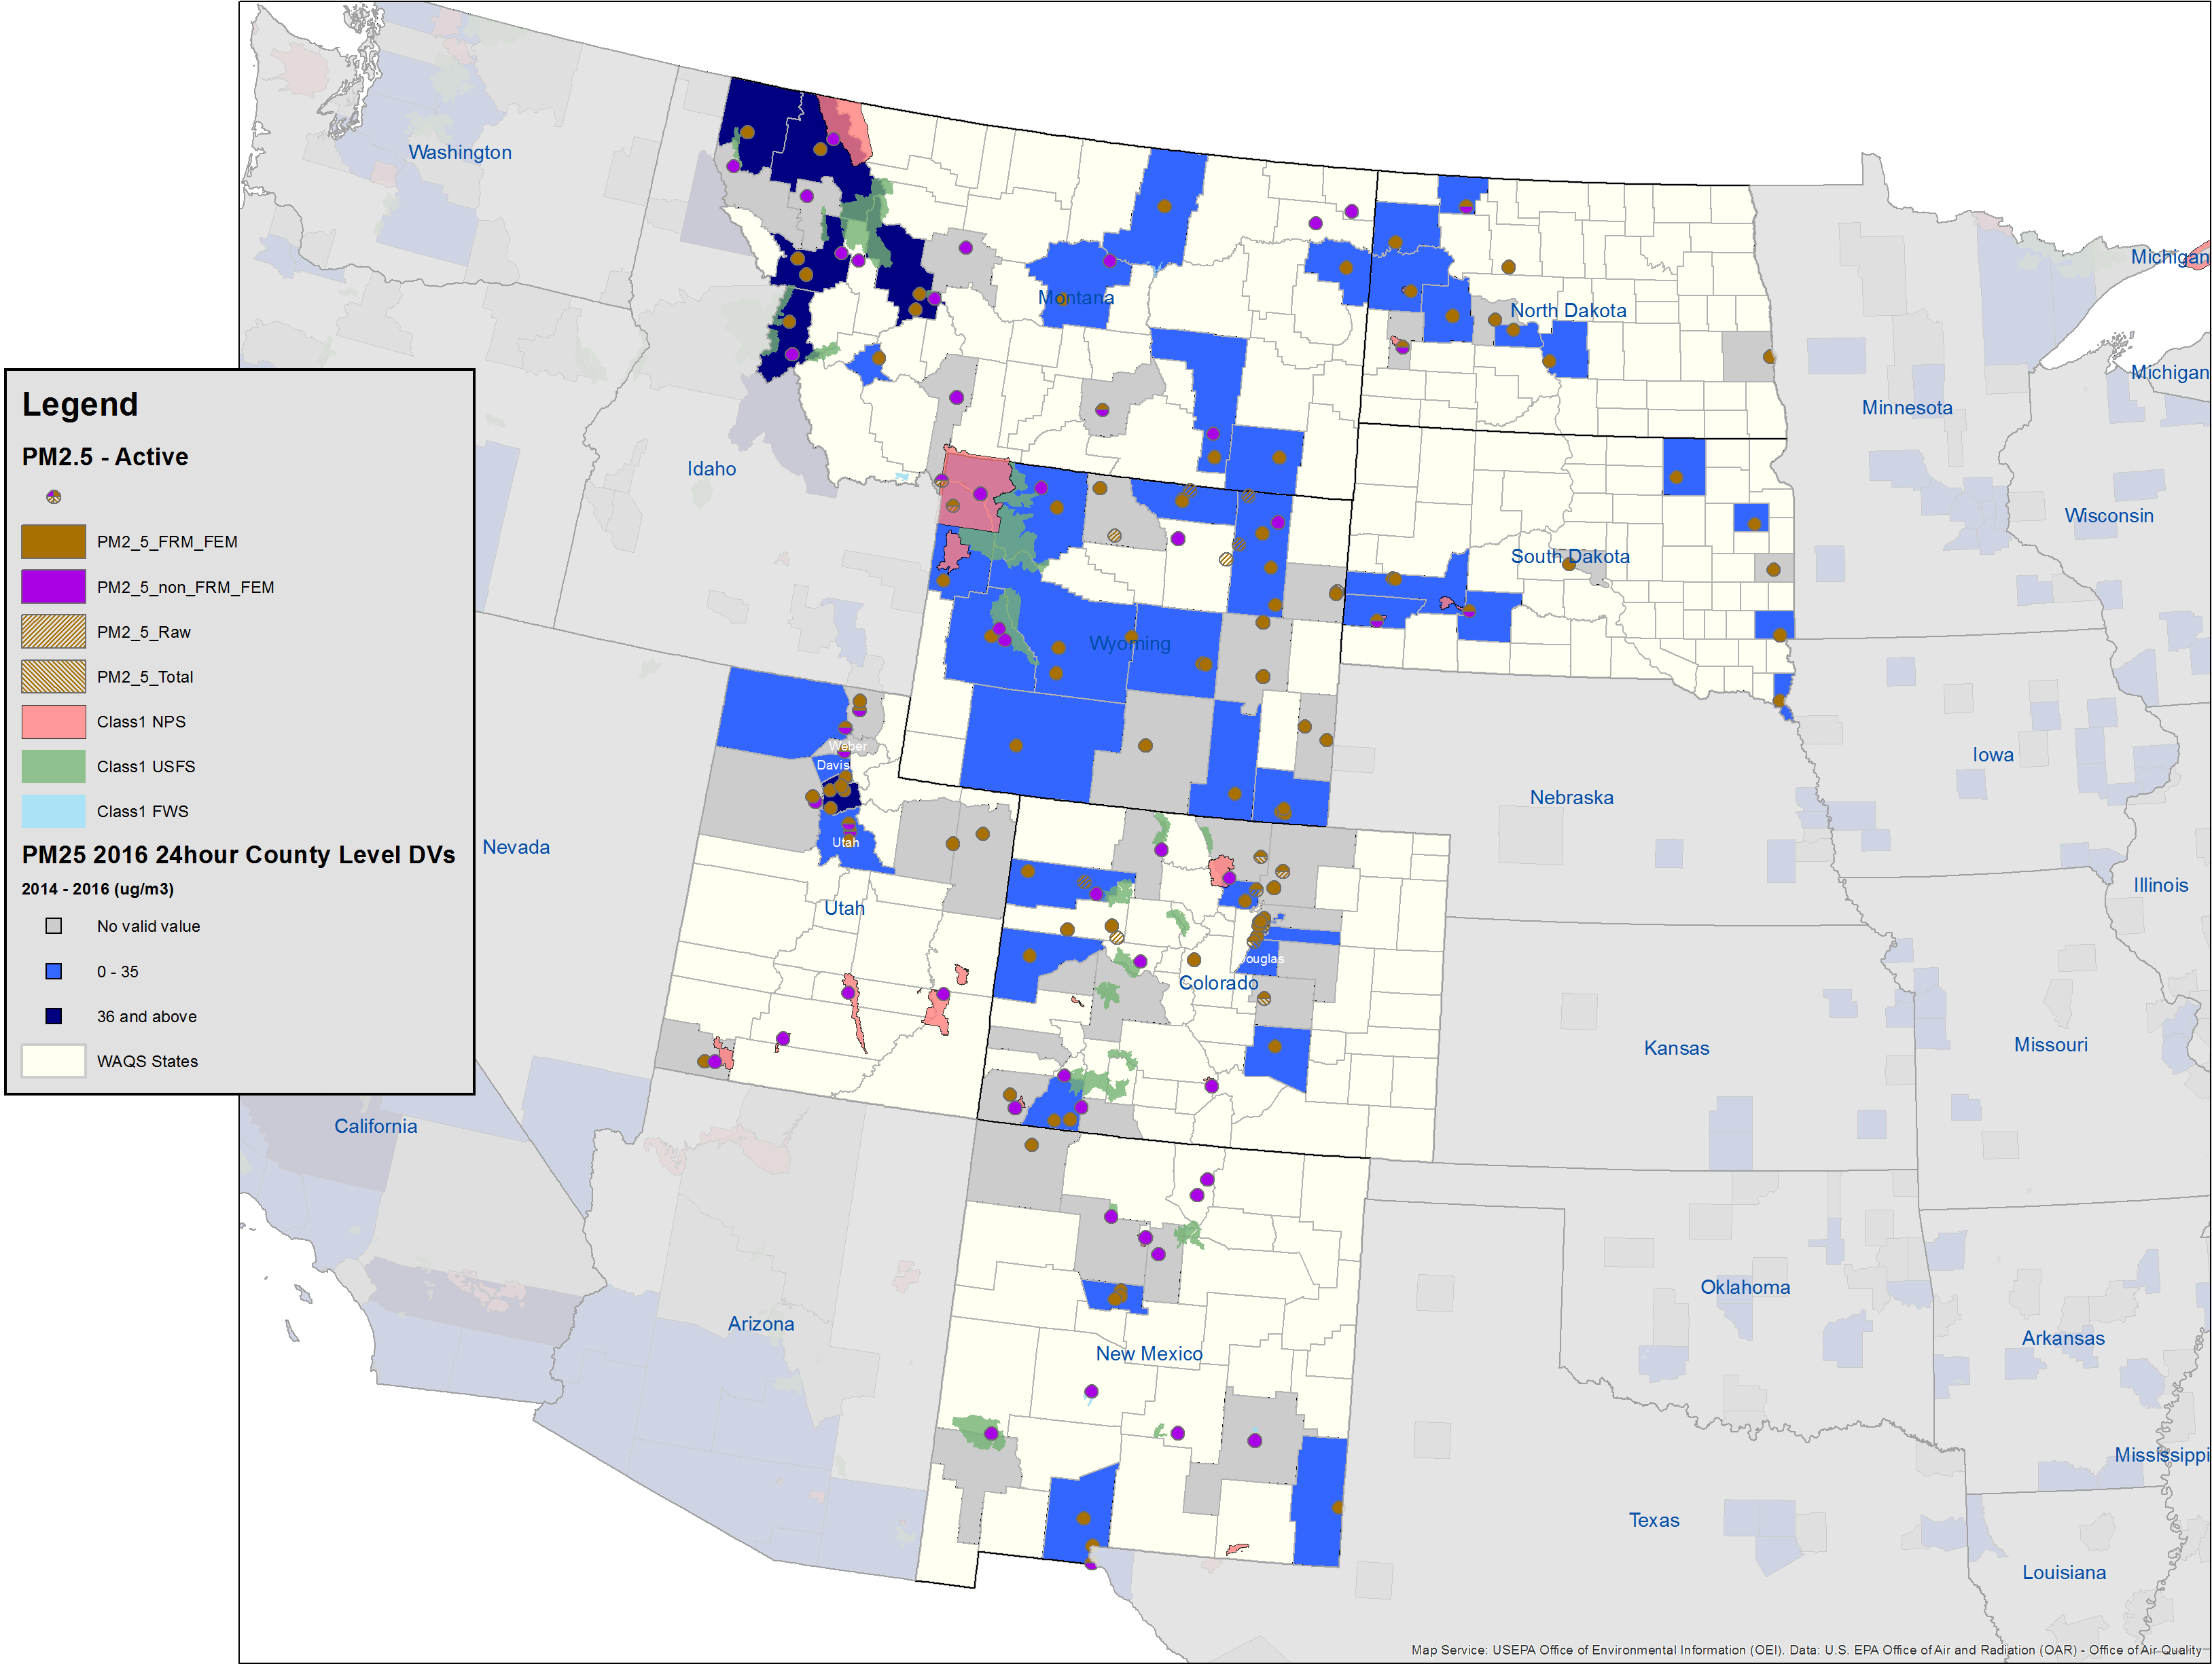
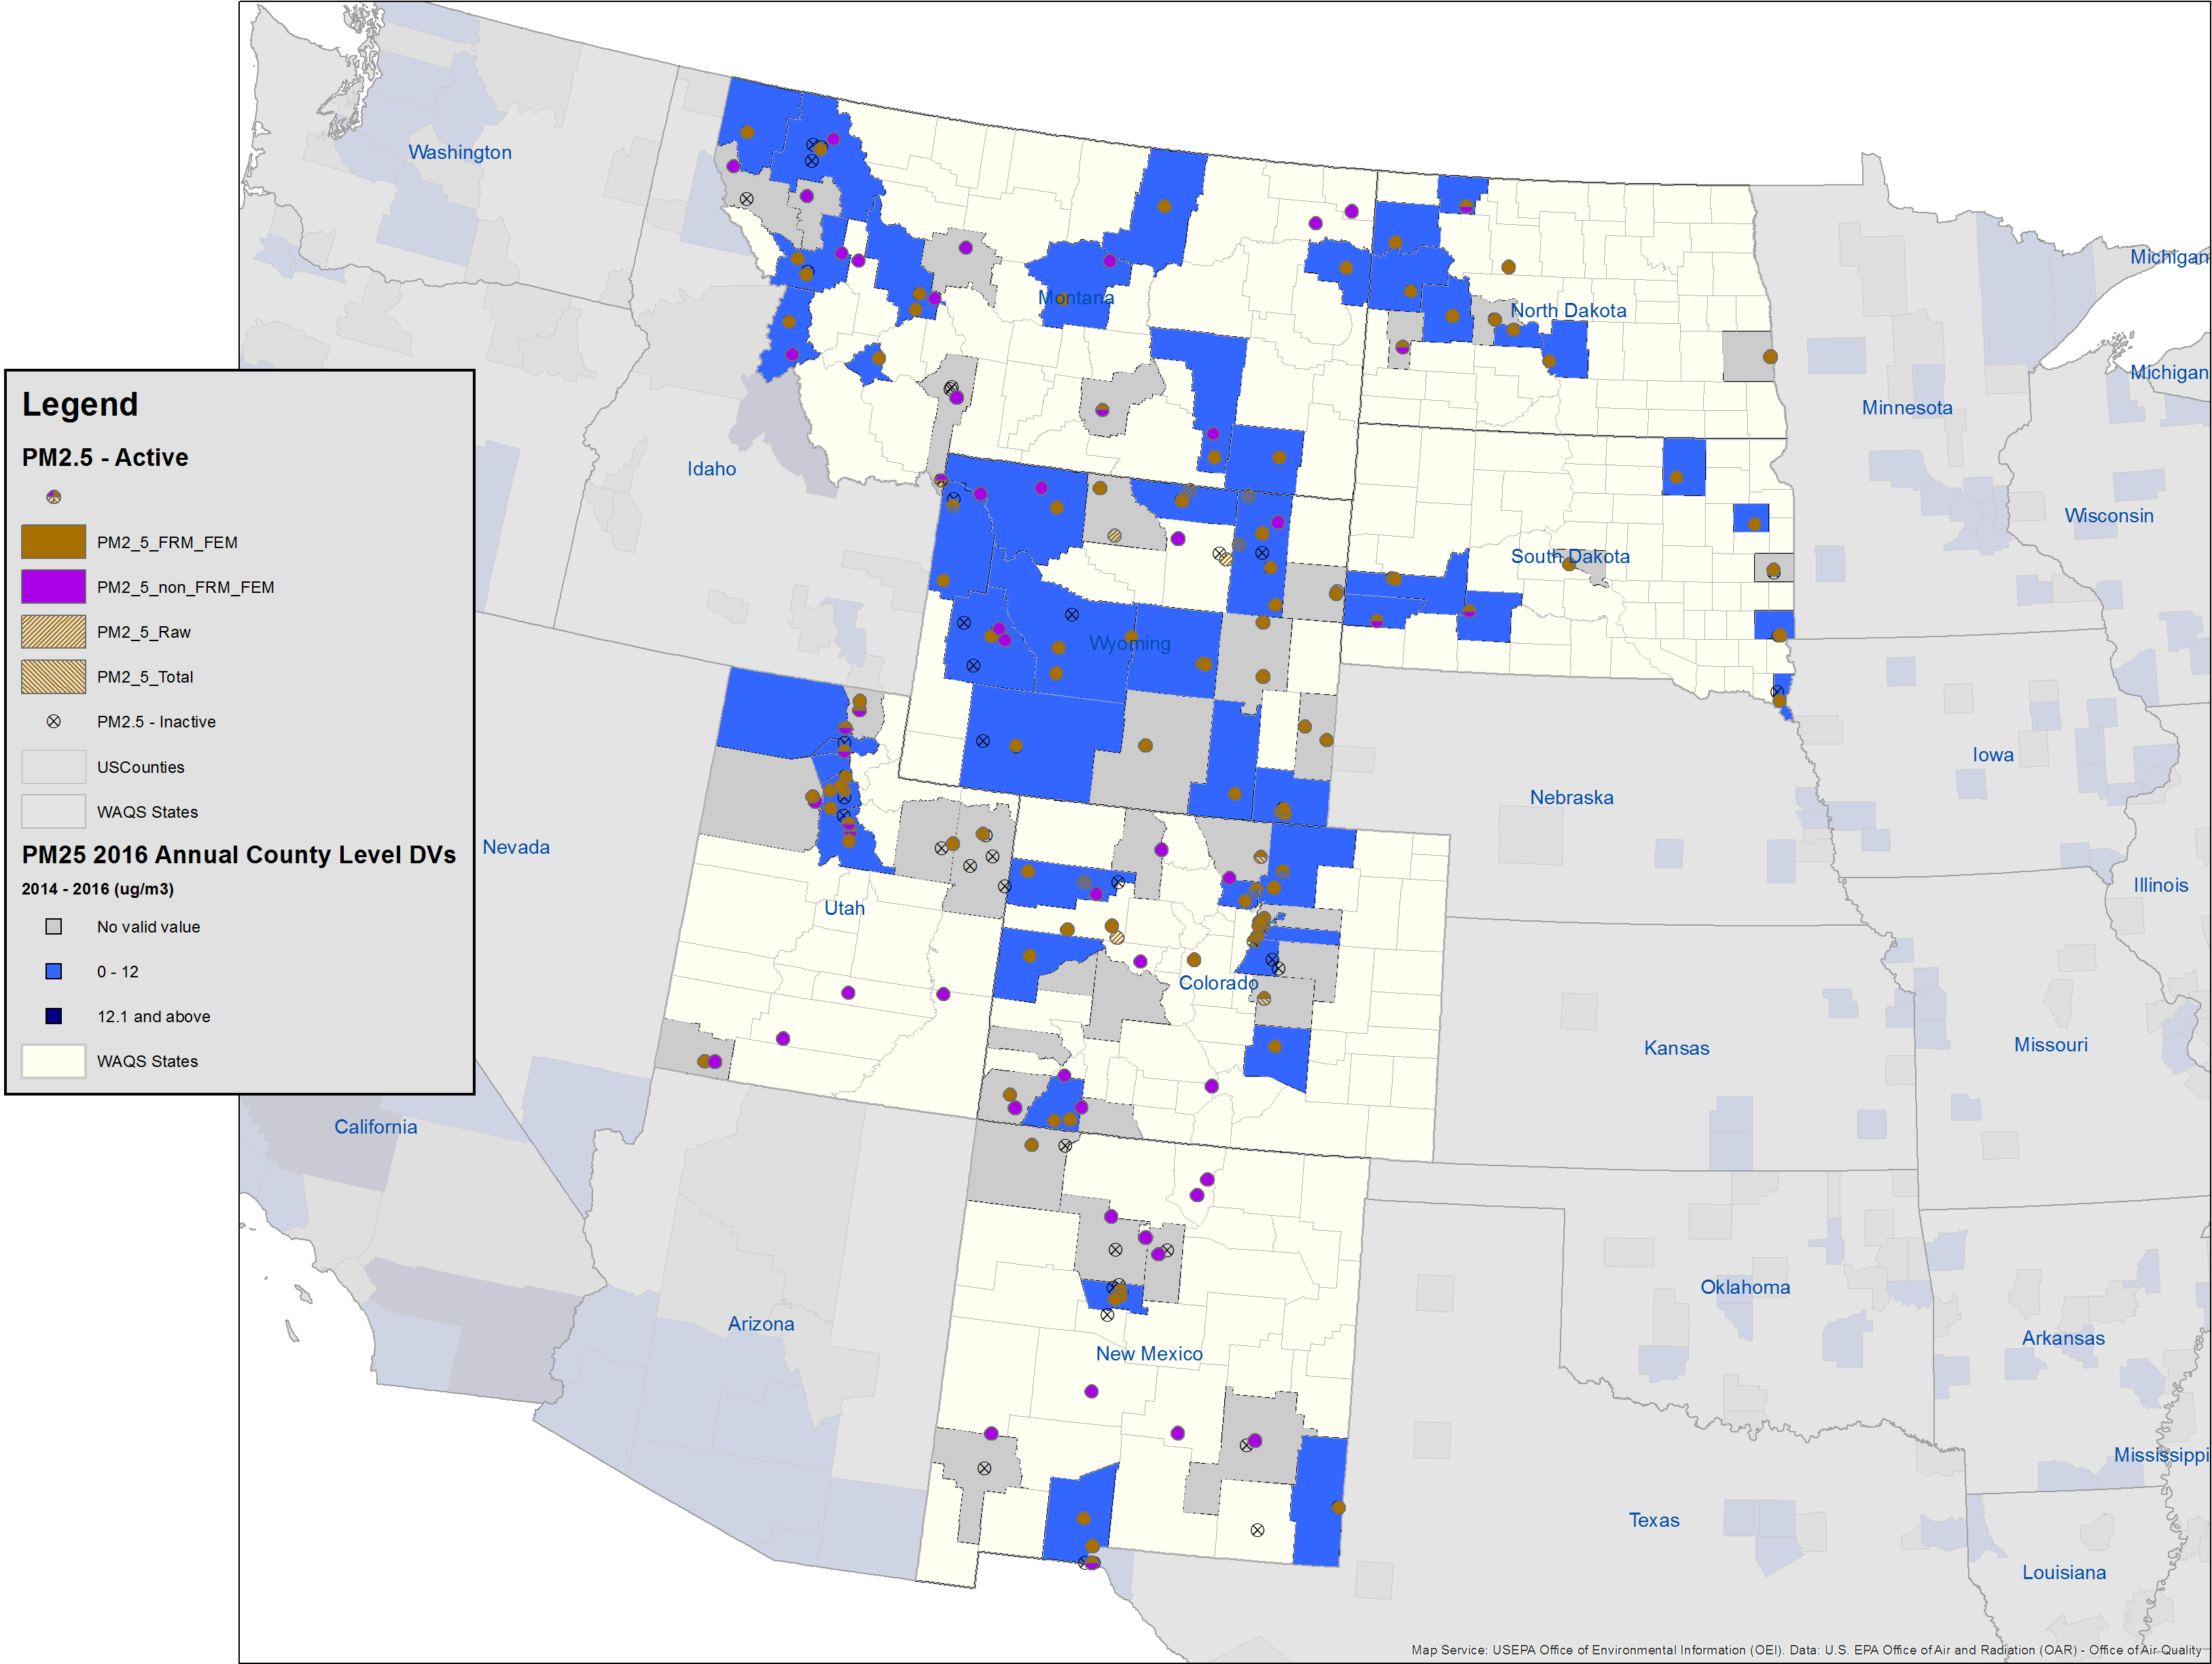
2014-2016 County Level DVs4 (overlaid with with monitor locations)5
O3 MD8
O3 MD8 zoom to show counties with monitor(s) > 70ppb
NO2 1-hour
NO2 annual
PM2.5 24-hour
[PM2.5 24-hour] with CIA overlay
PM2.5 annual
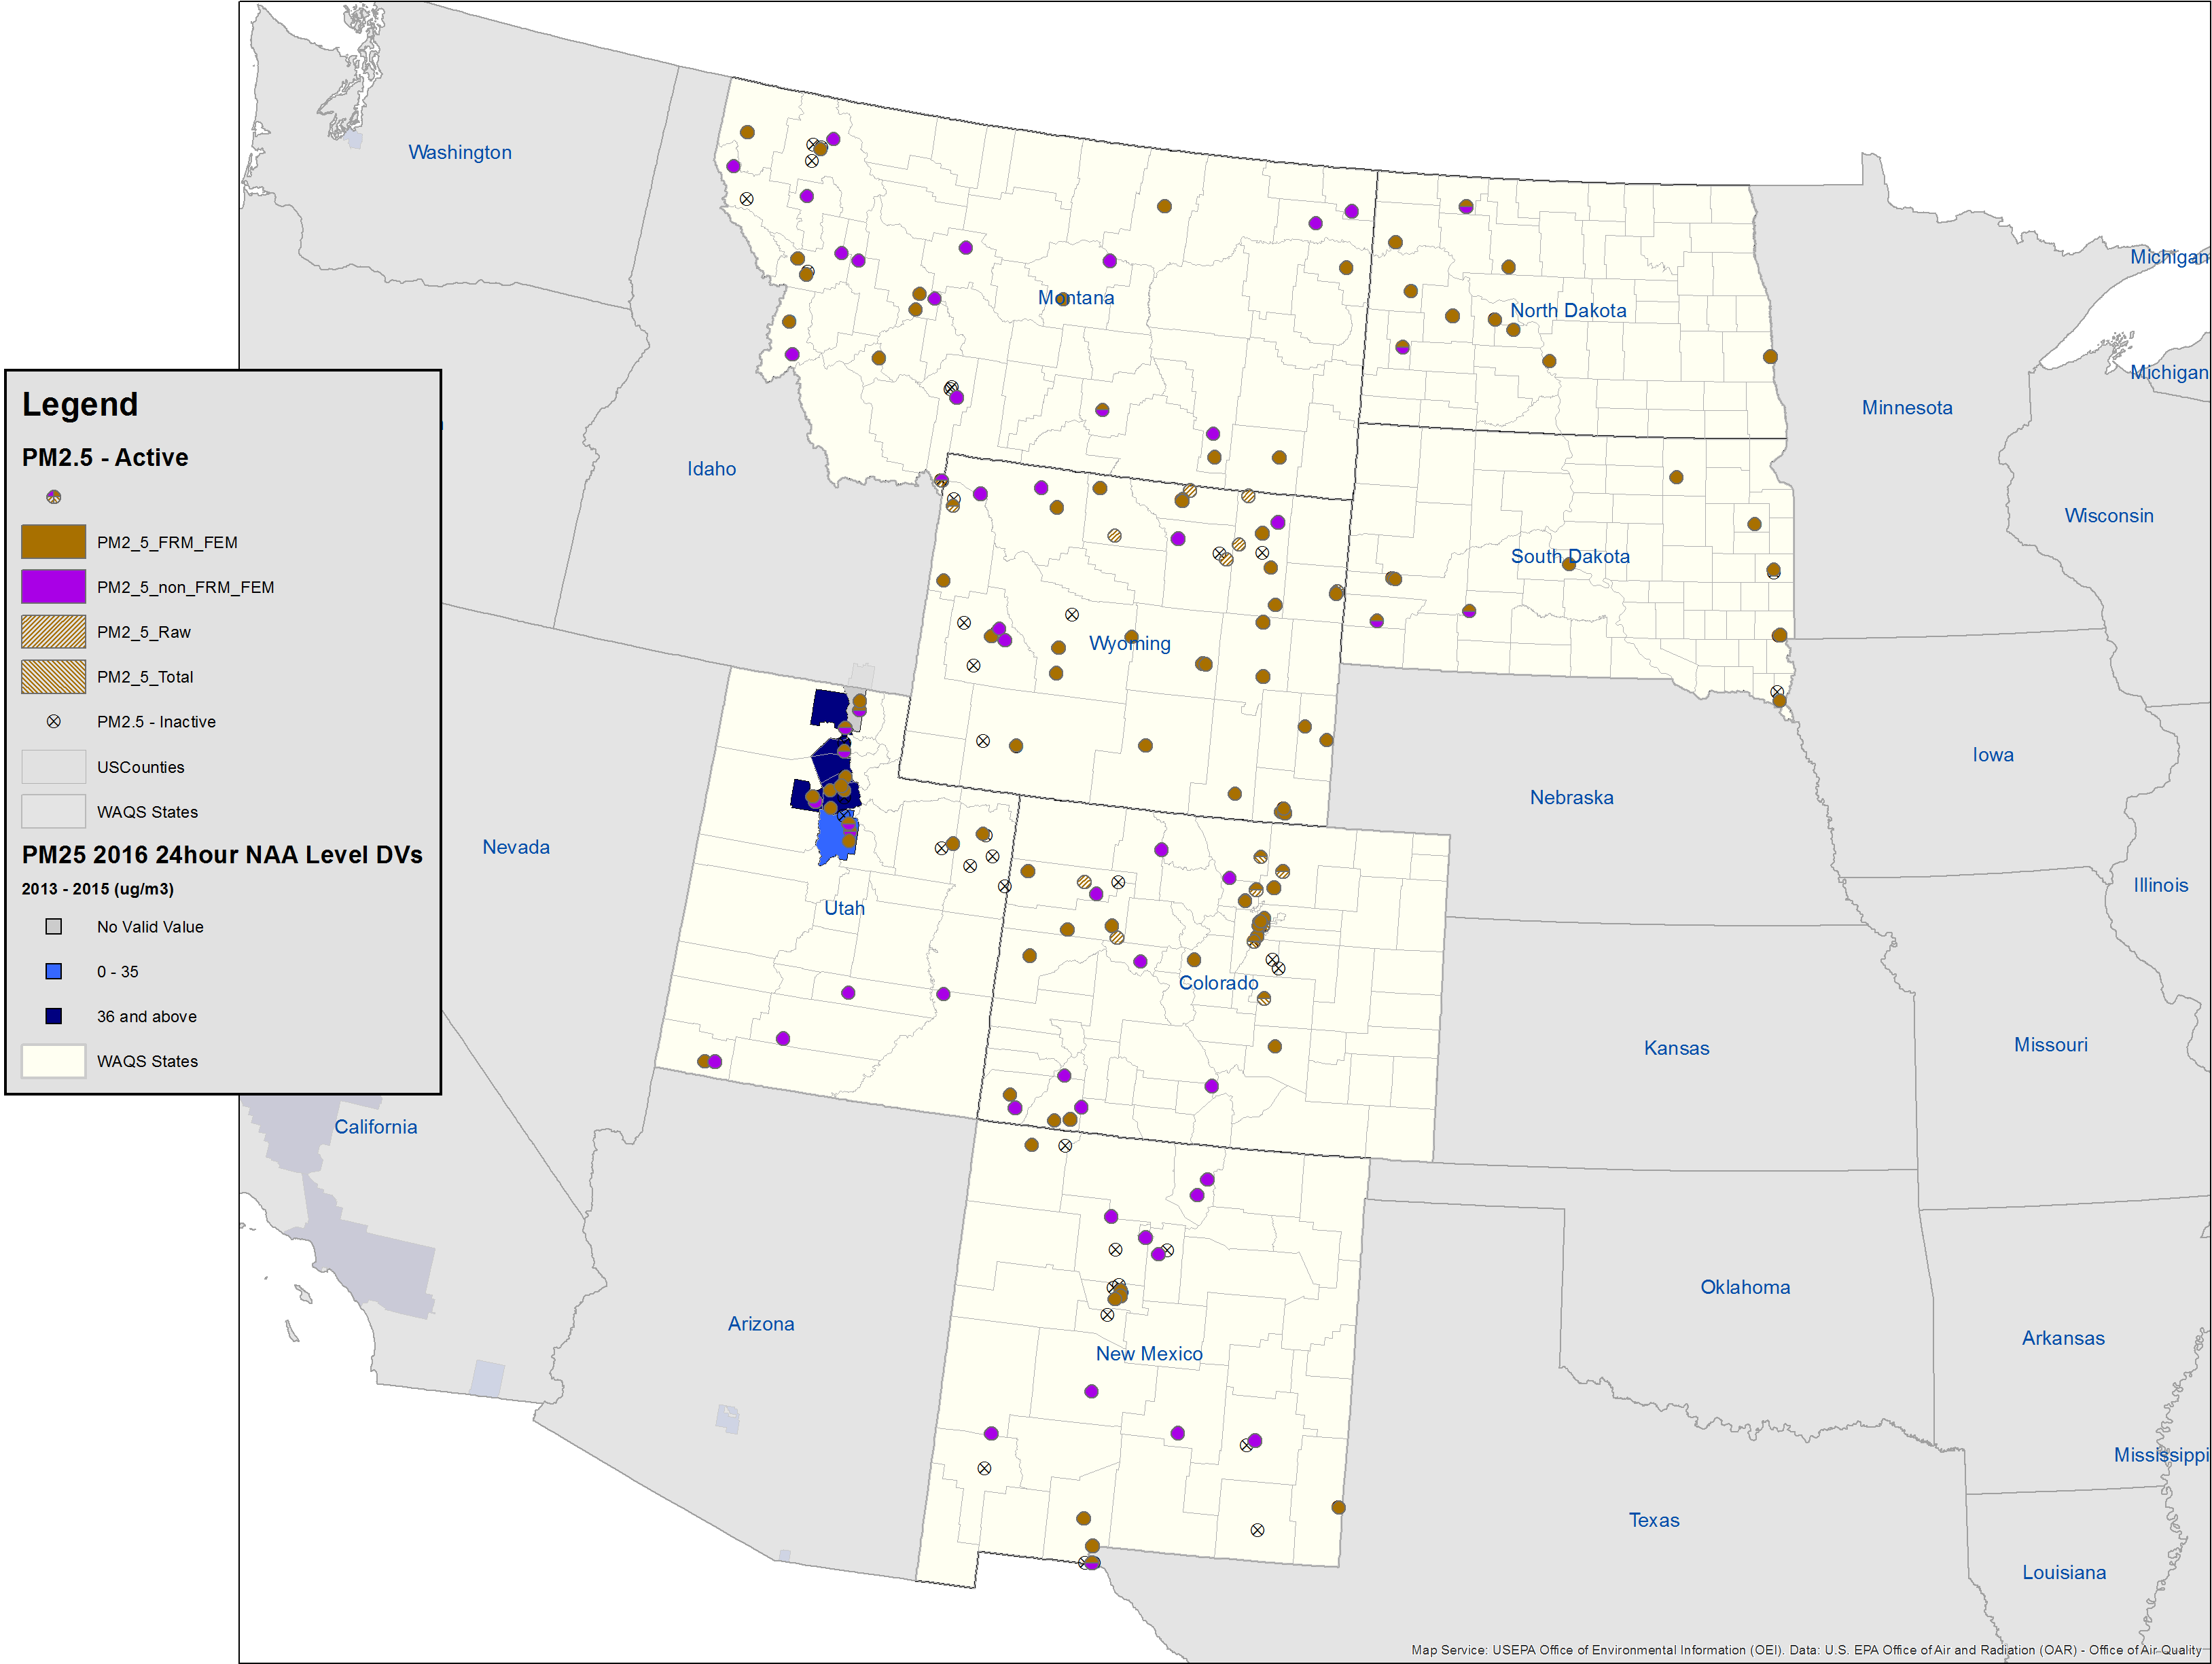
PM2.5 24-hour NAAs WAQS Region
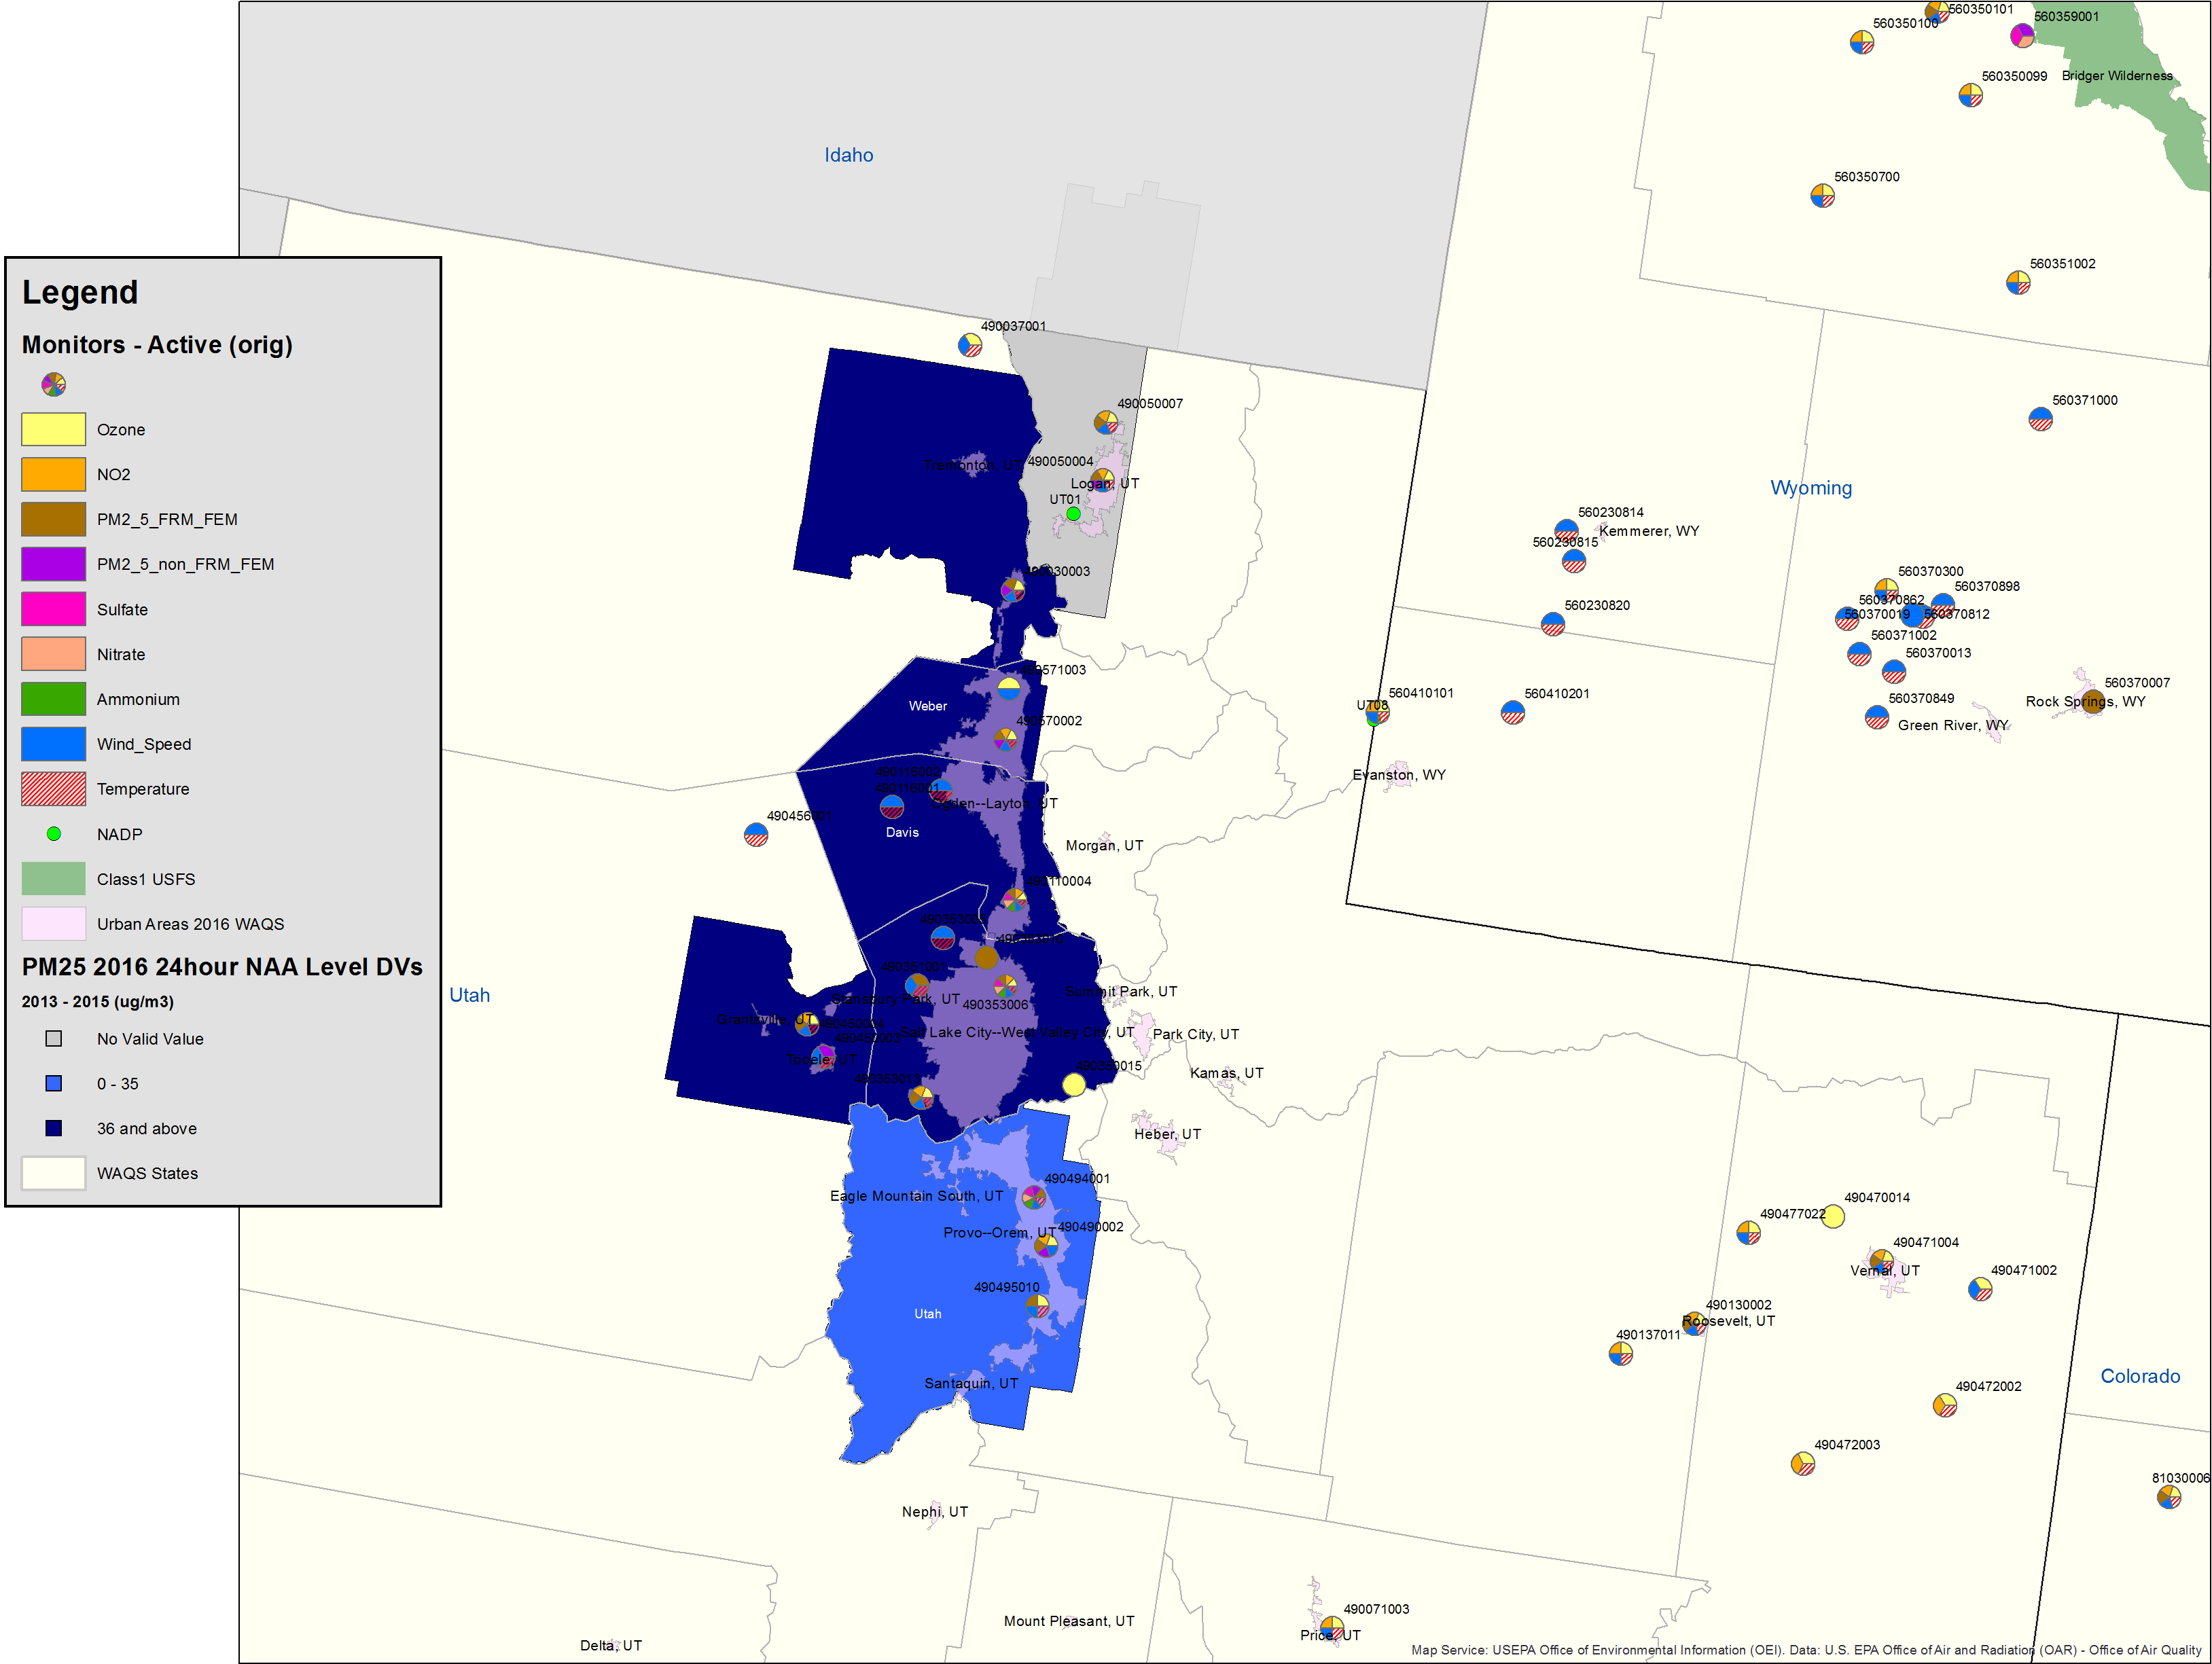
PM2.5 24-hour NAAs zoom to Wasatch Front, includes NO3 and NH4 monitors (should update with AMoN, specifically)
Monitor-to-Monitor Analysis
Maps
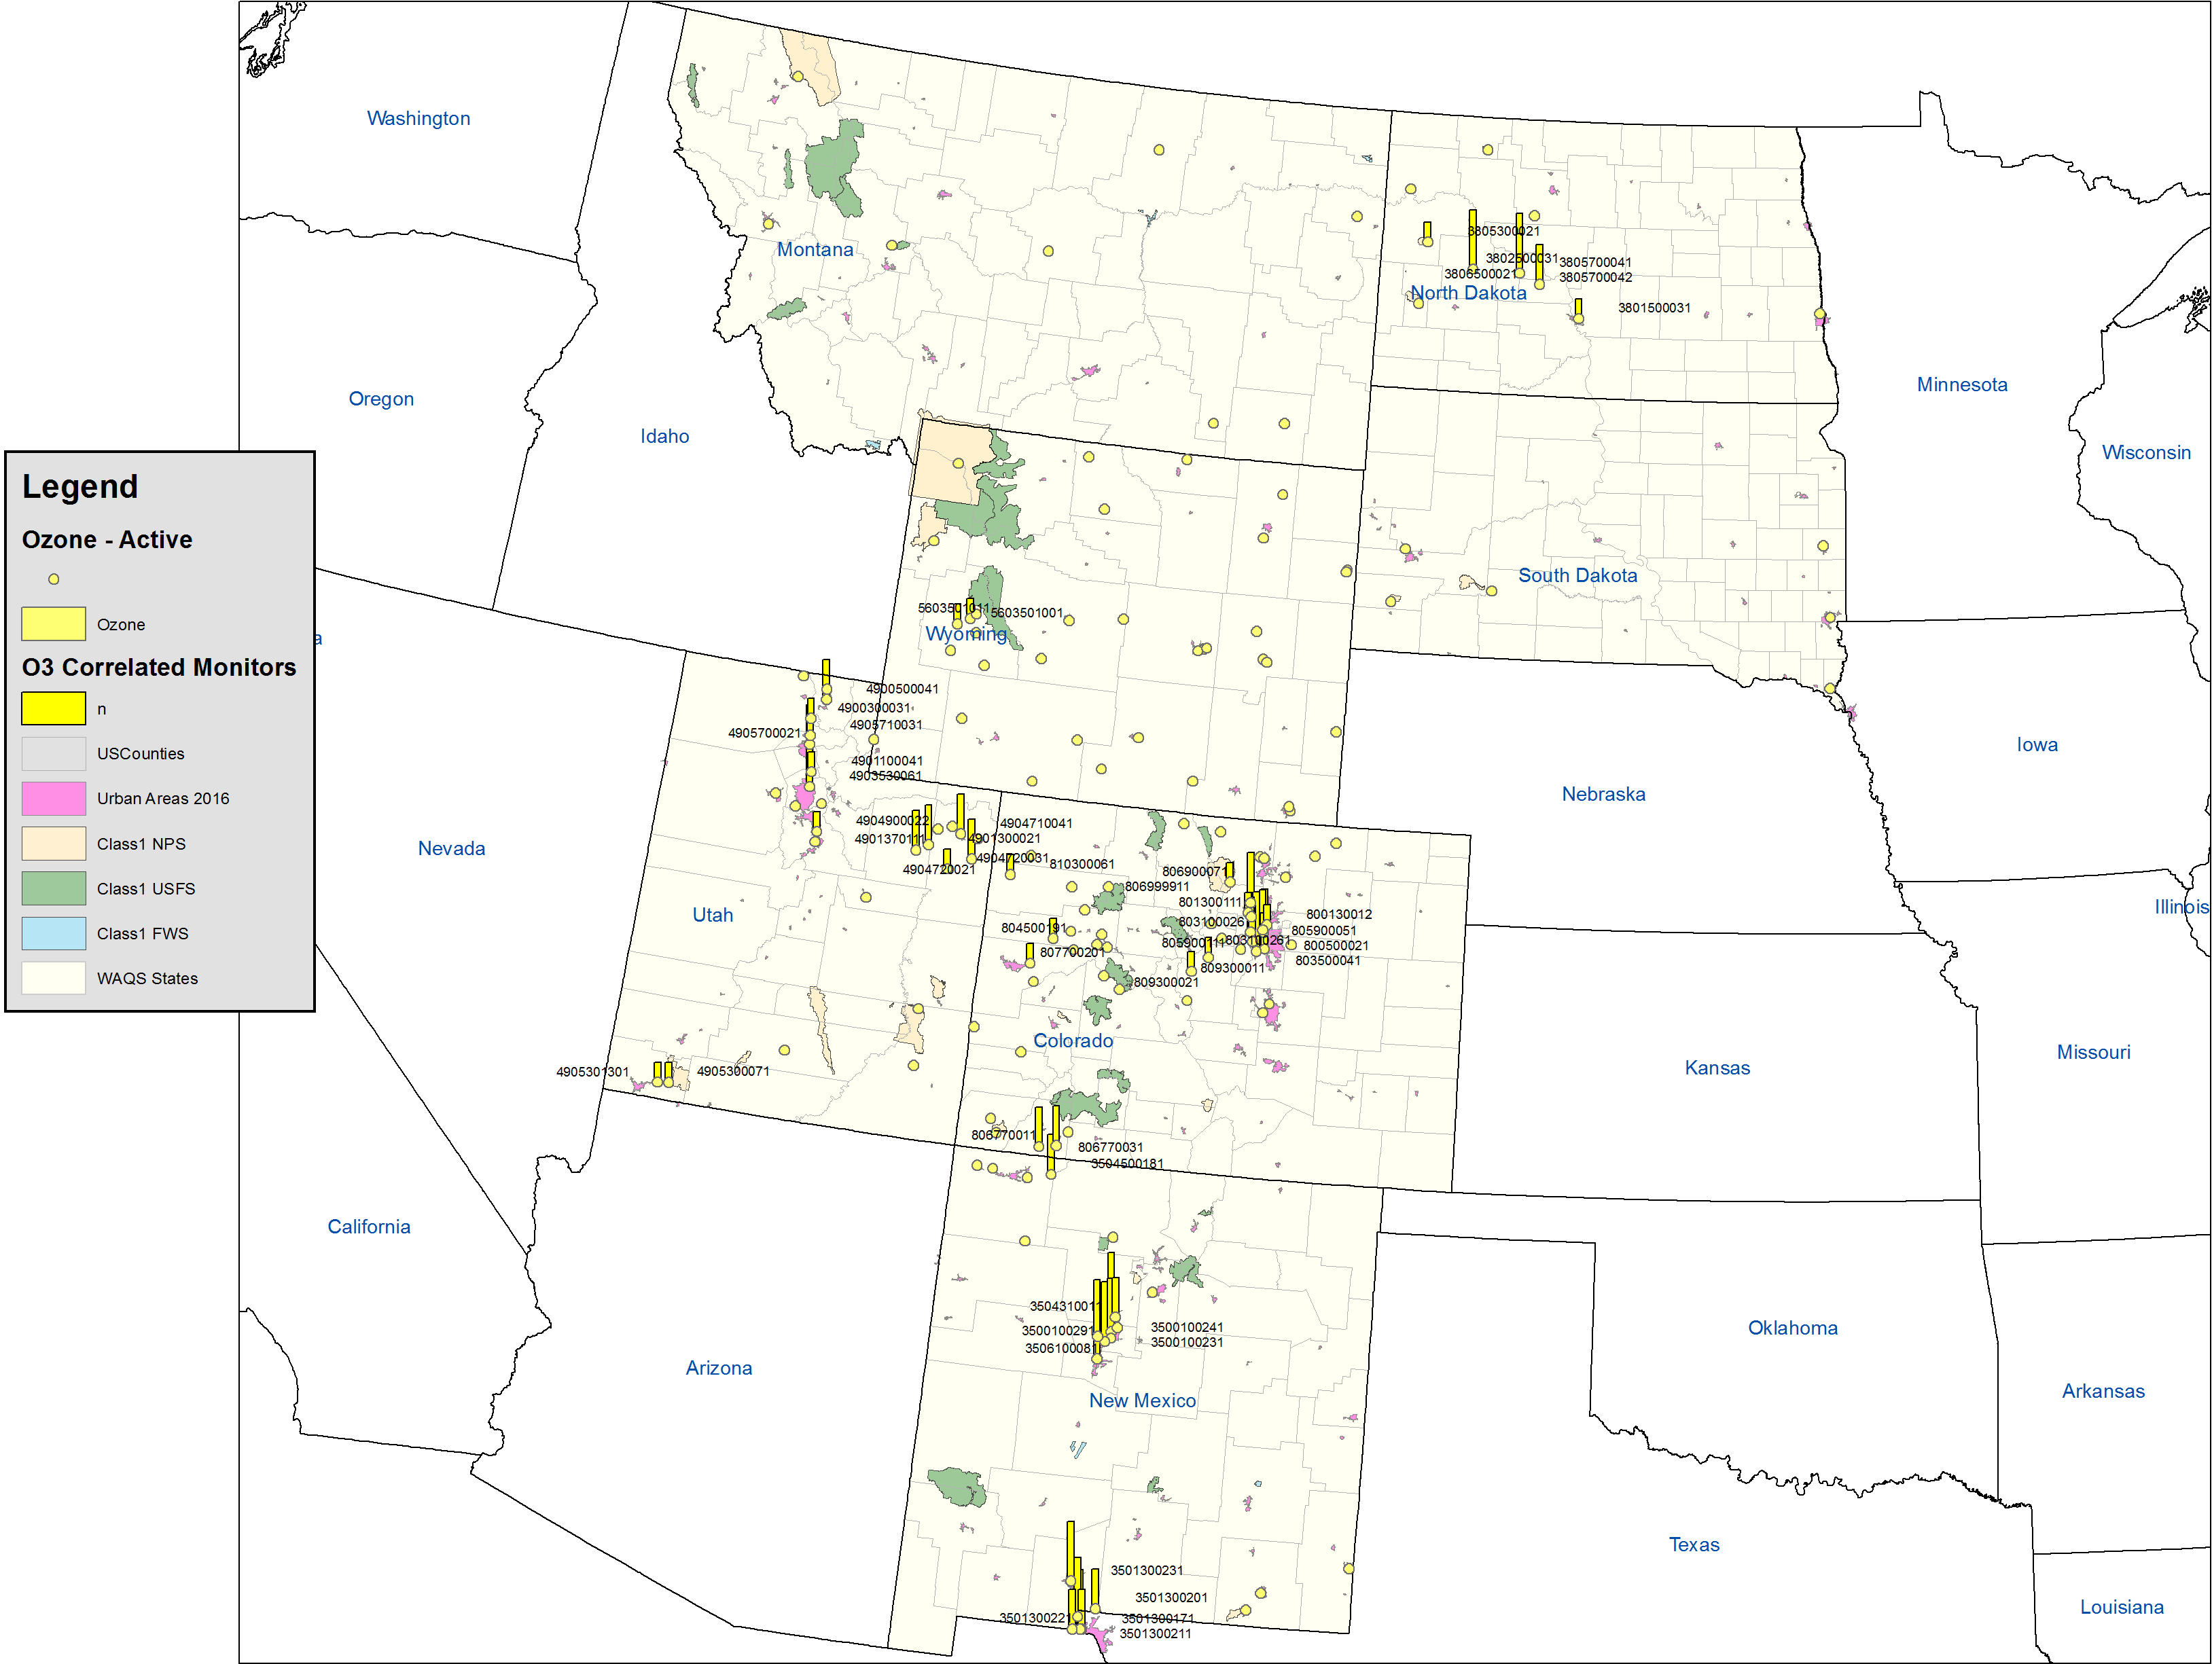
Locations of highly correlated monitors, as defined in the MNA Report.6O3
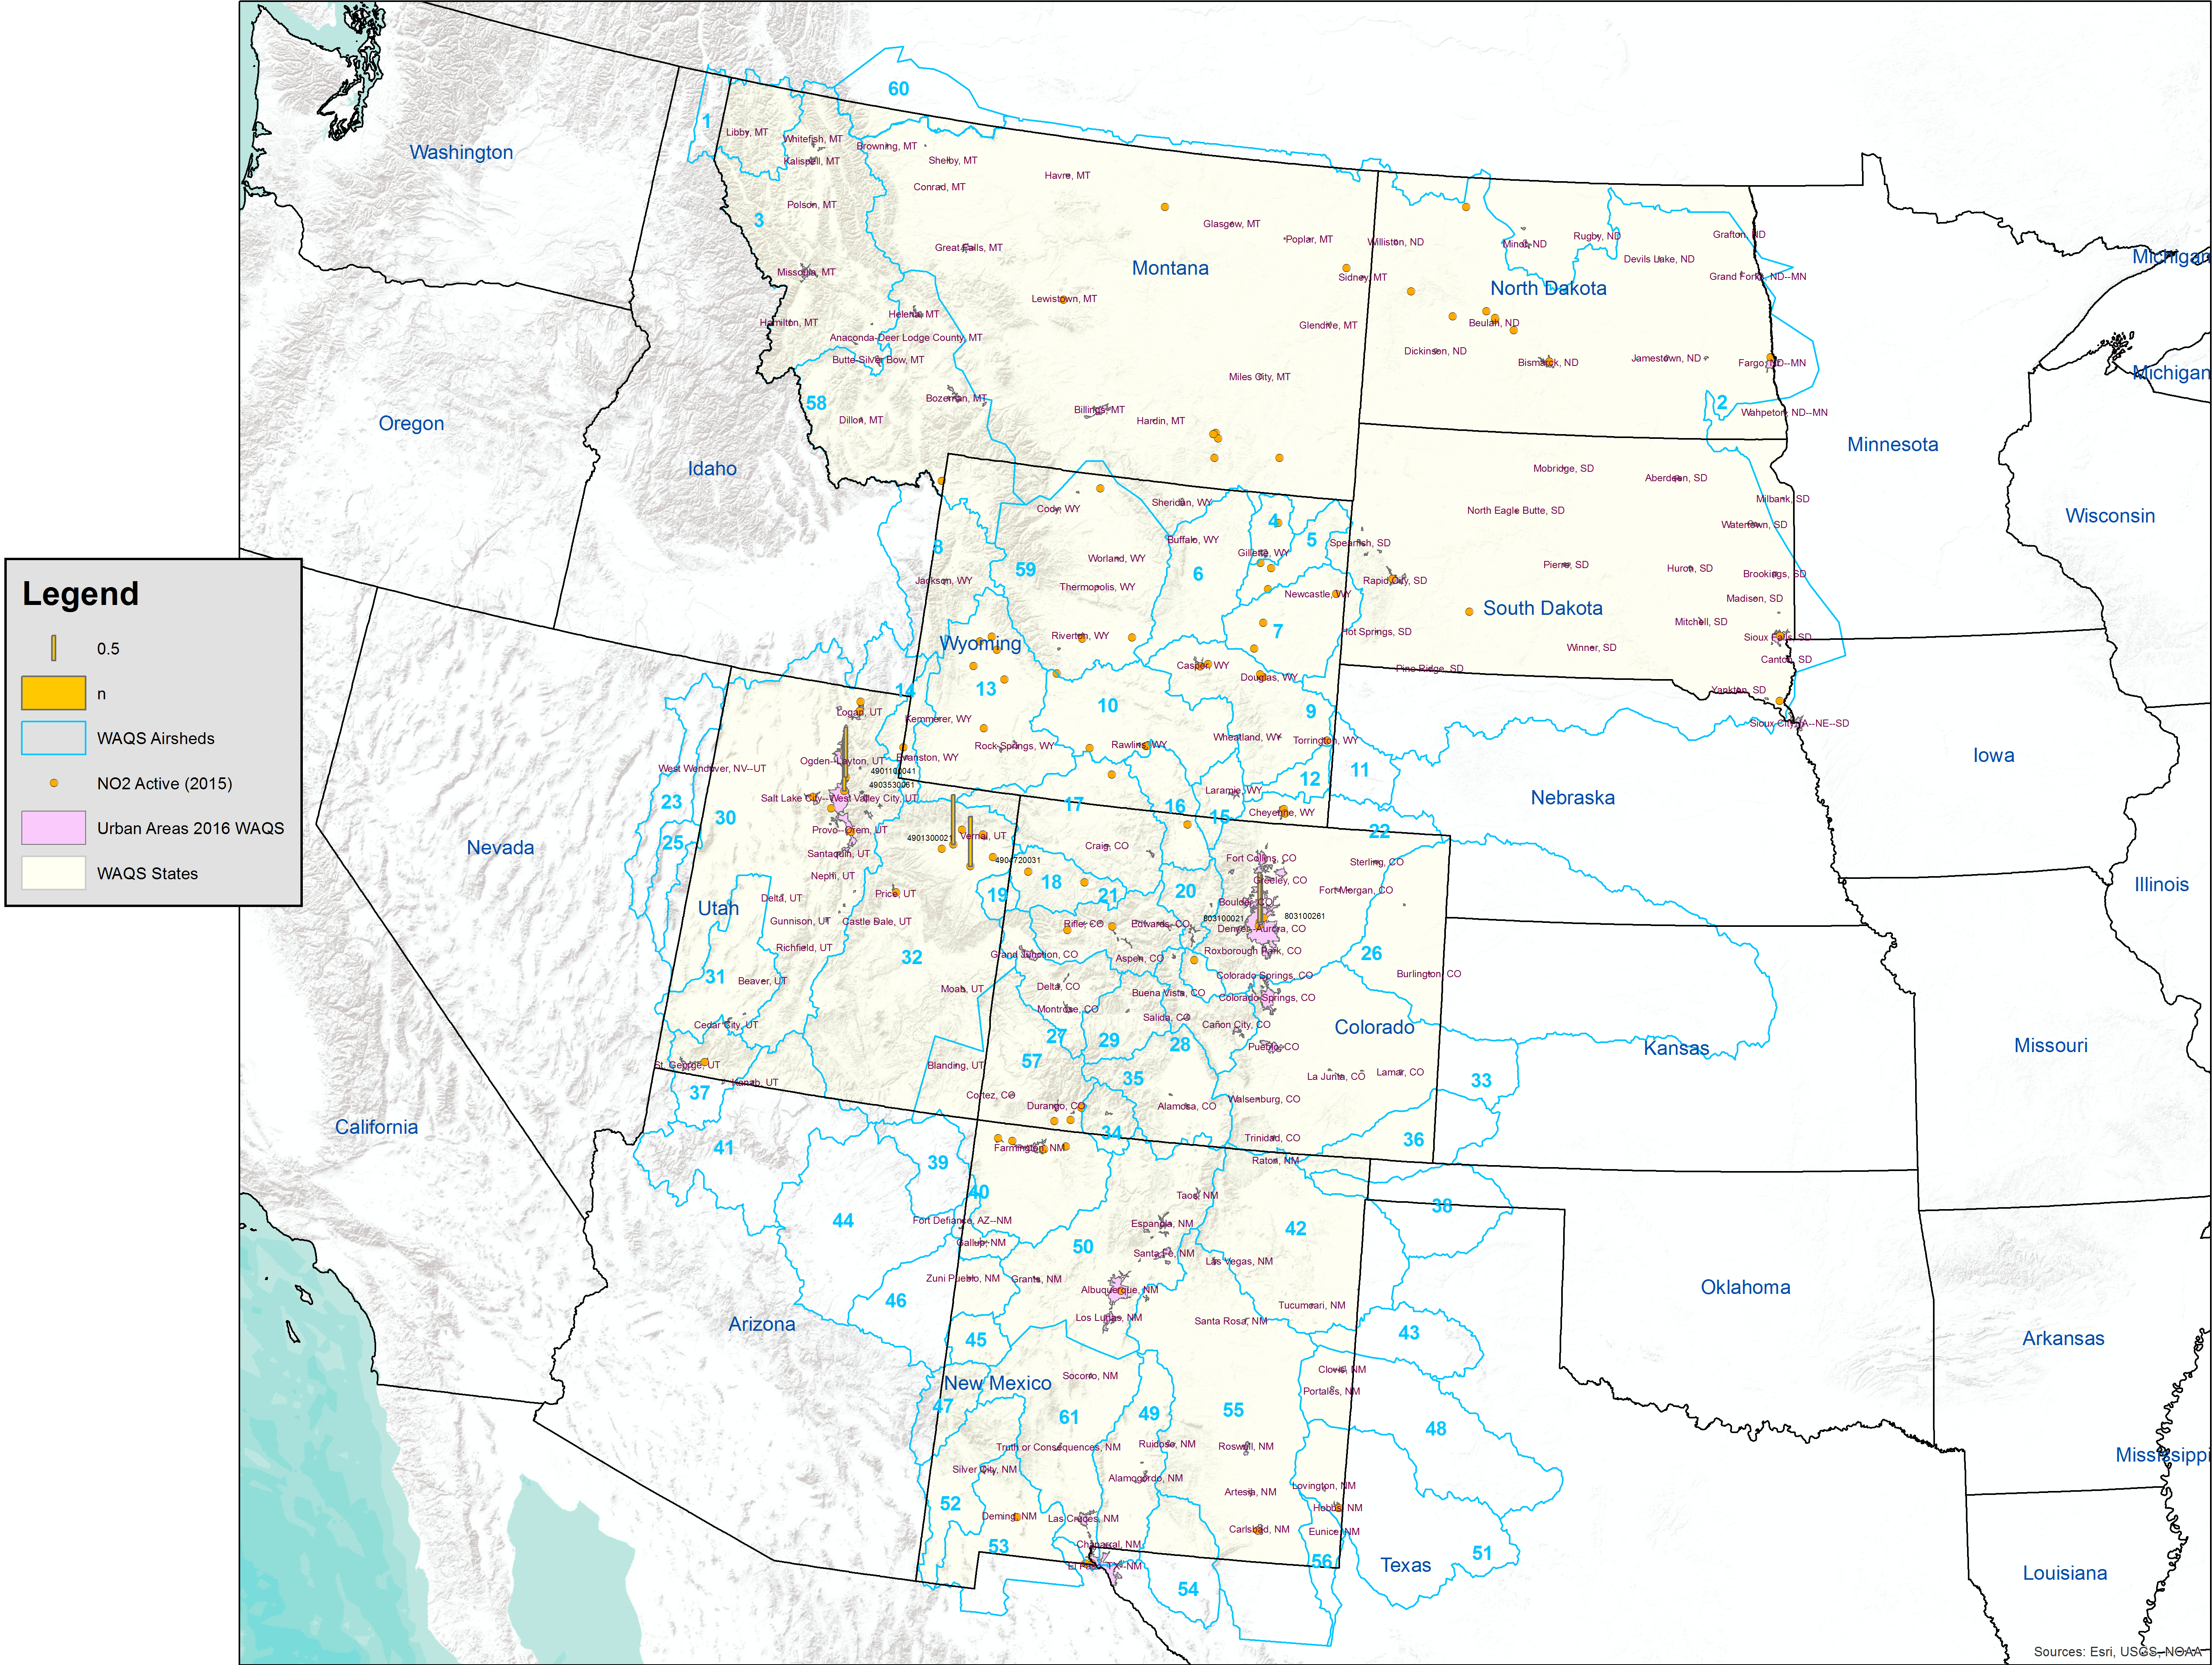
NO2
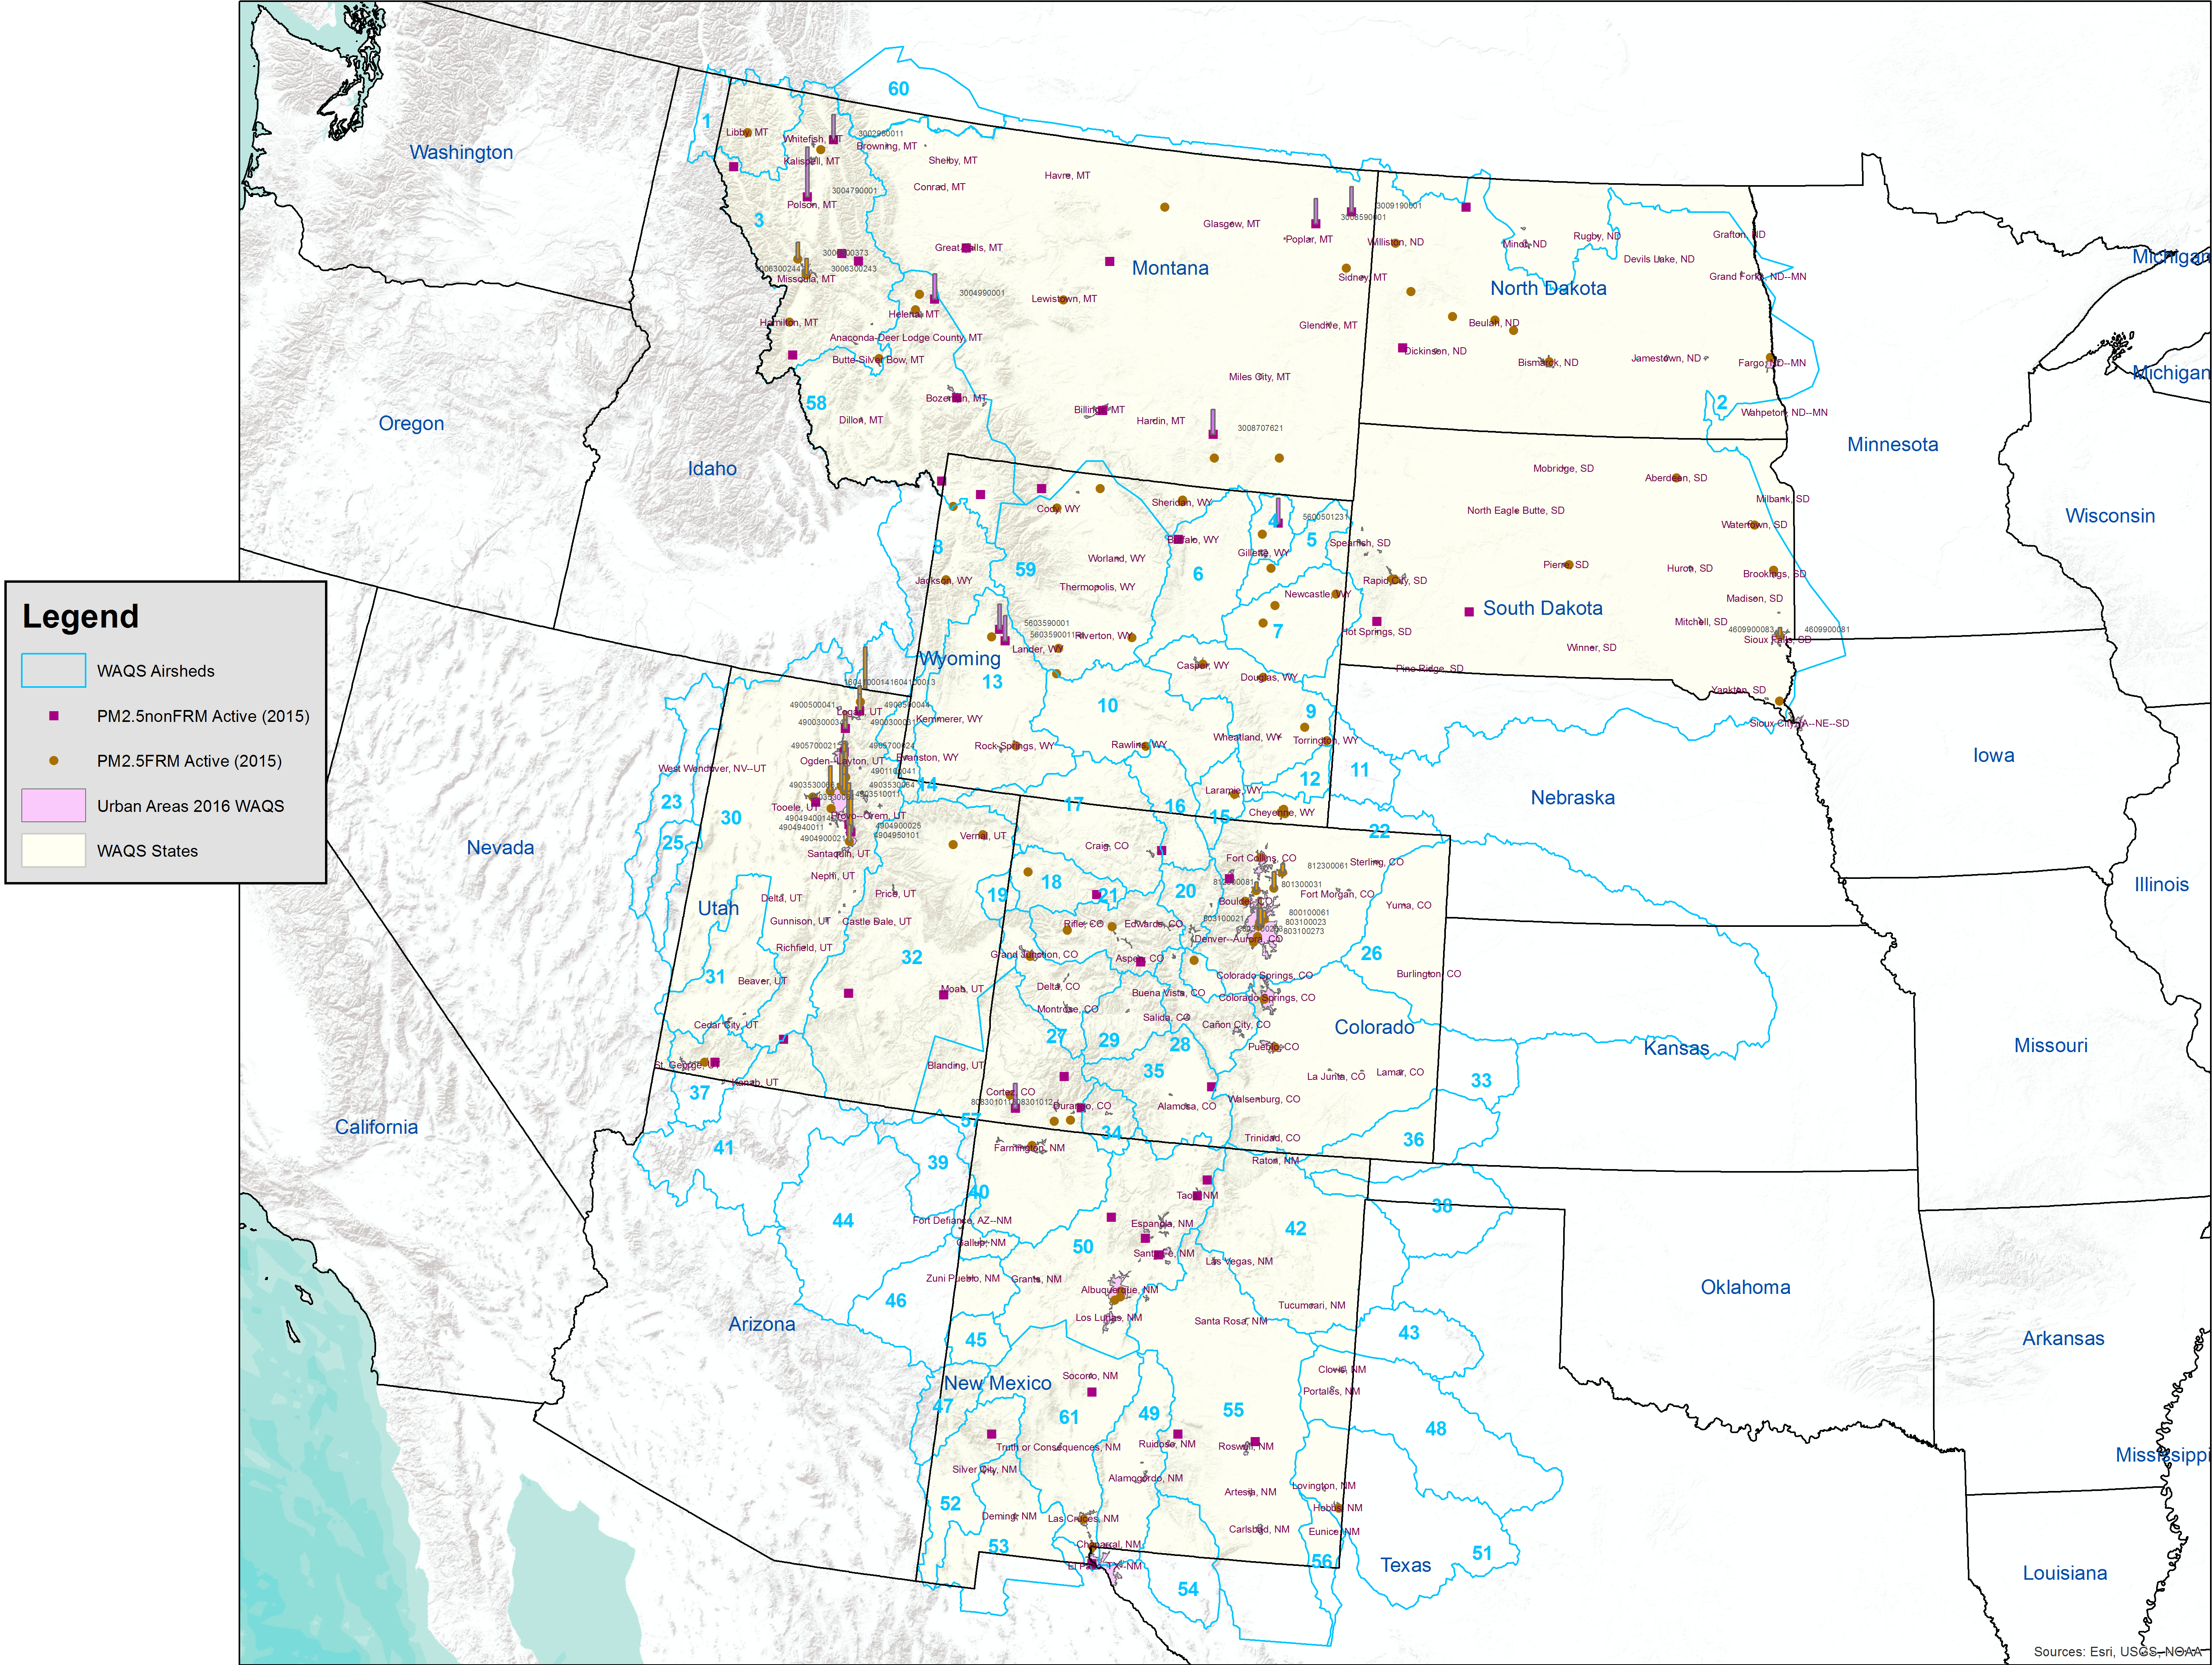
PM2.5
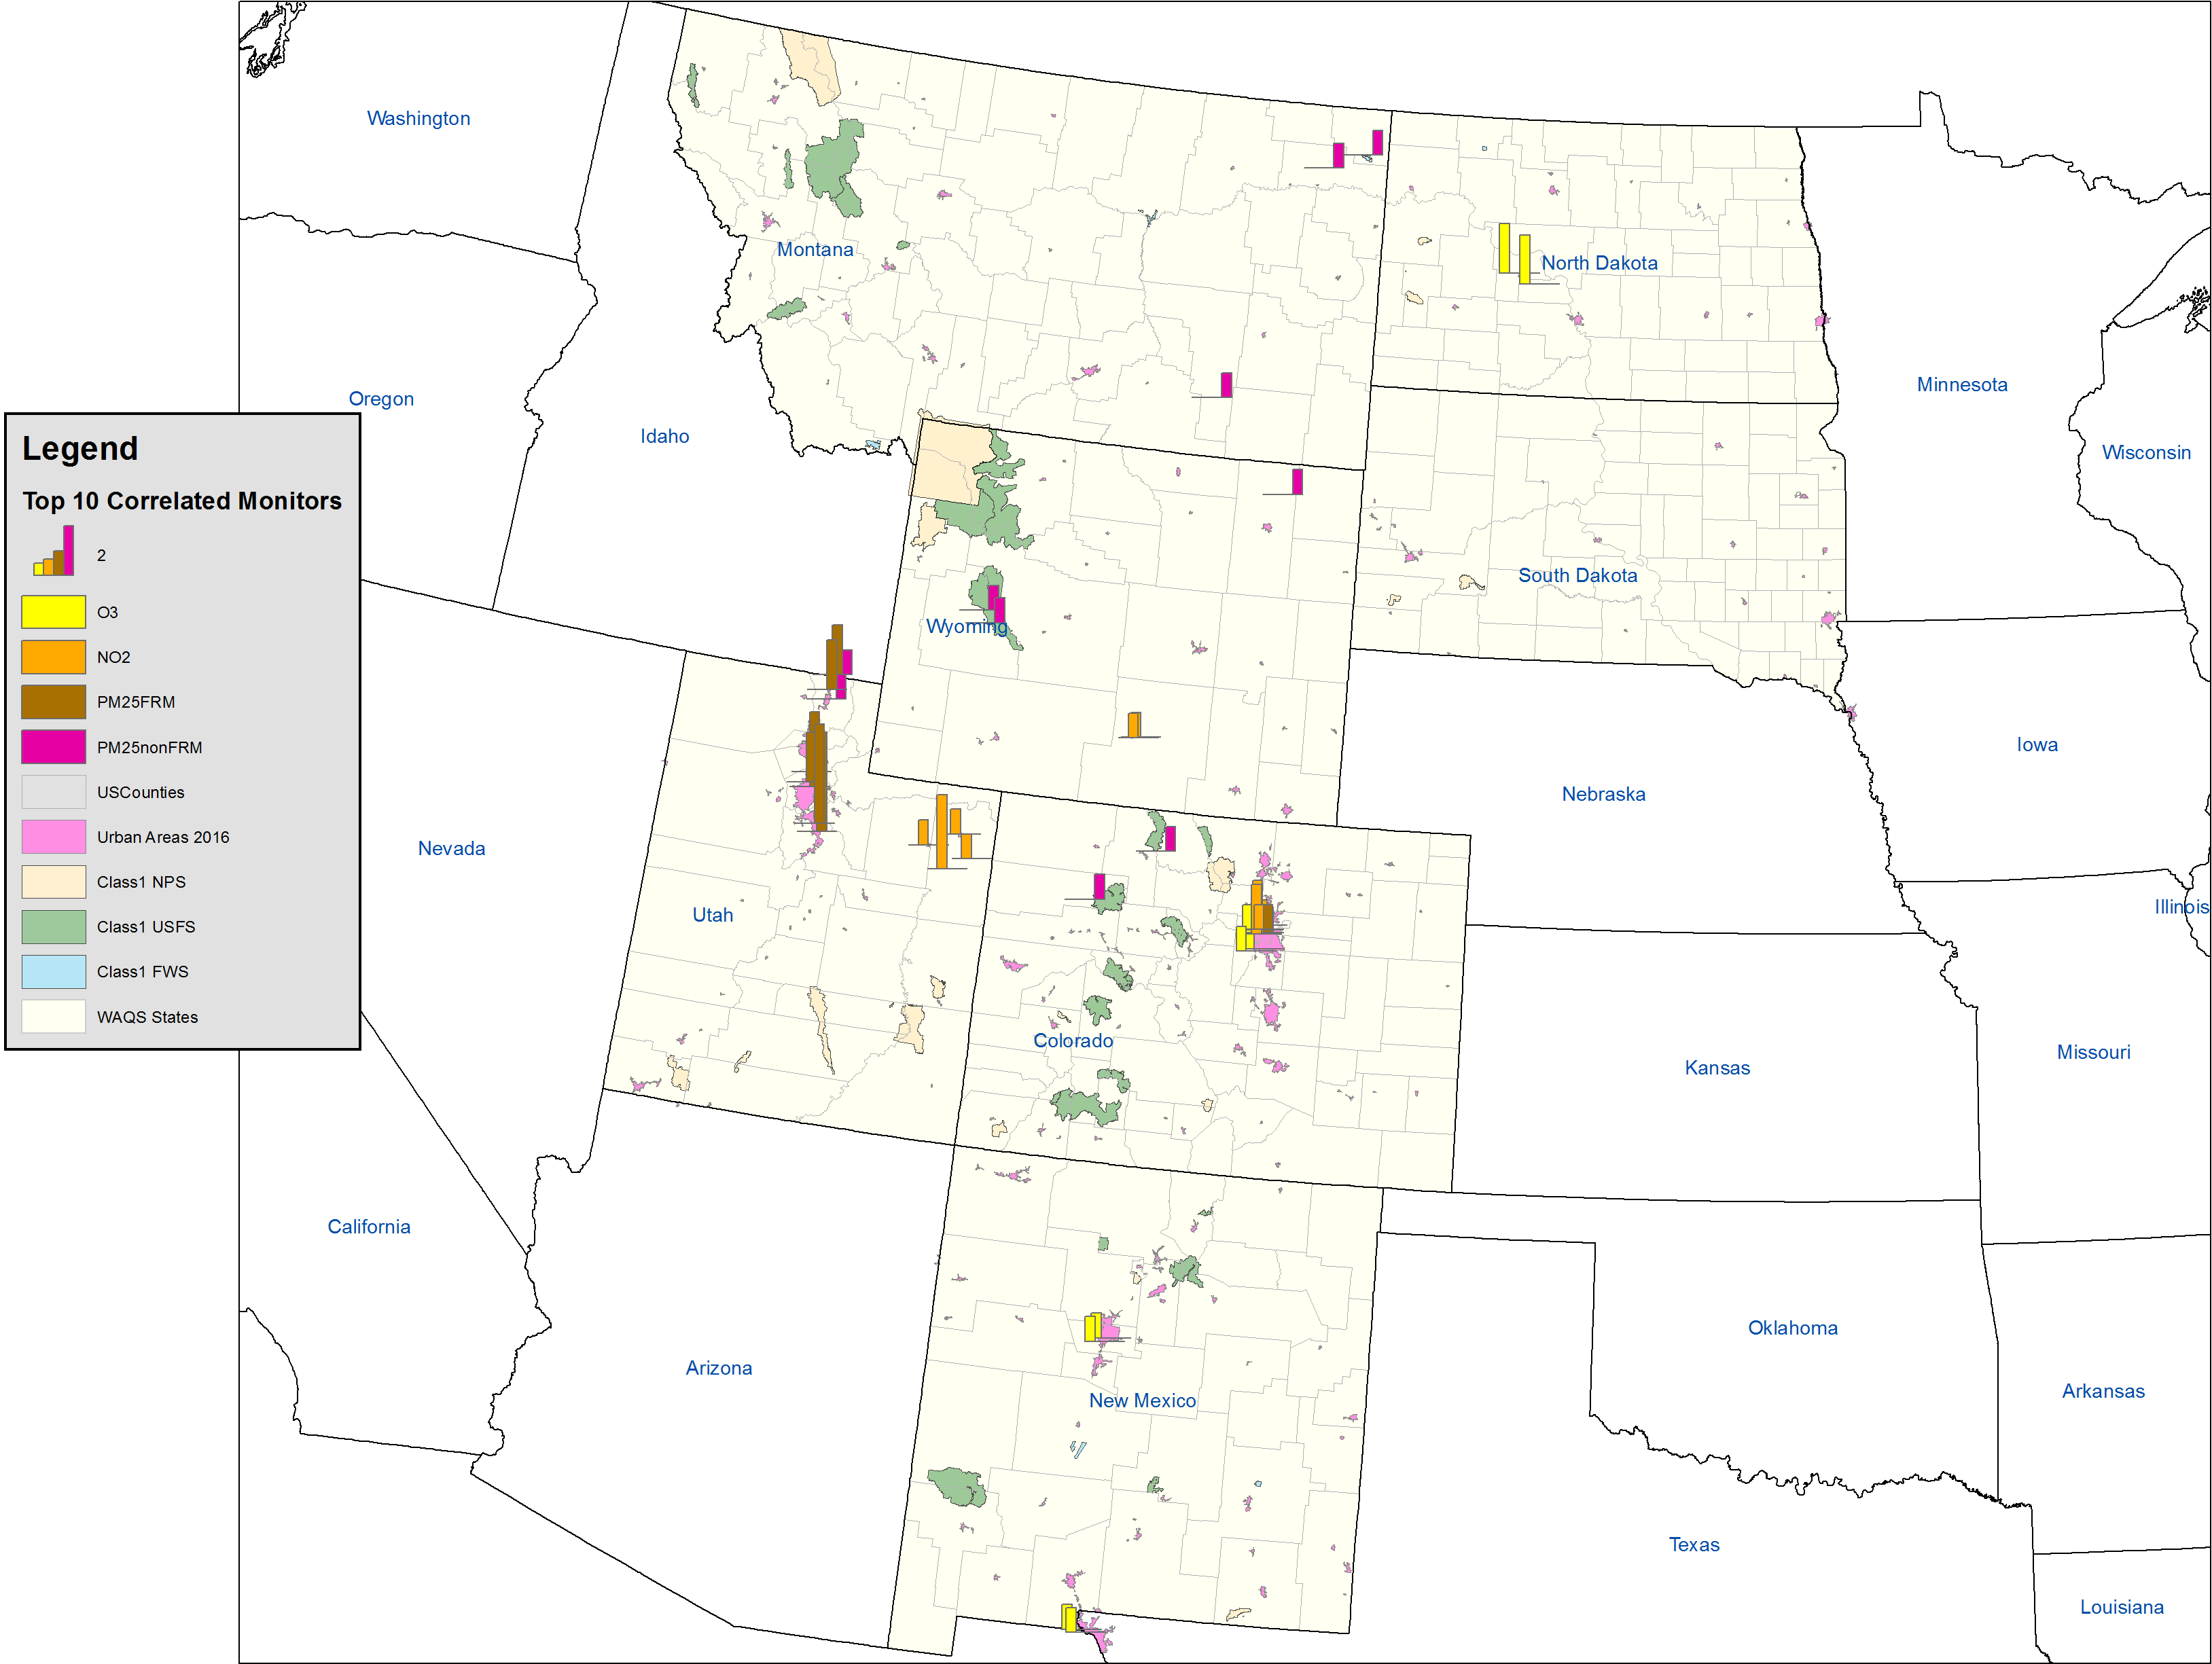
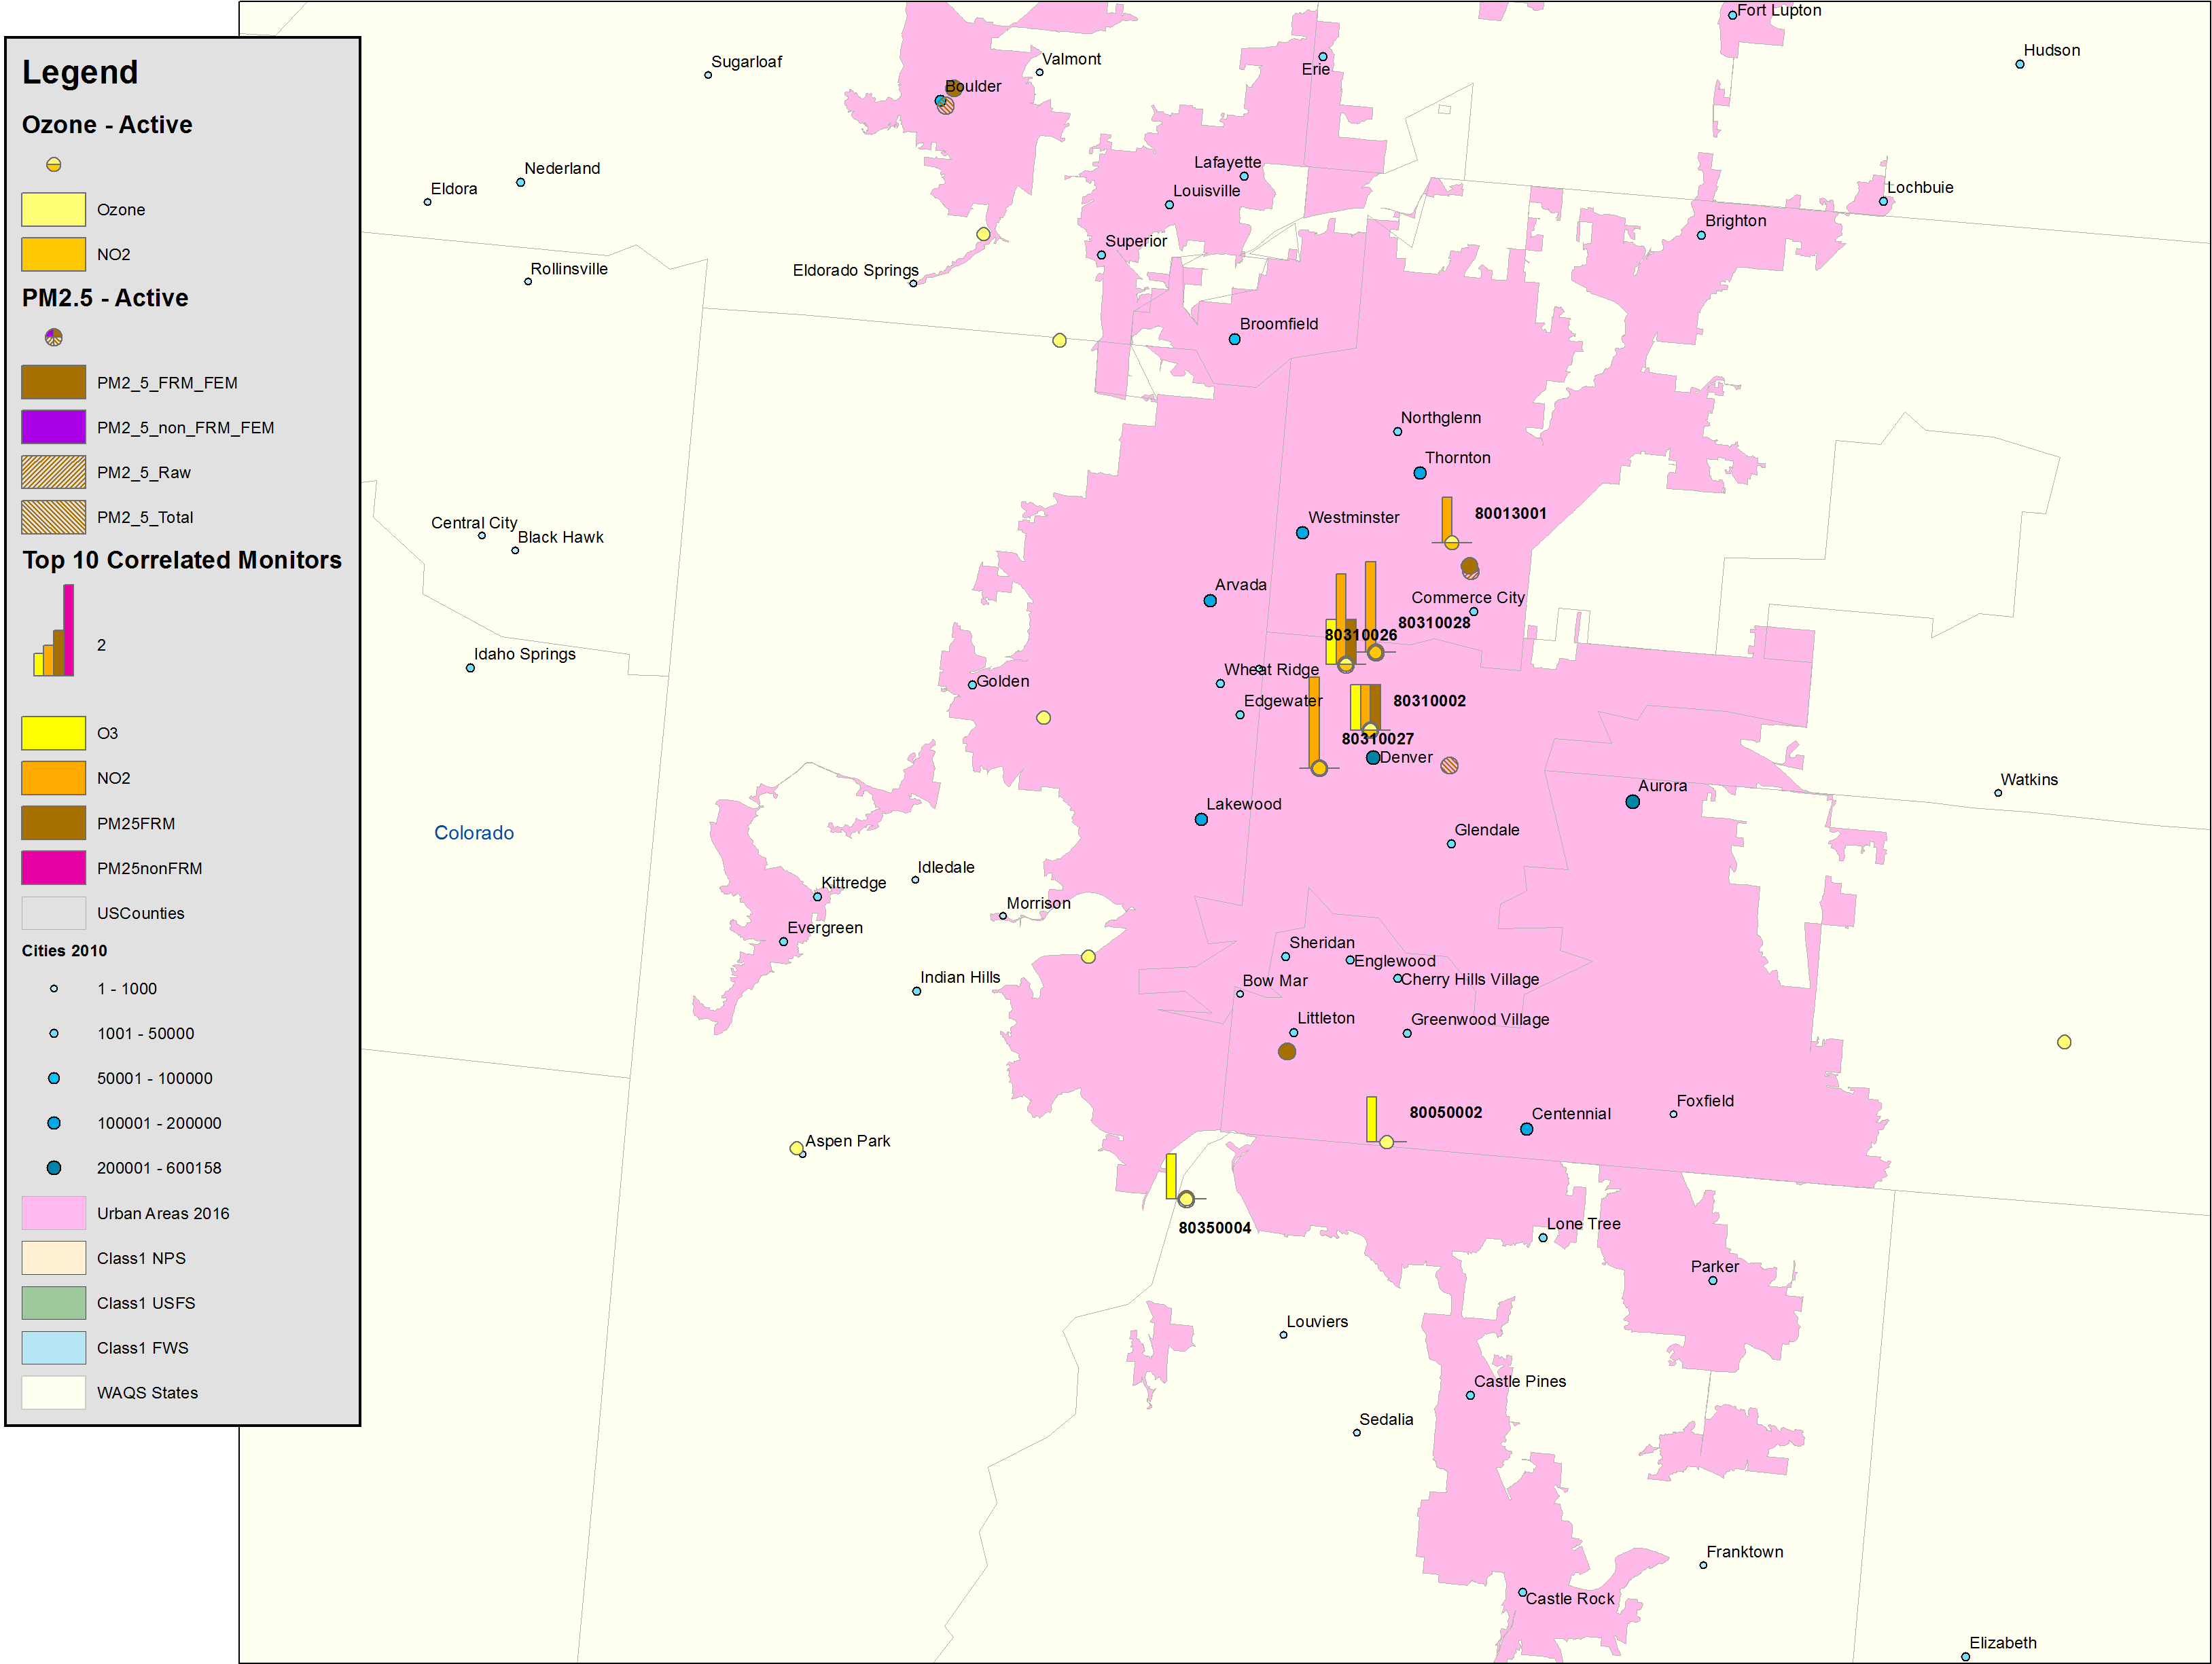
Locations of the top 10 most highly correlated for O3, NO2 and PM2.5
Top 10
Top 10 zoom of Denver Metro Area
Tabular data
Excel spreadsheet with summary data from the correlation analysis.Monitor Correlations
Plot Archive
Plots Regression Analysis - Scatter plots and time series for O3MD8s and daily O3, NO2 and PM2.5Plots Correlograms for O3, NO2 and PM2.5 monitors
Representative Area
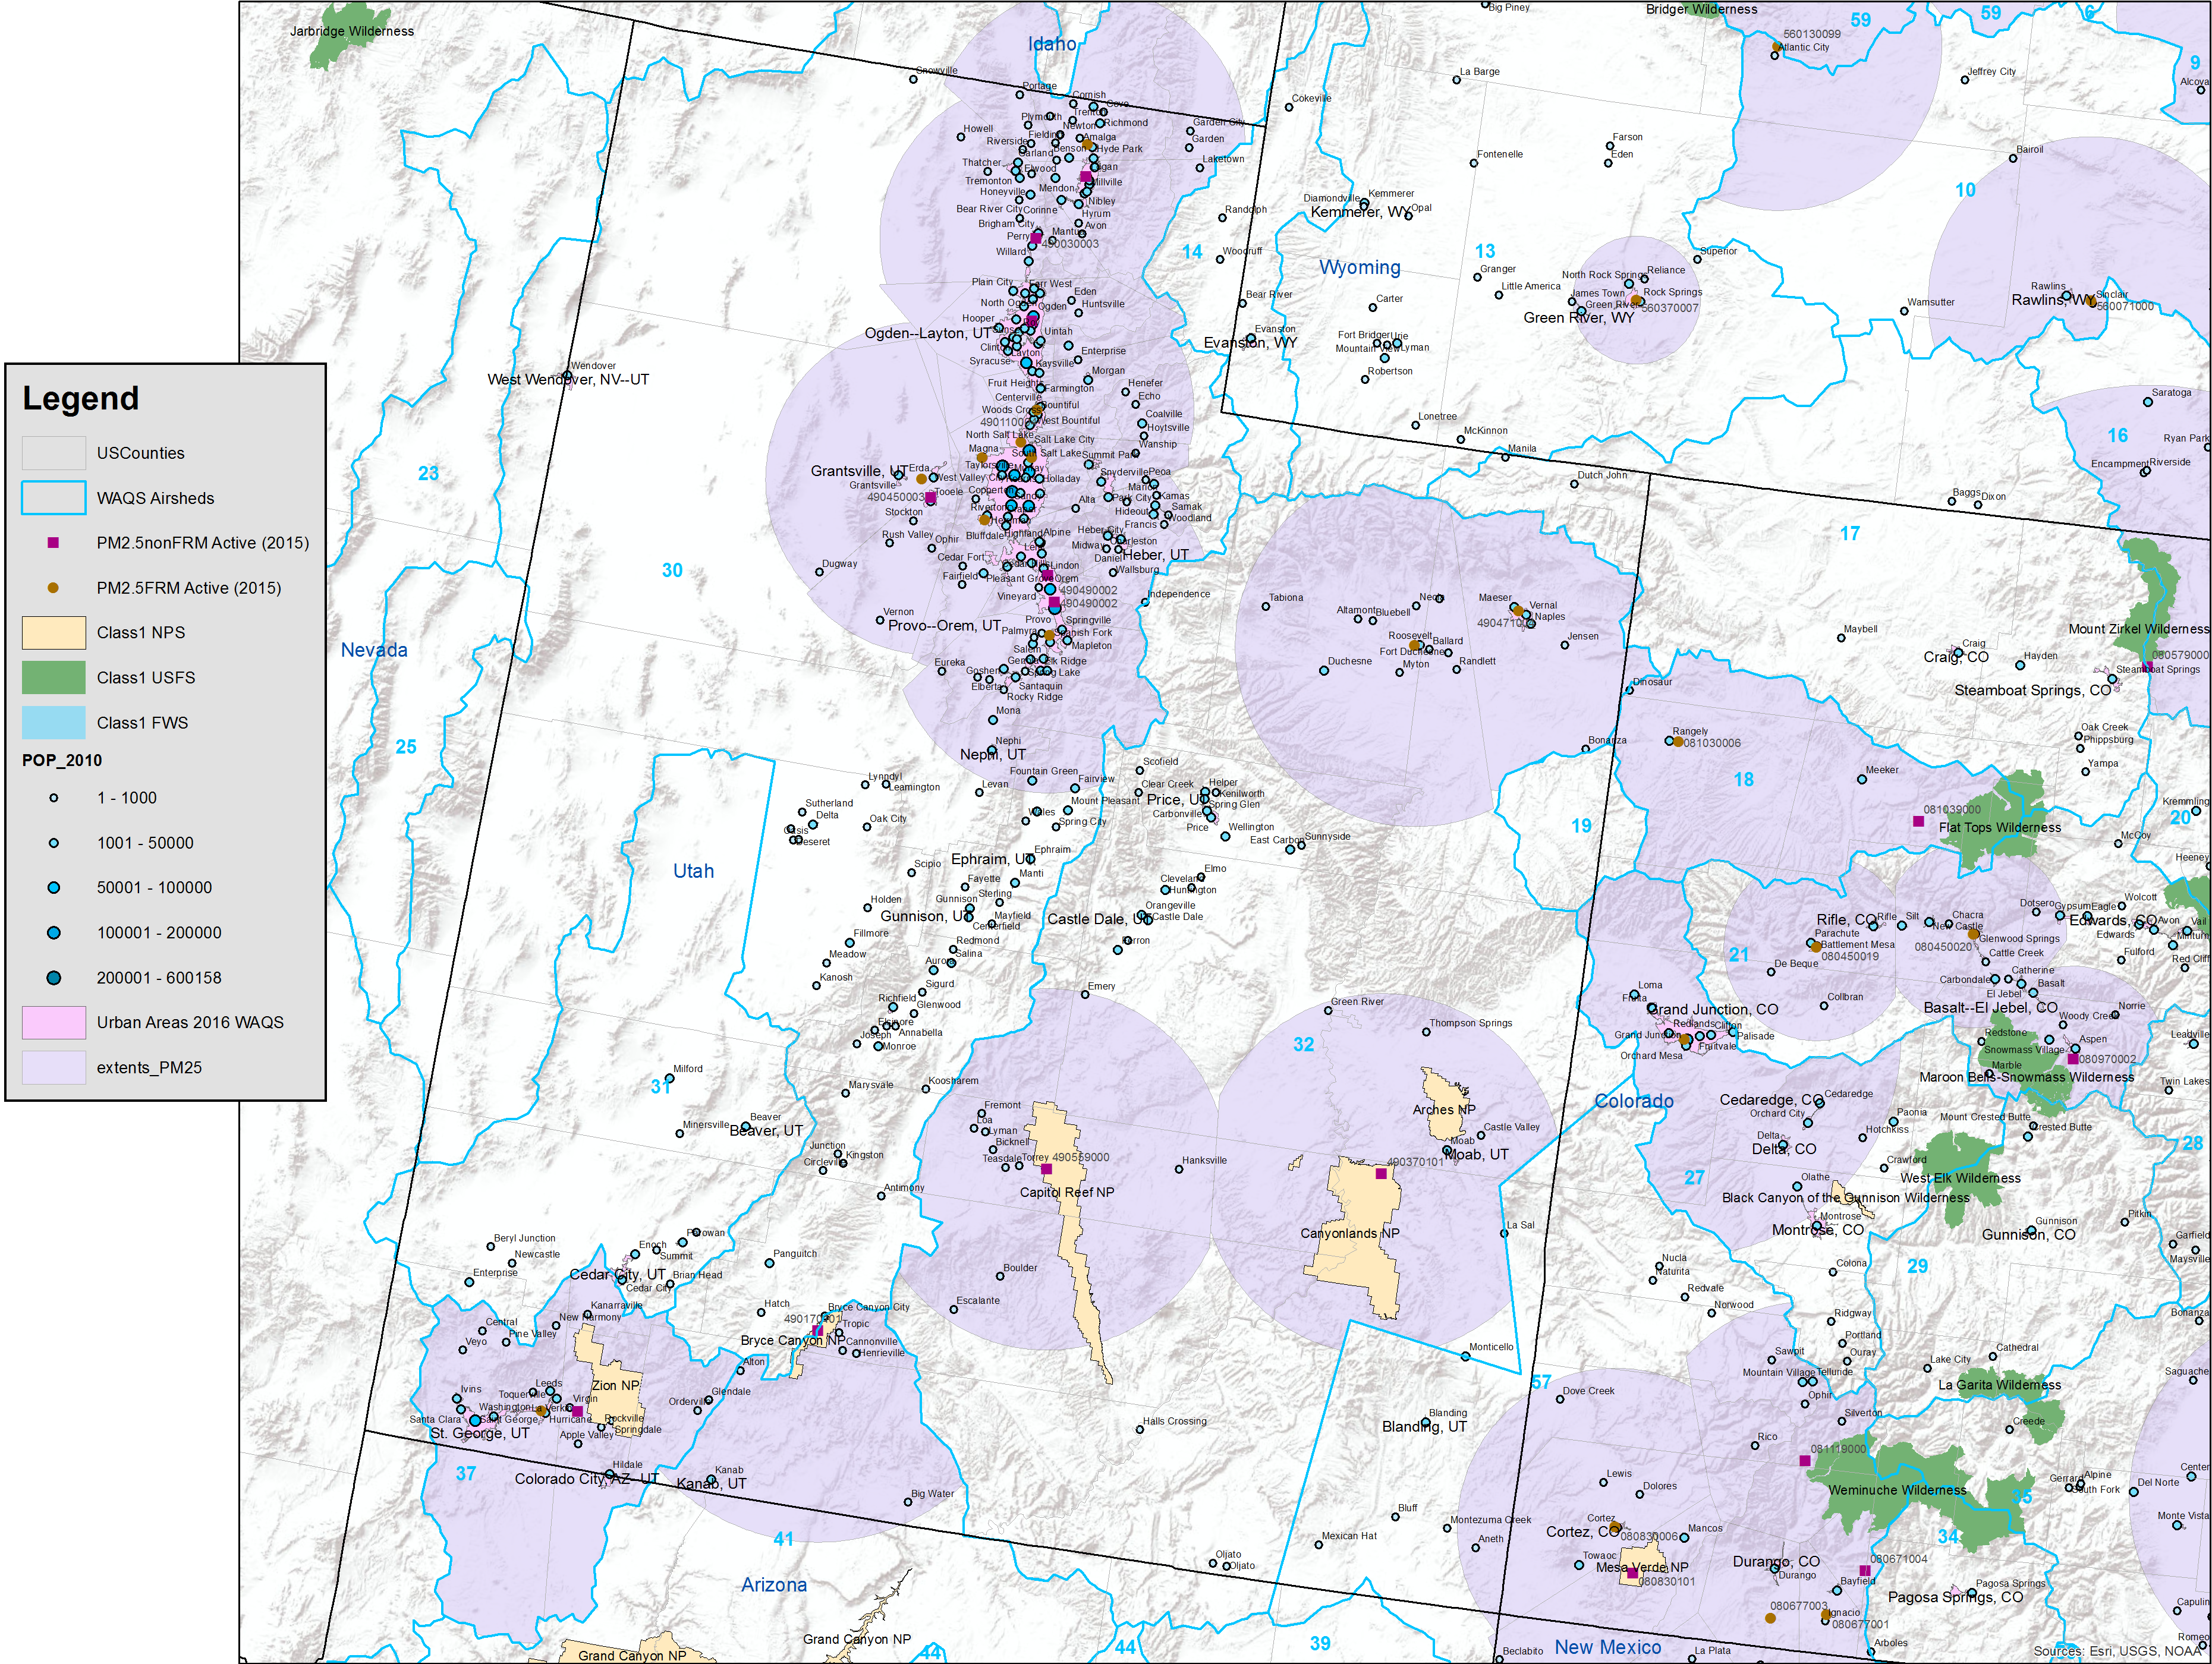
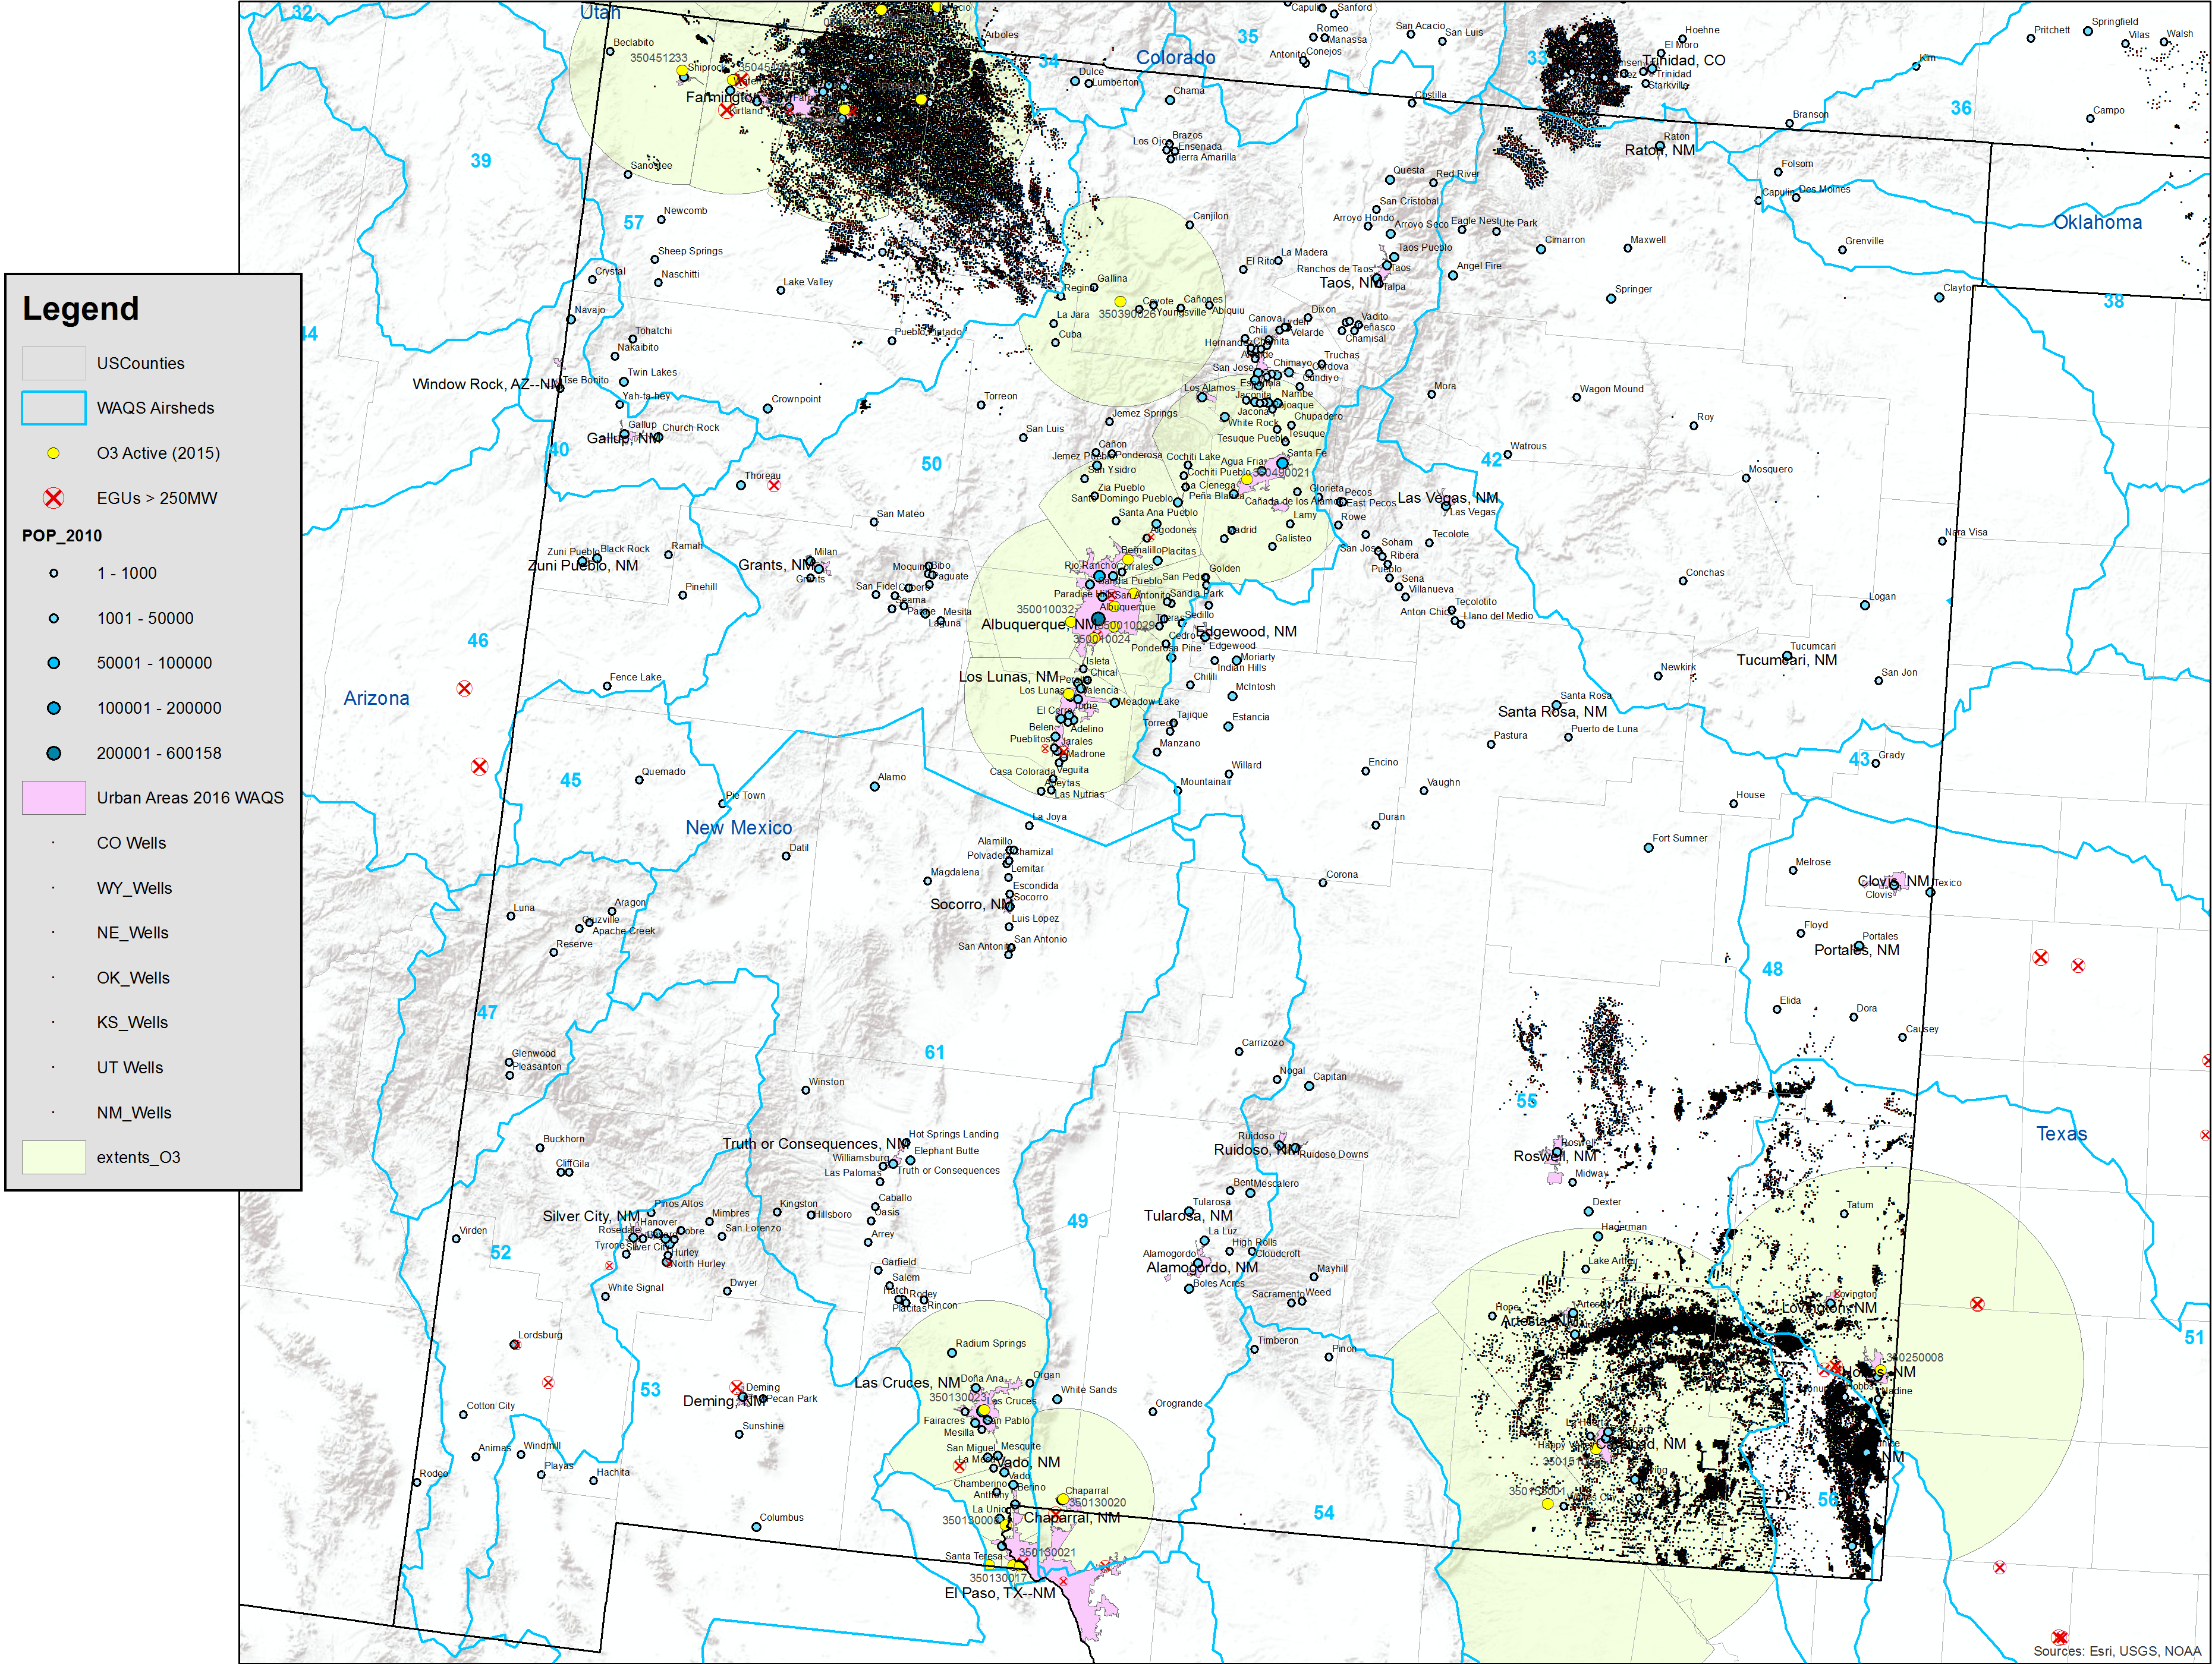
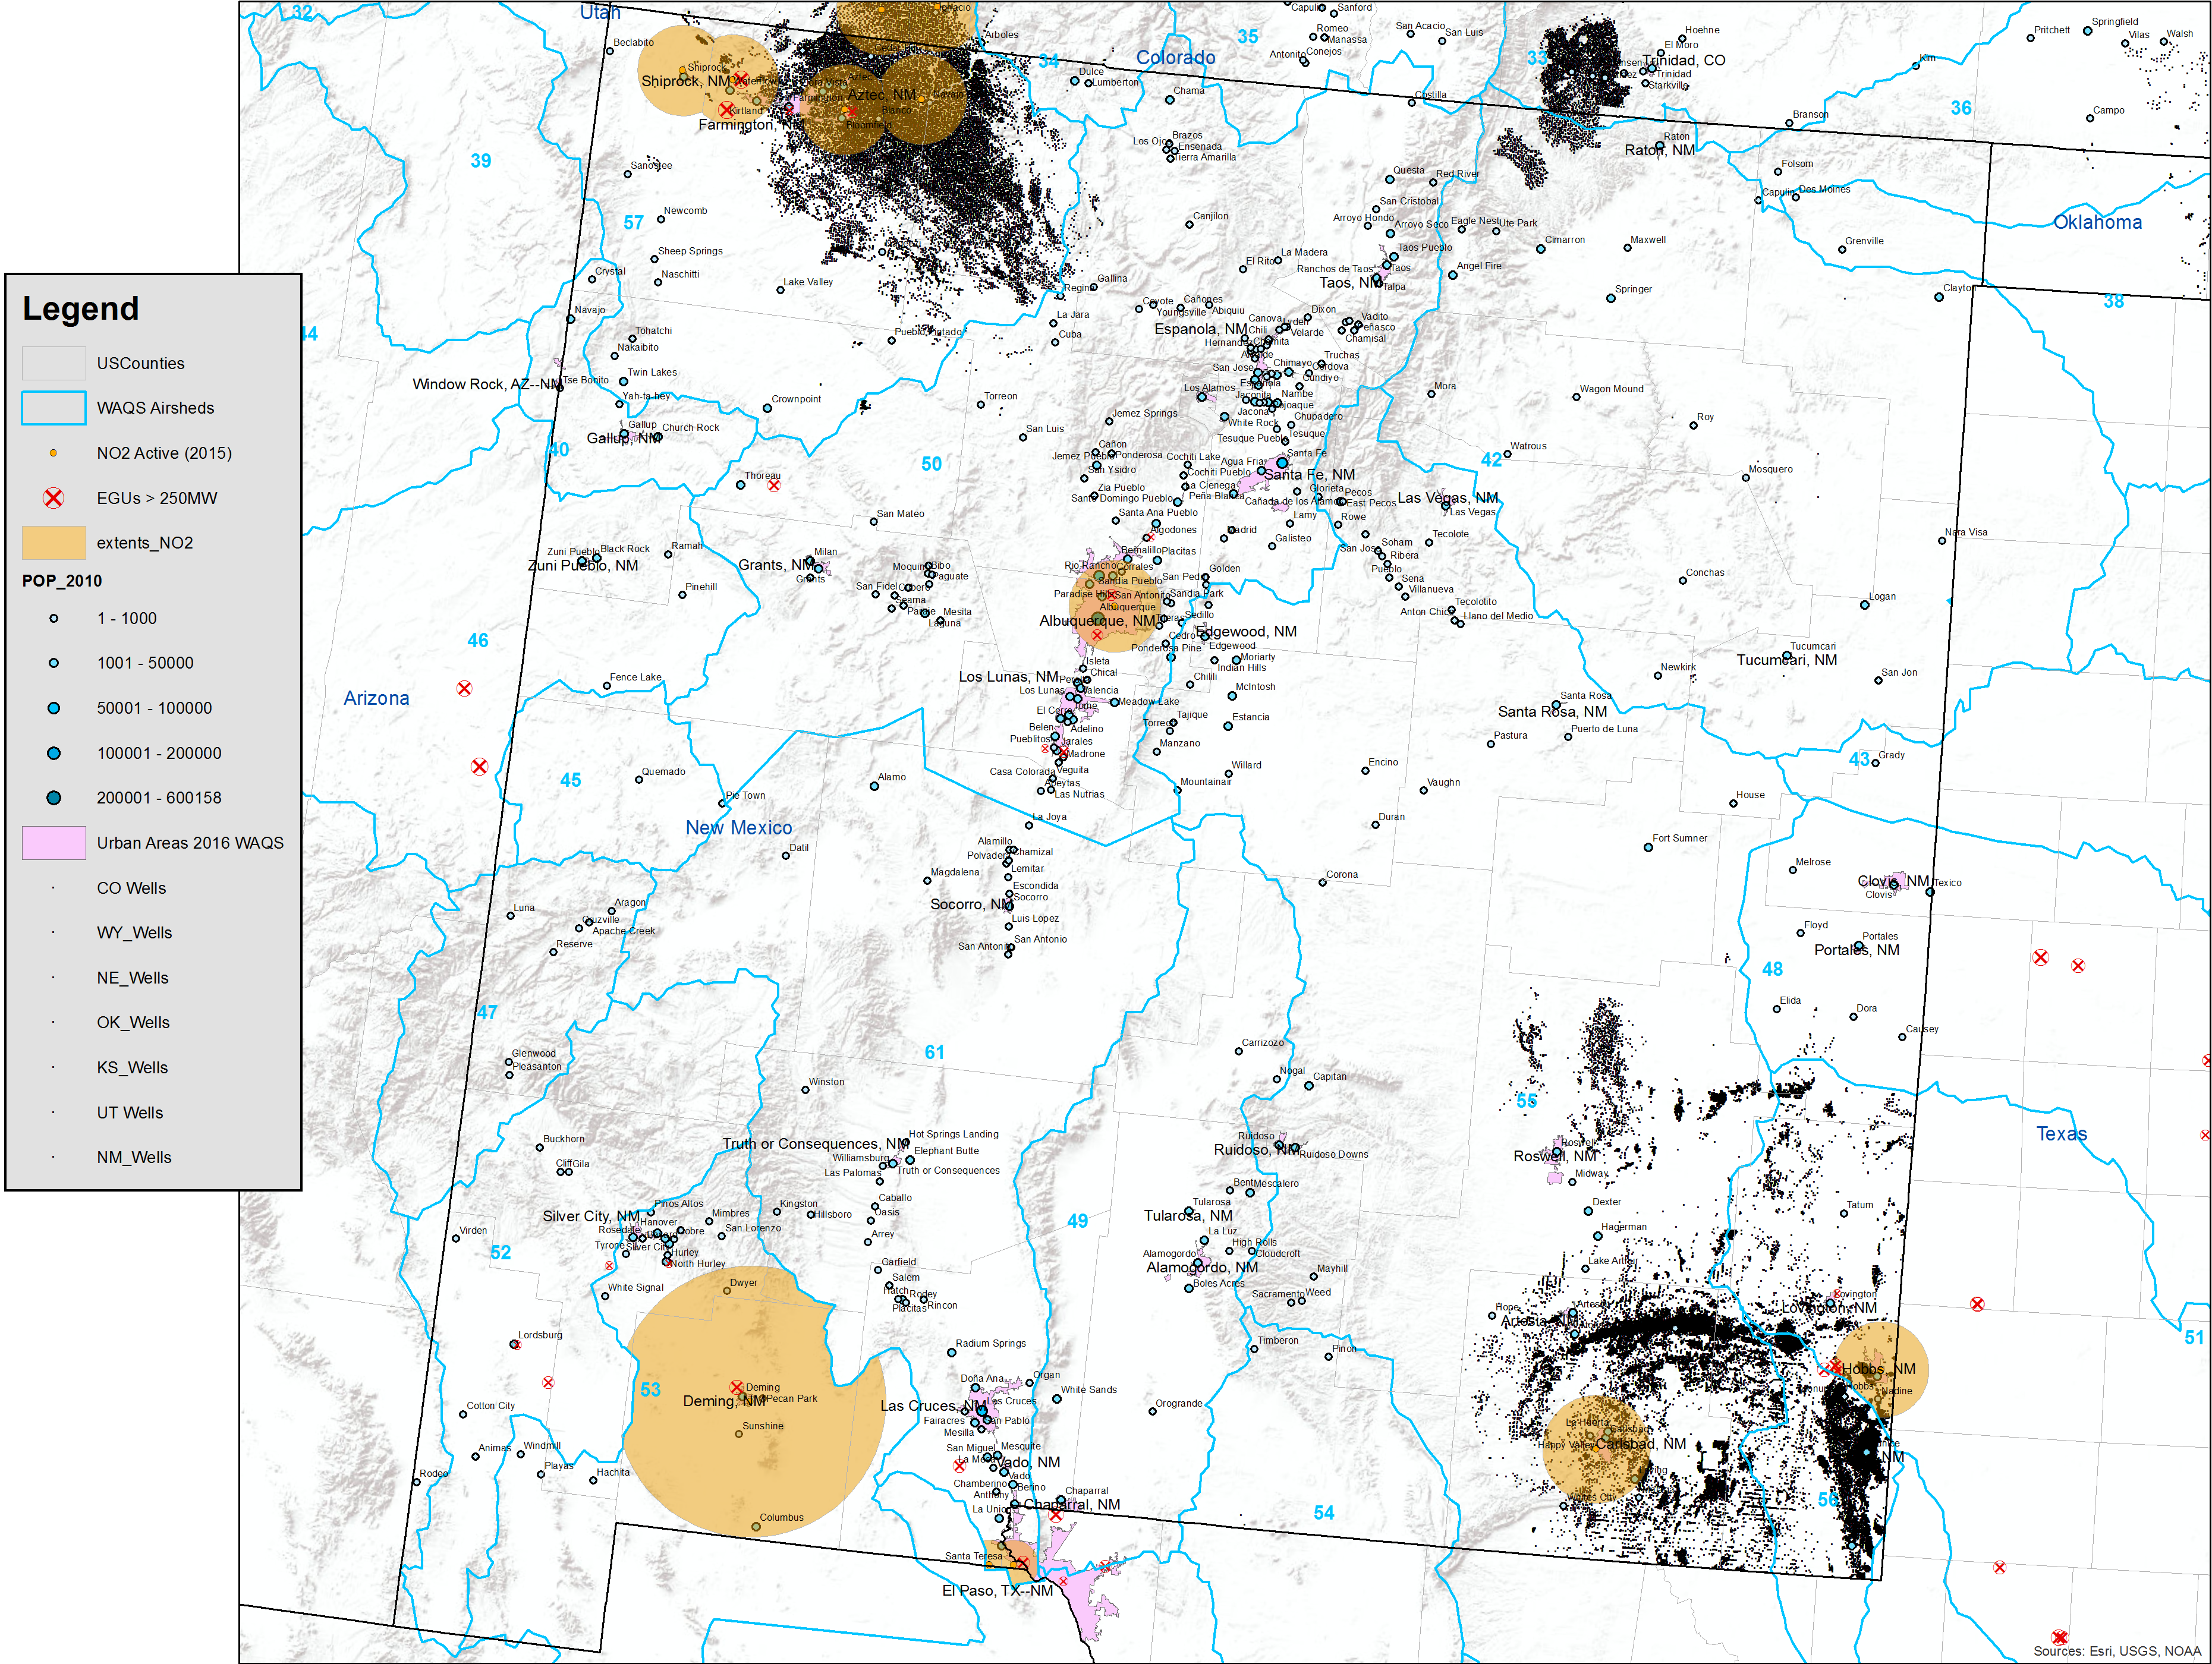
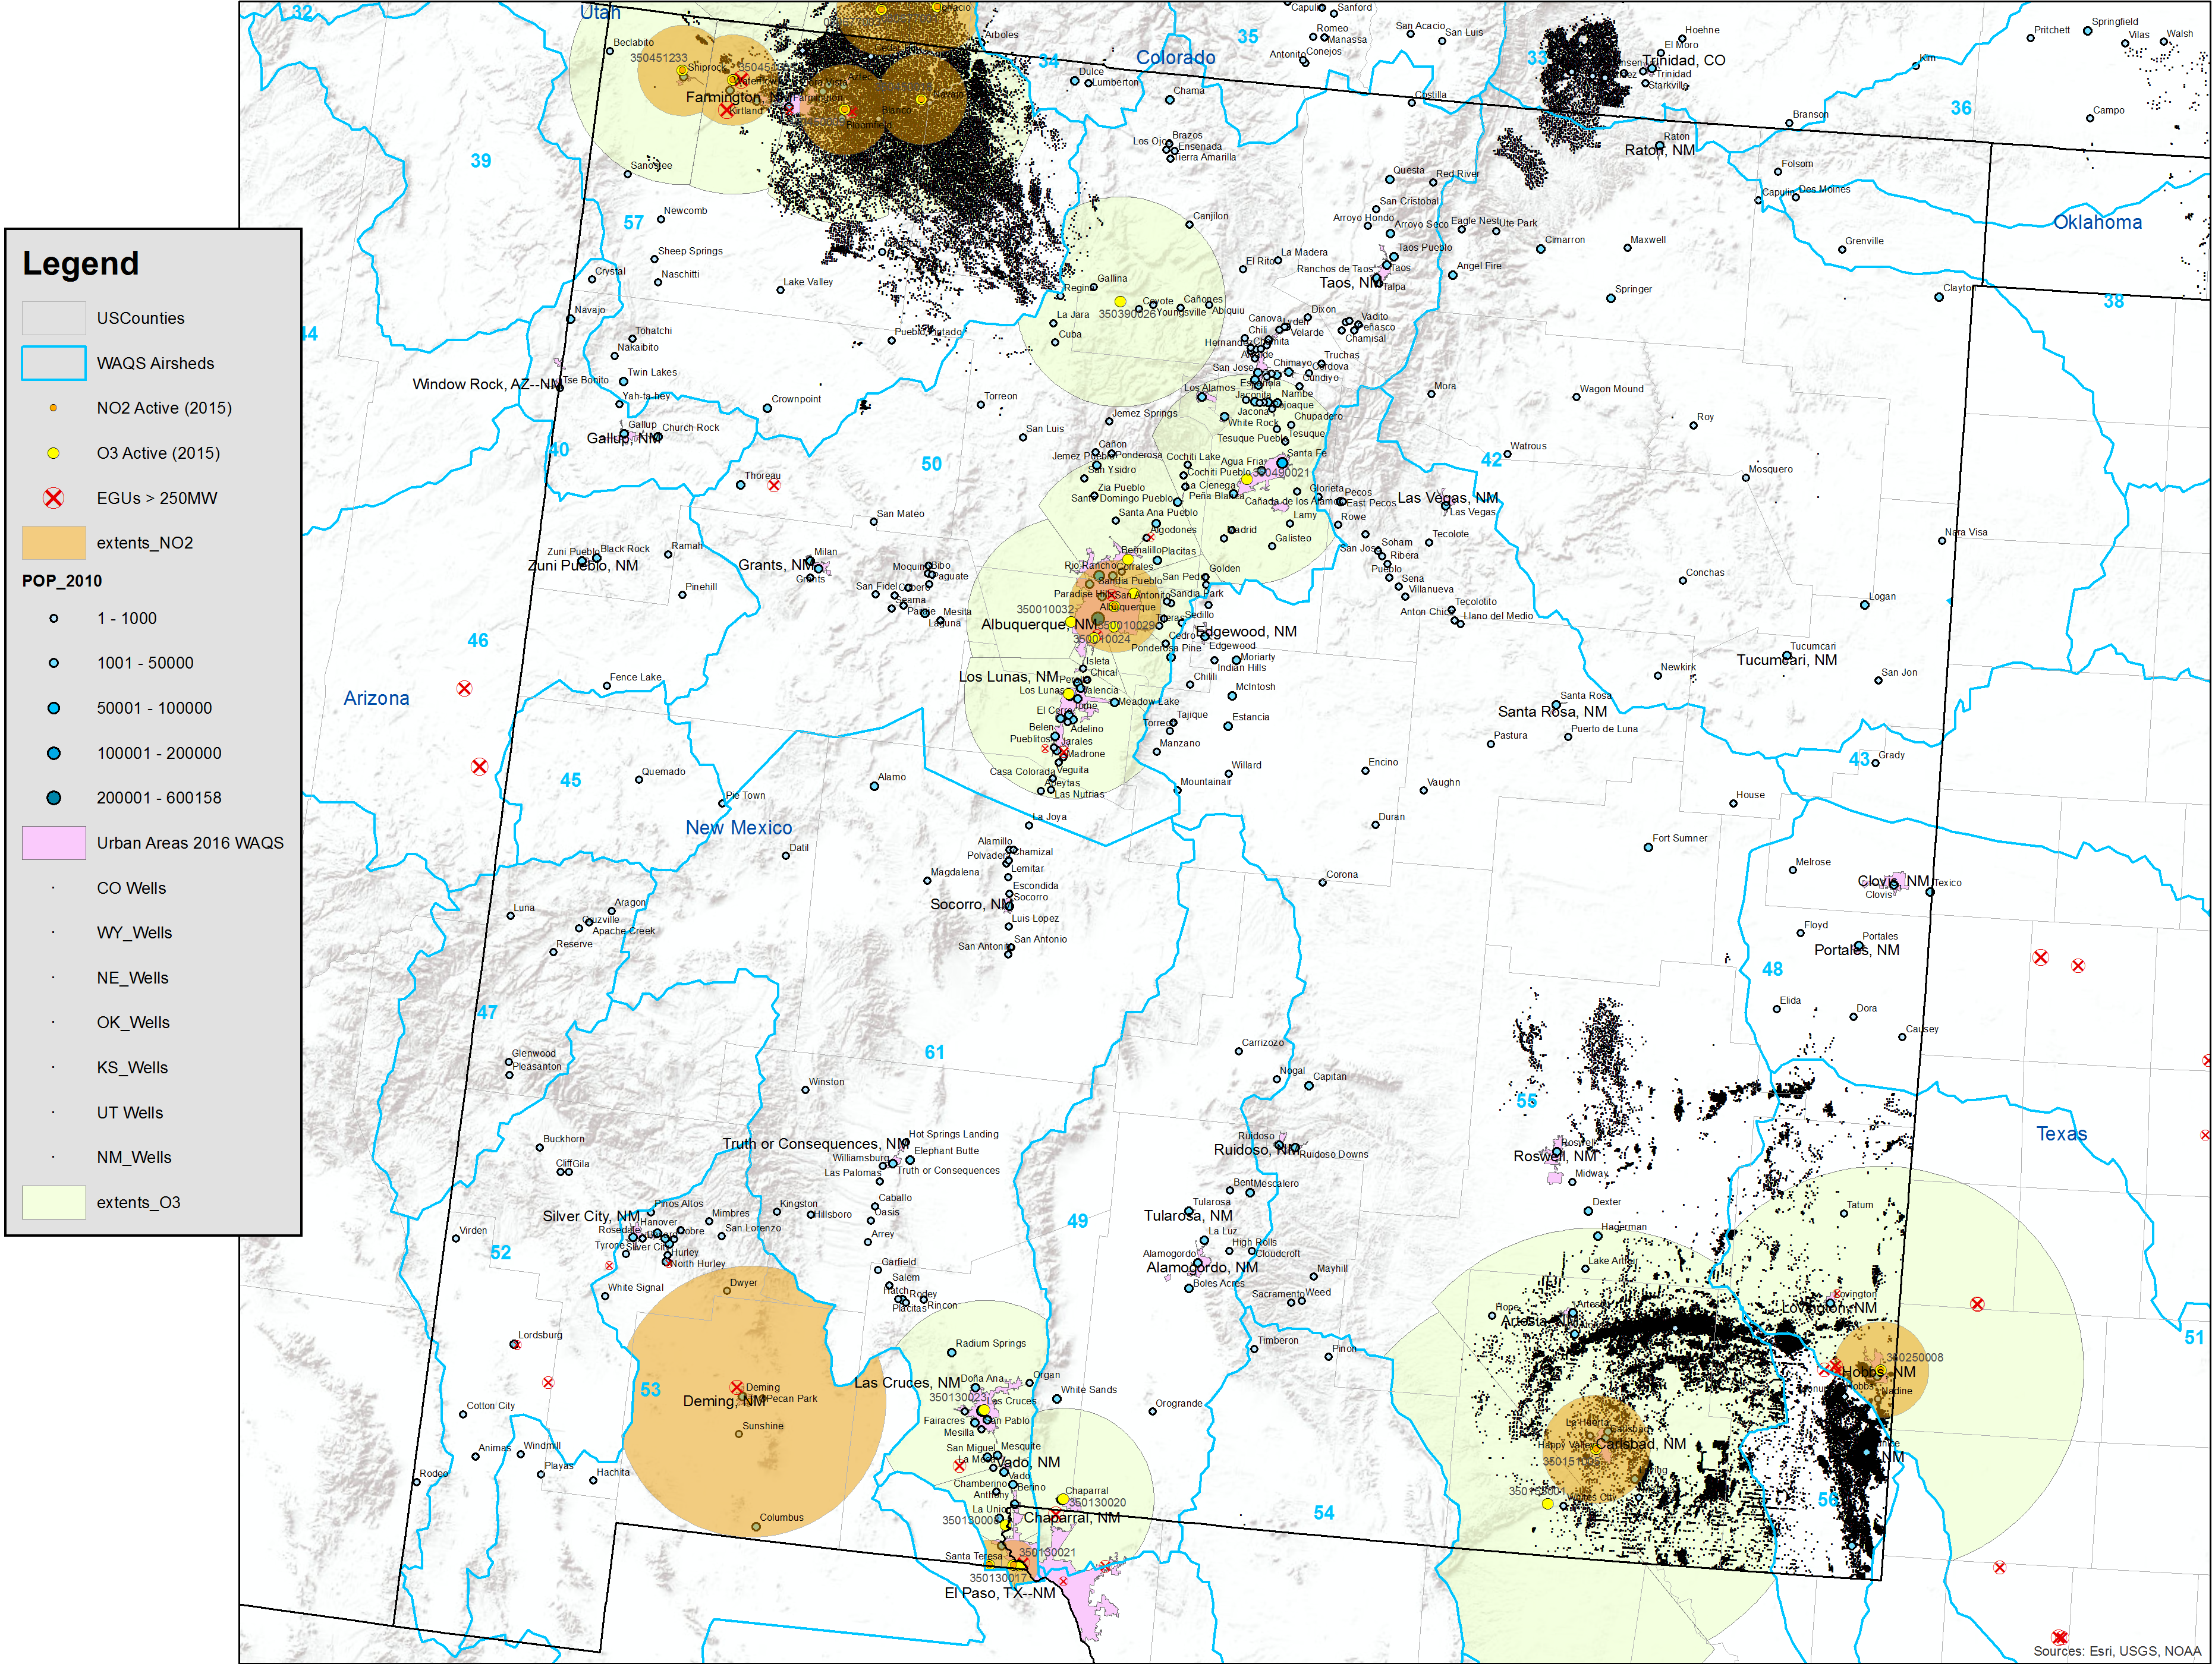
Gap Analysis
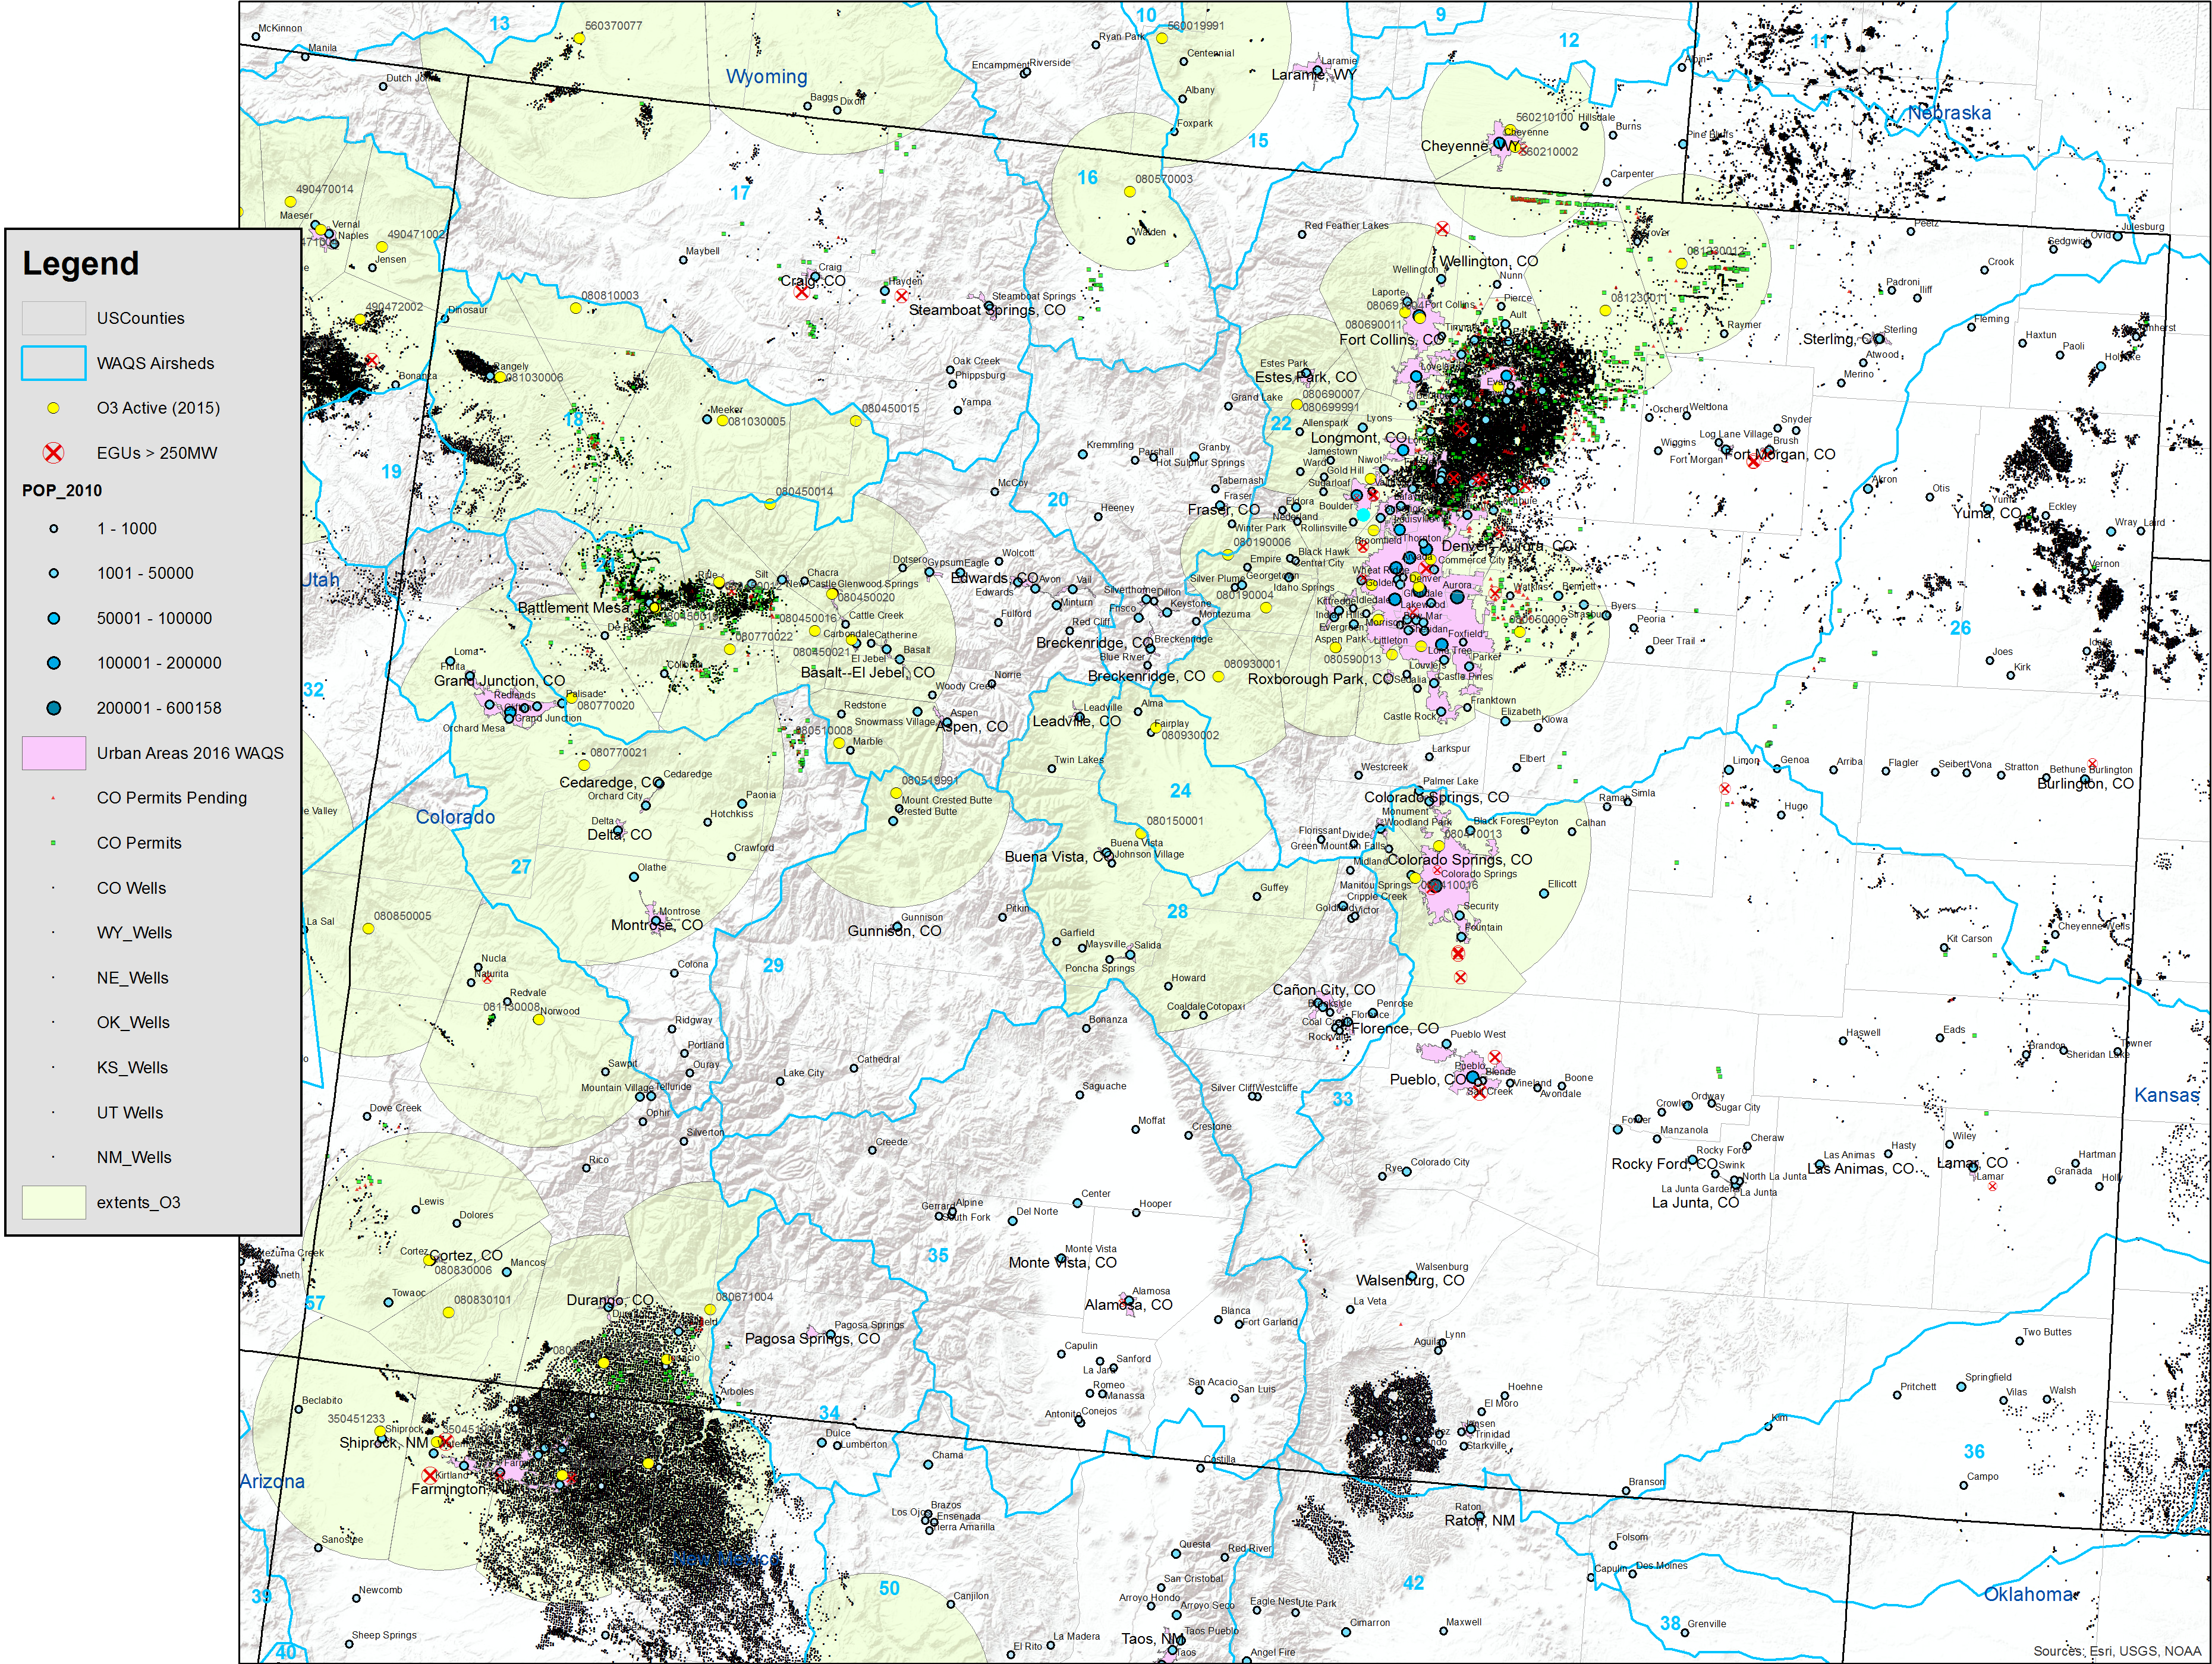
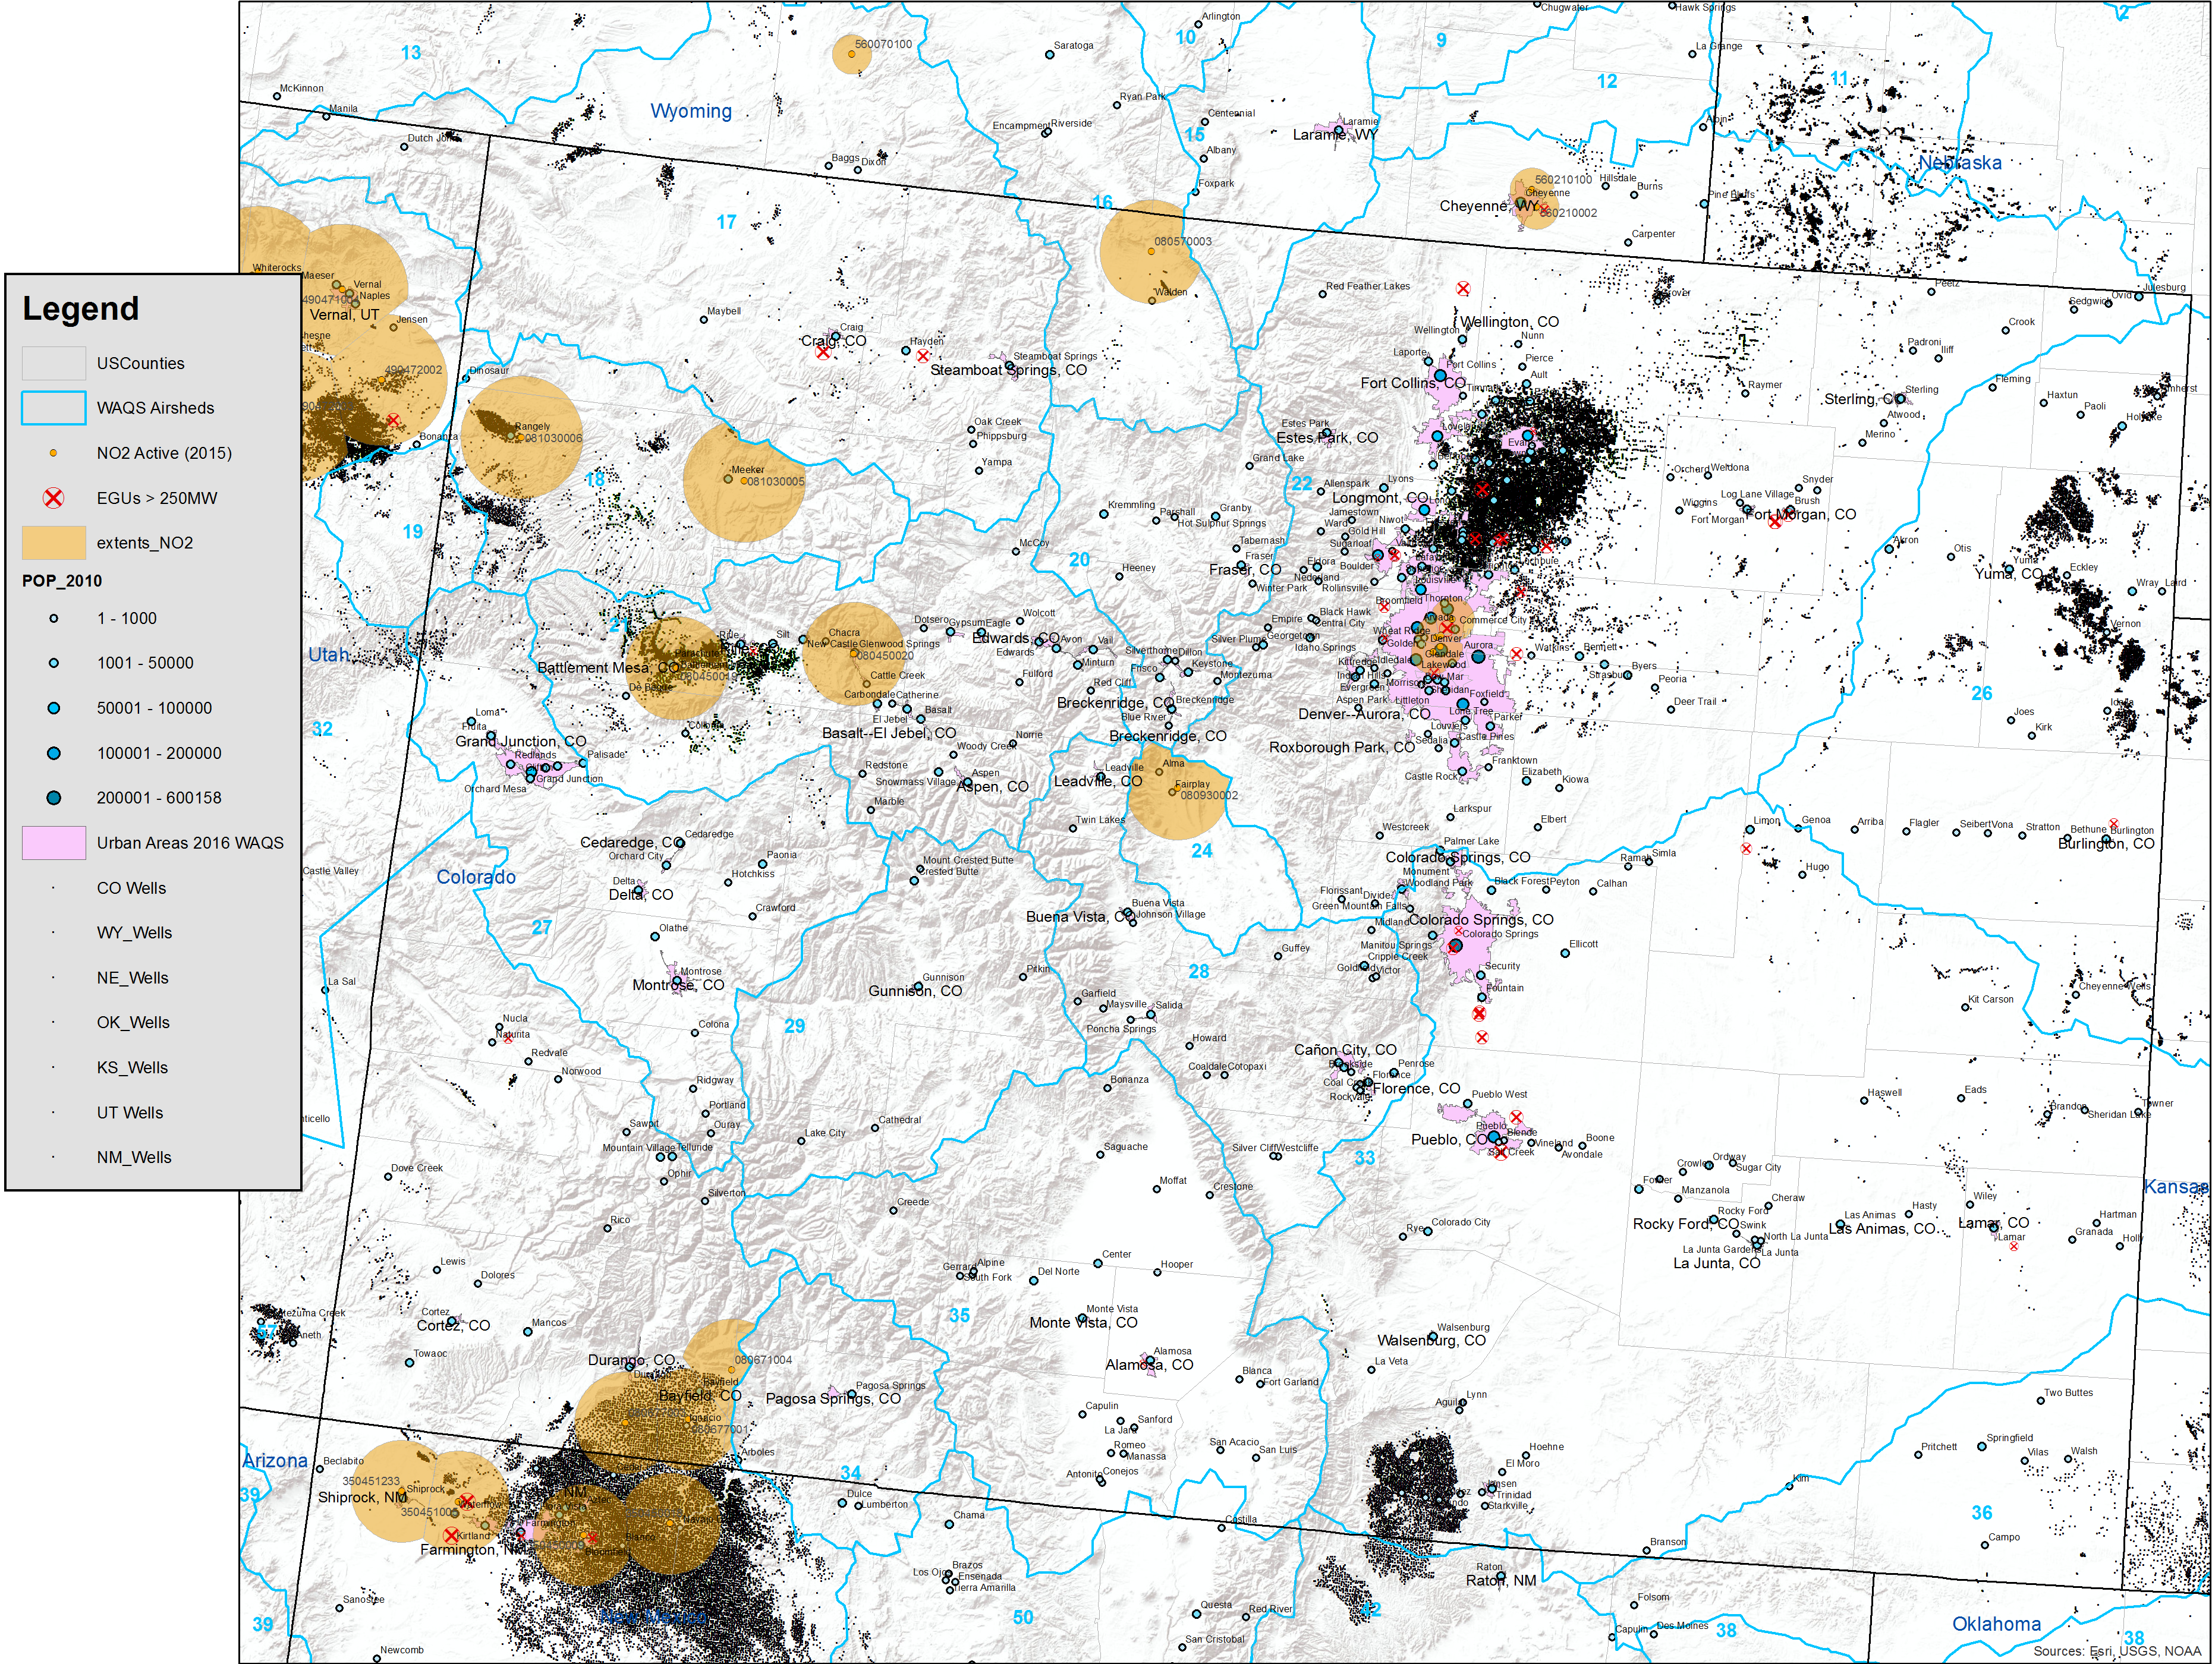
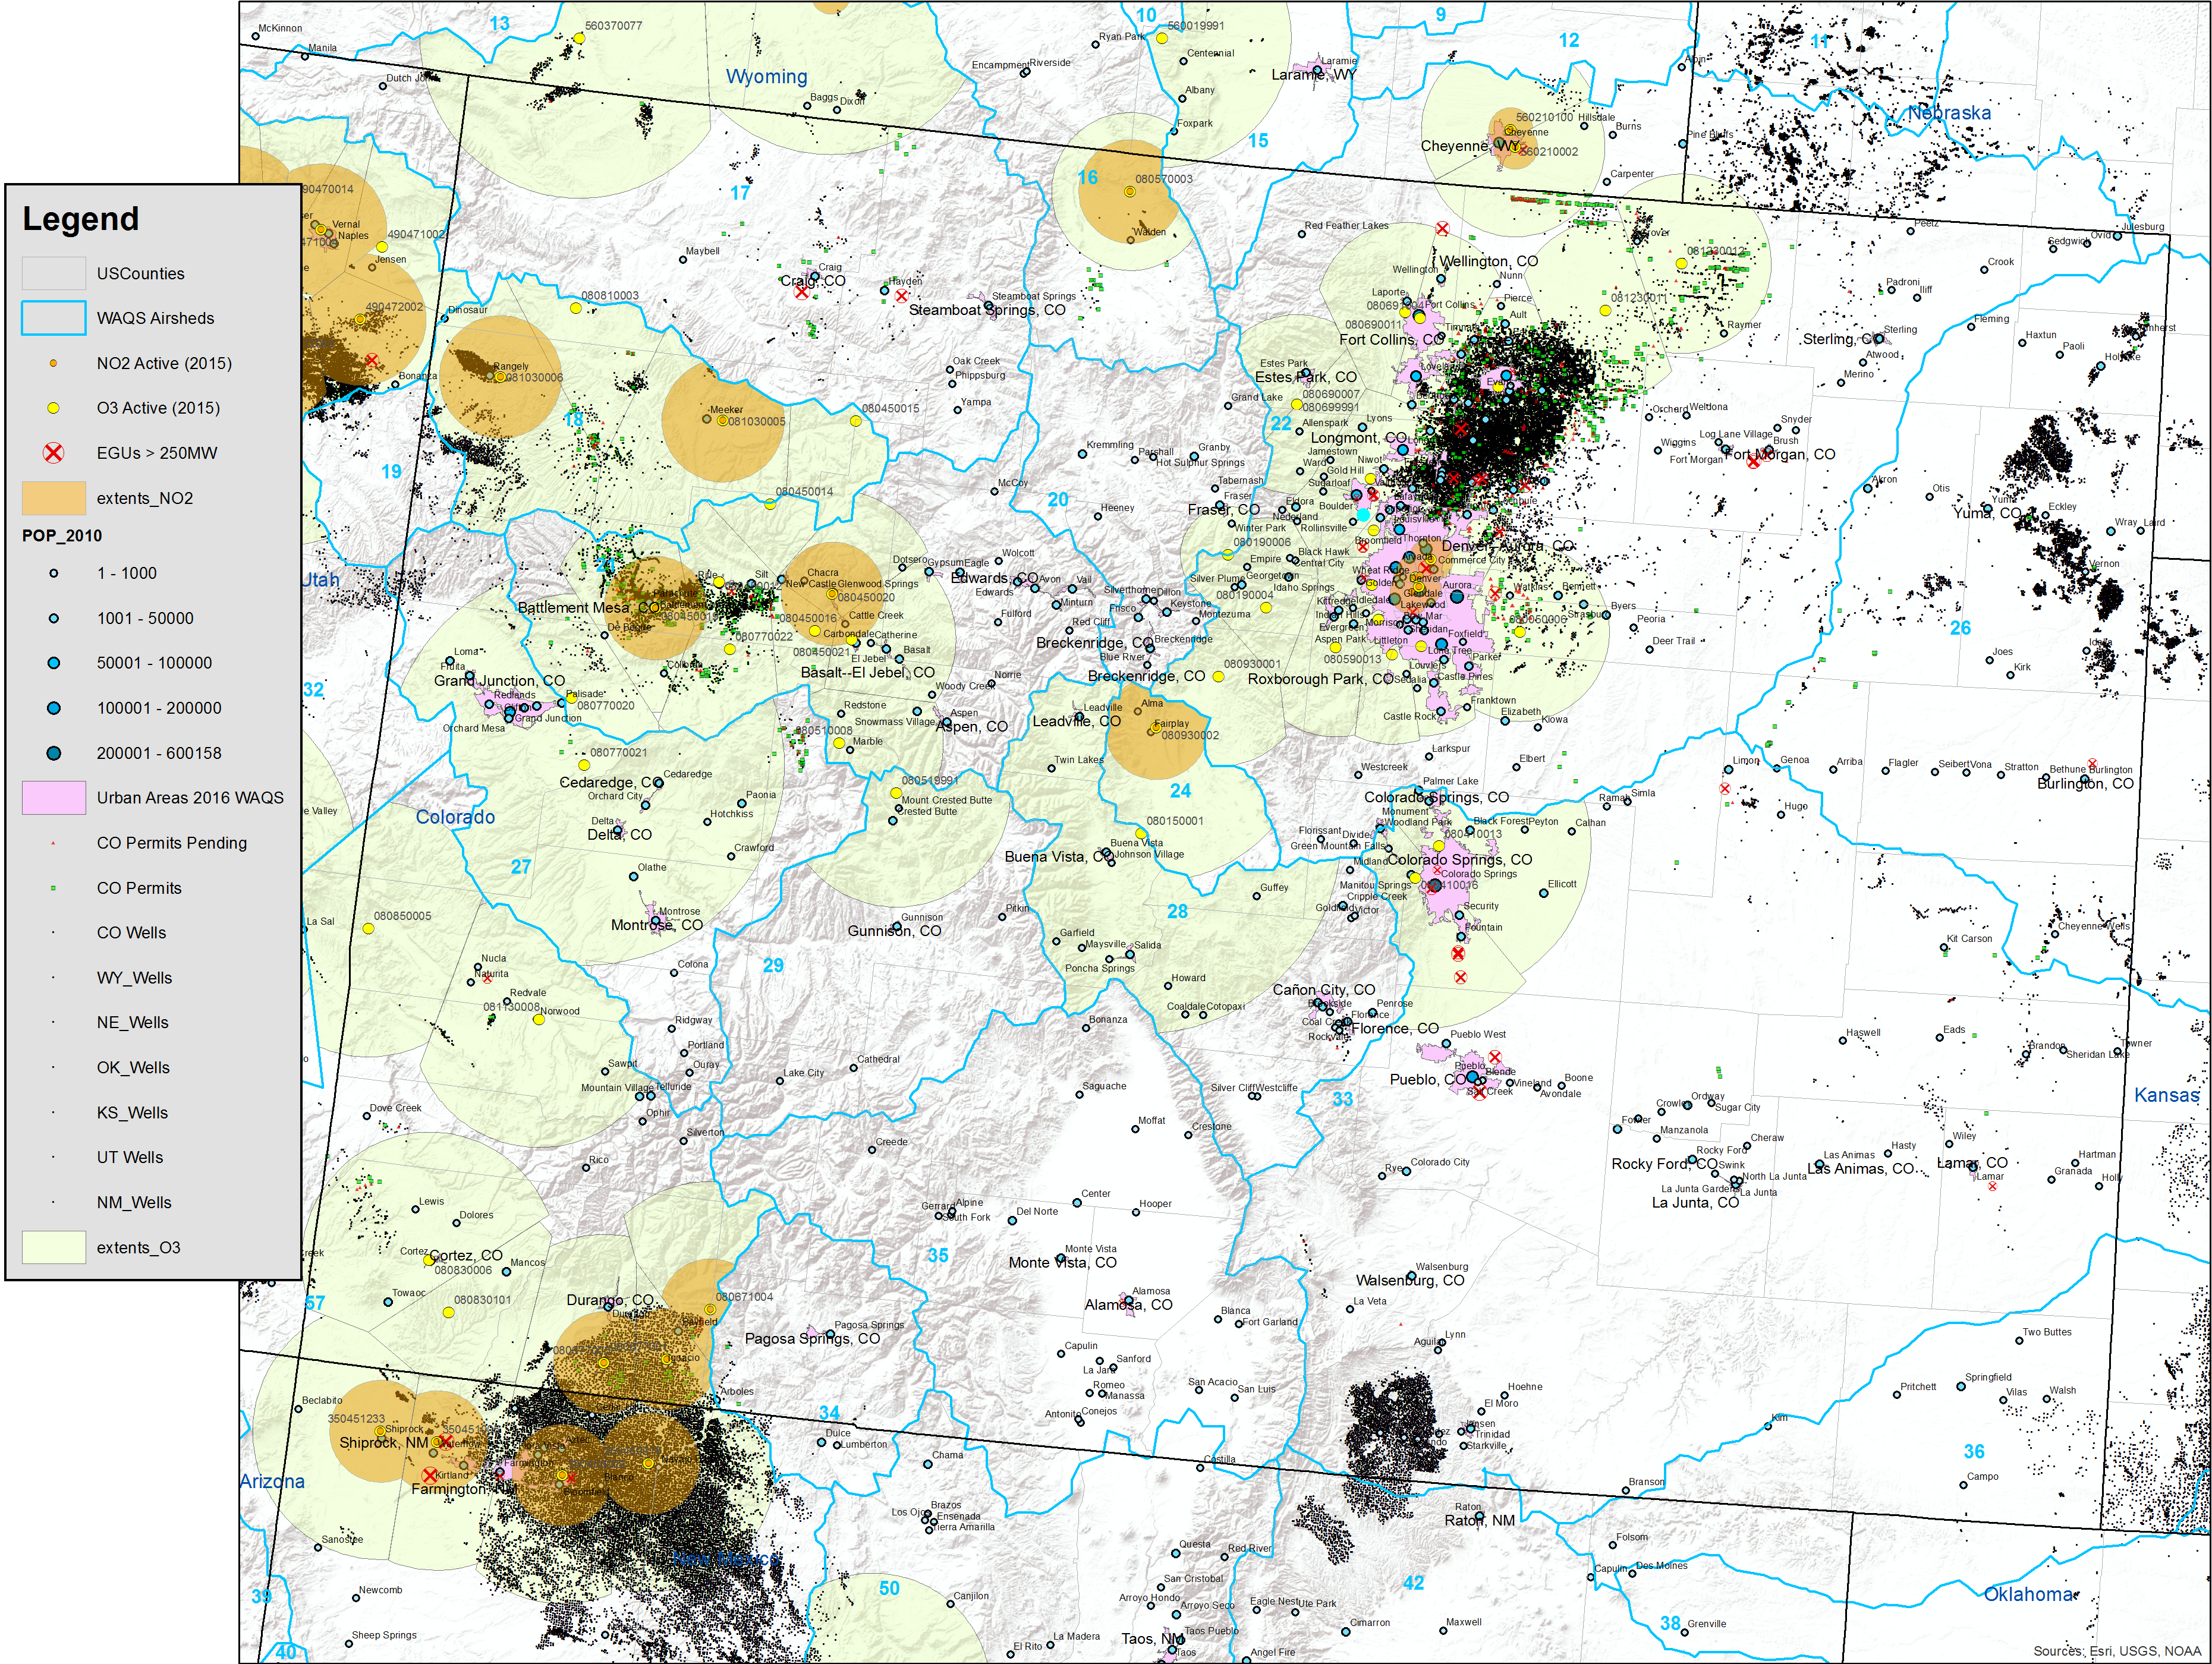
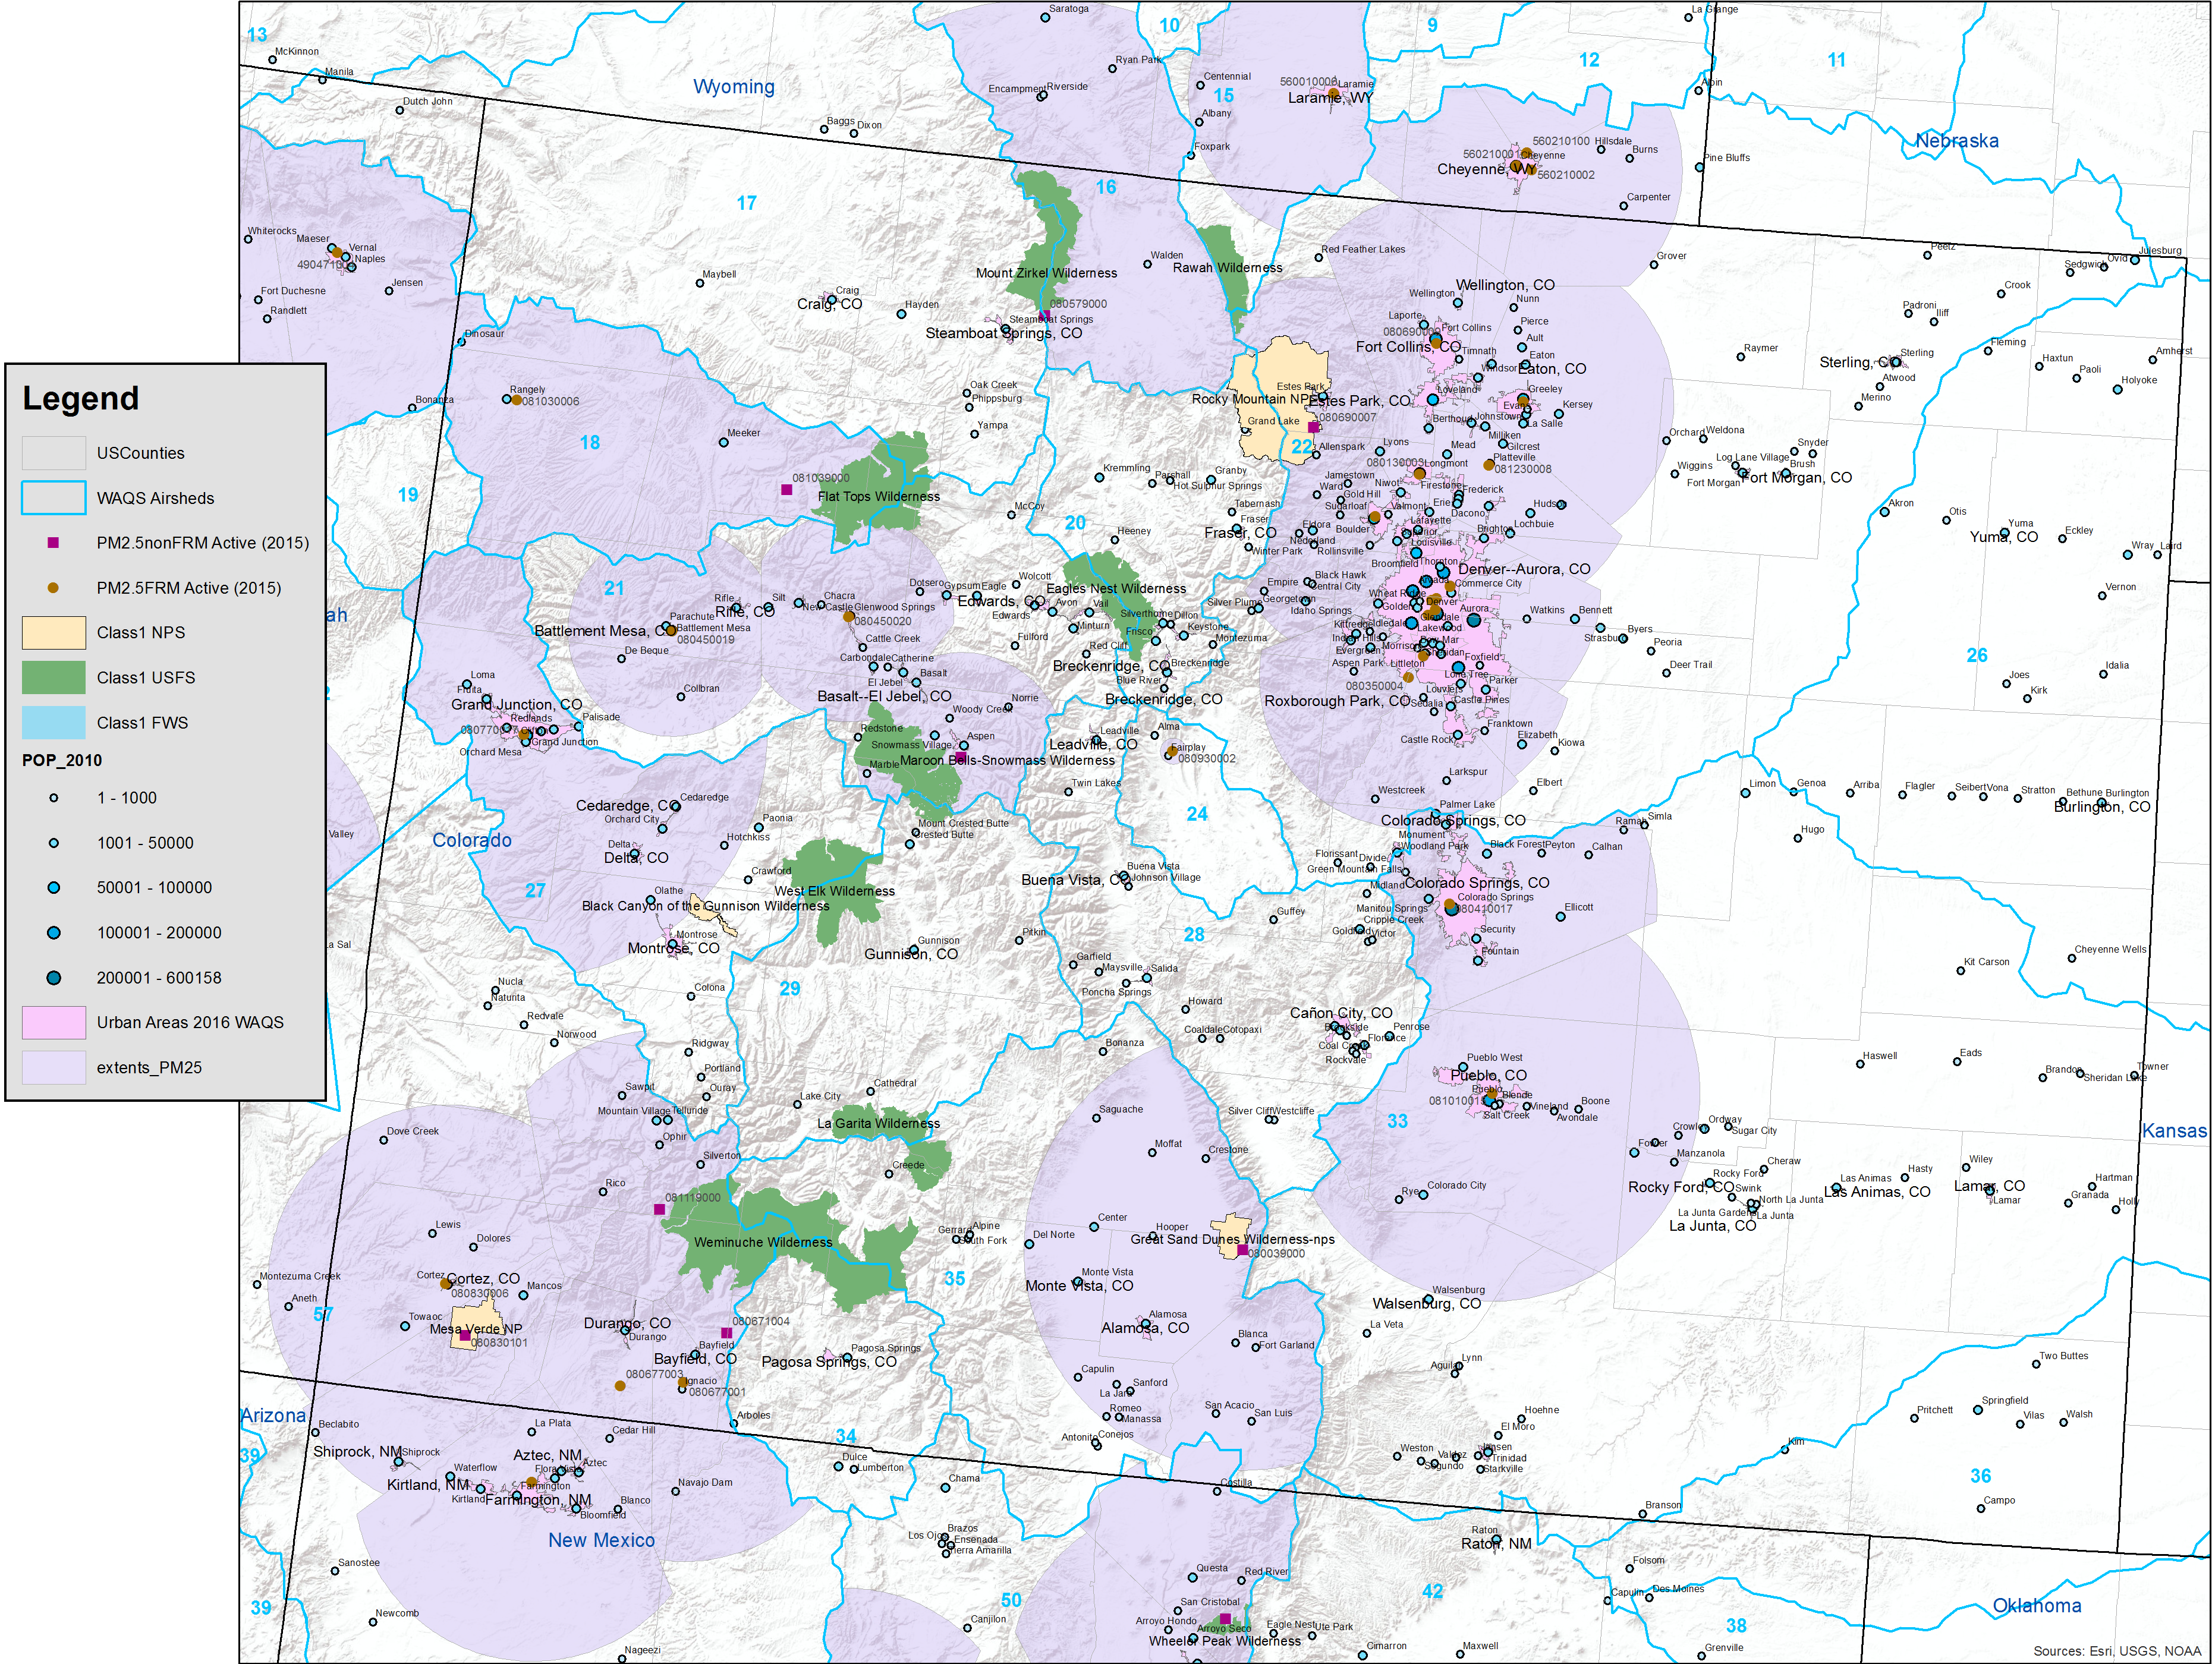
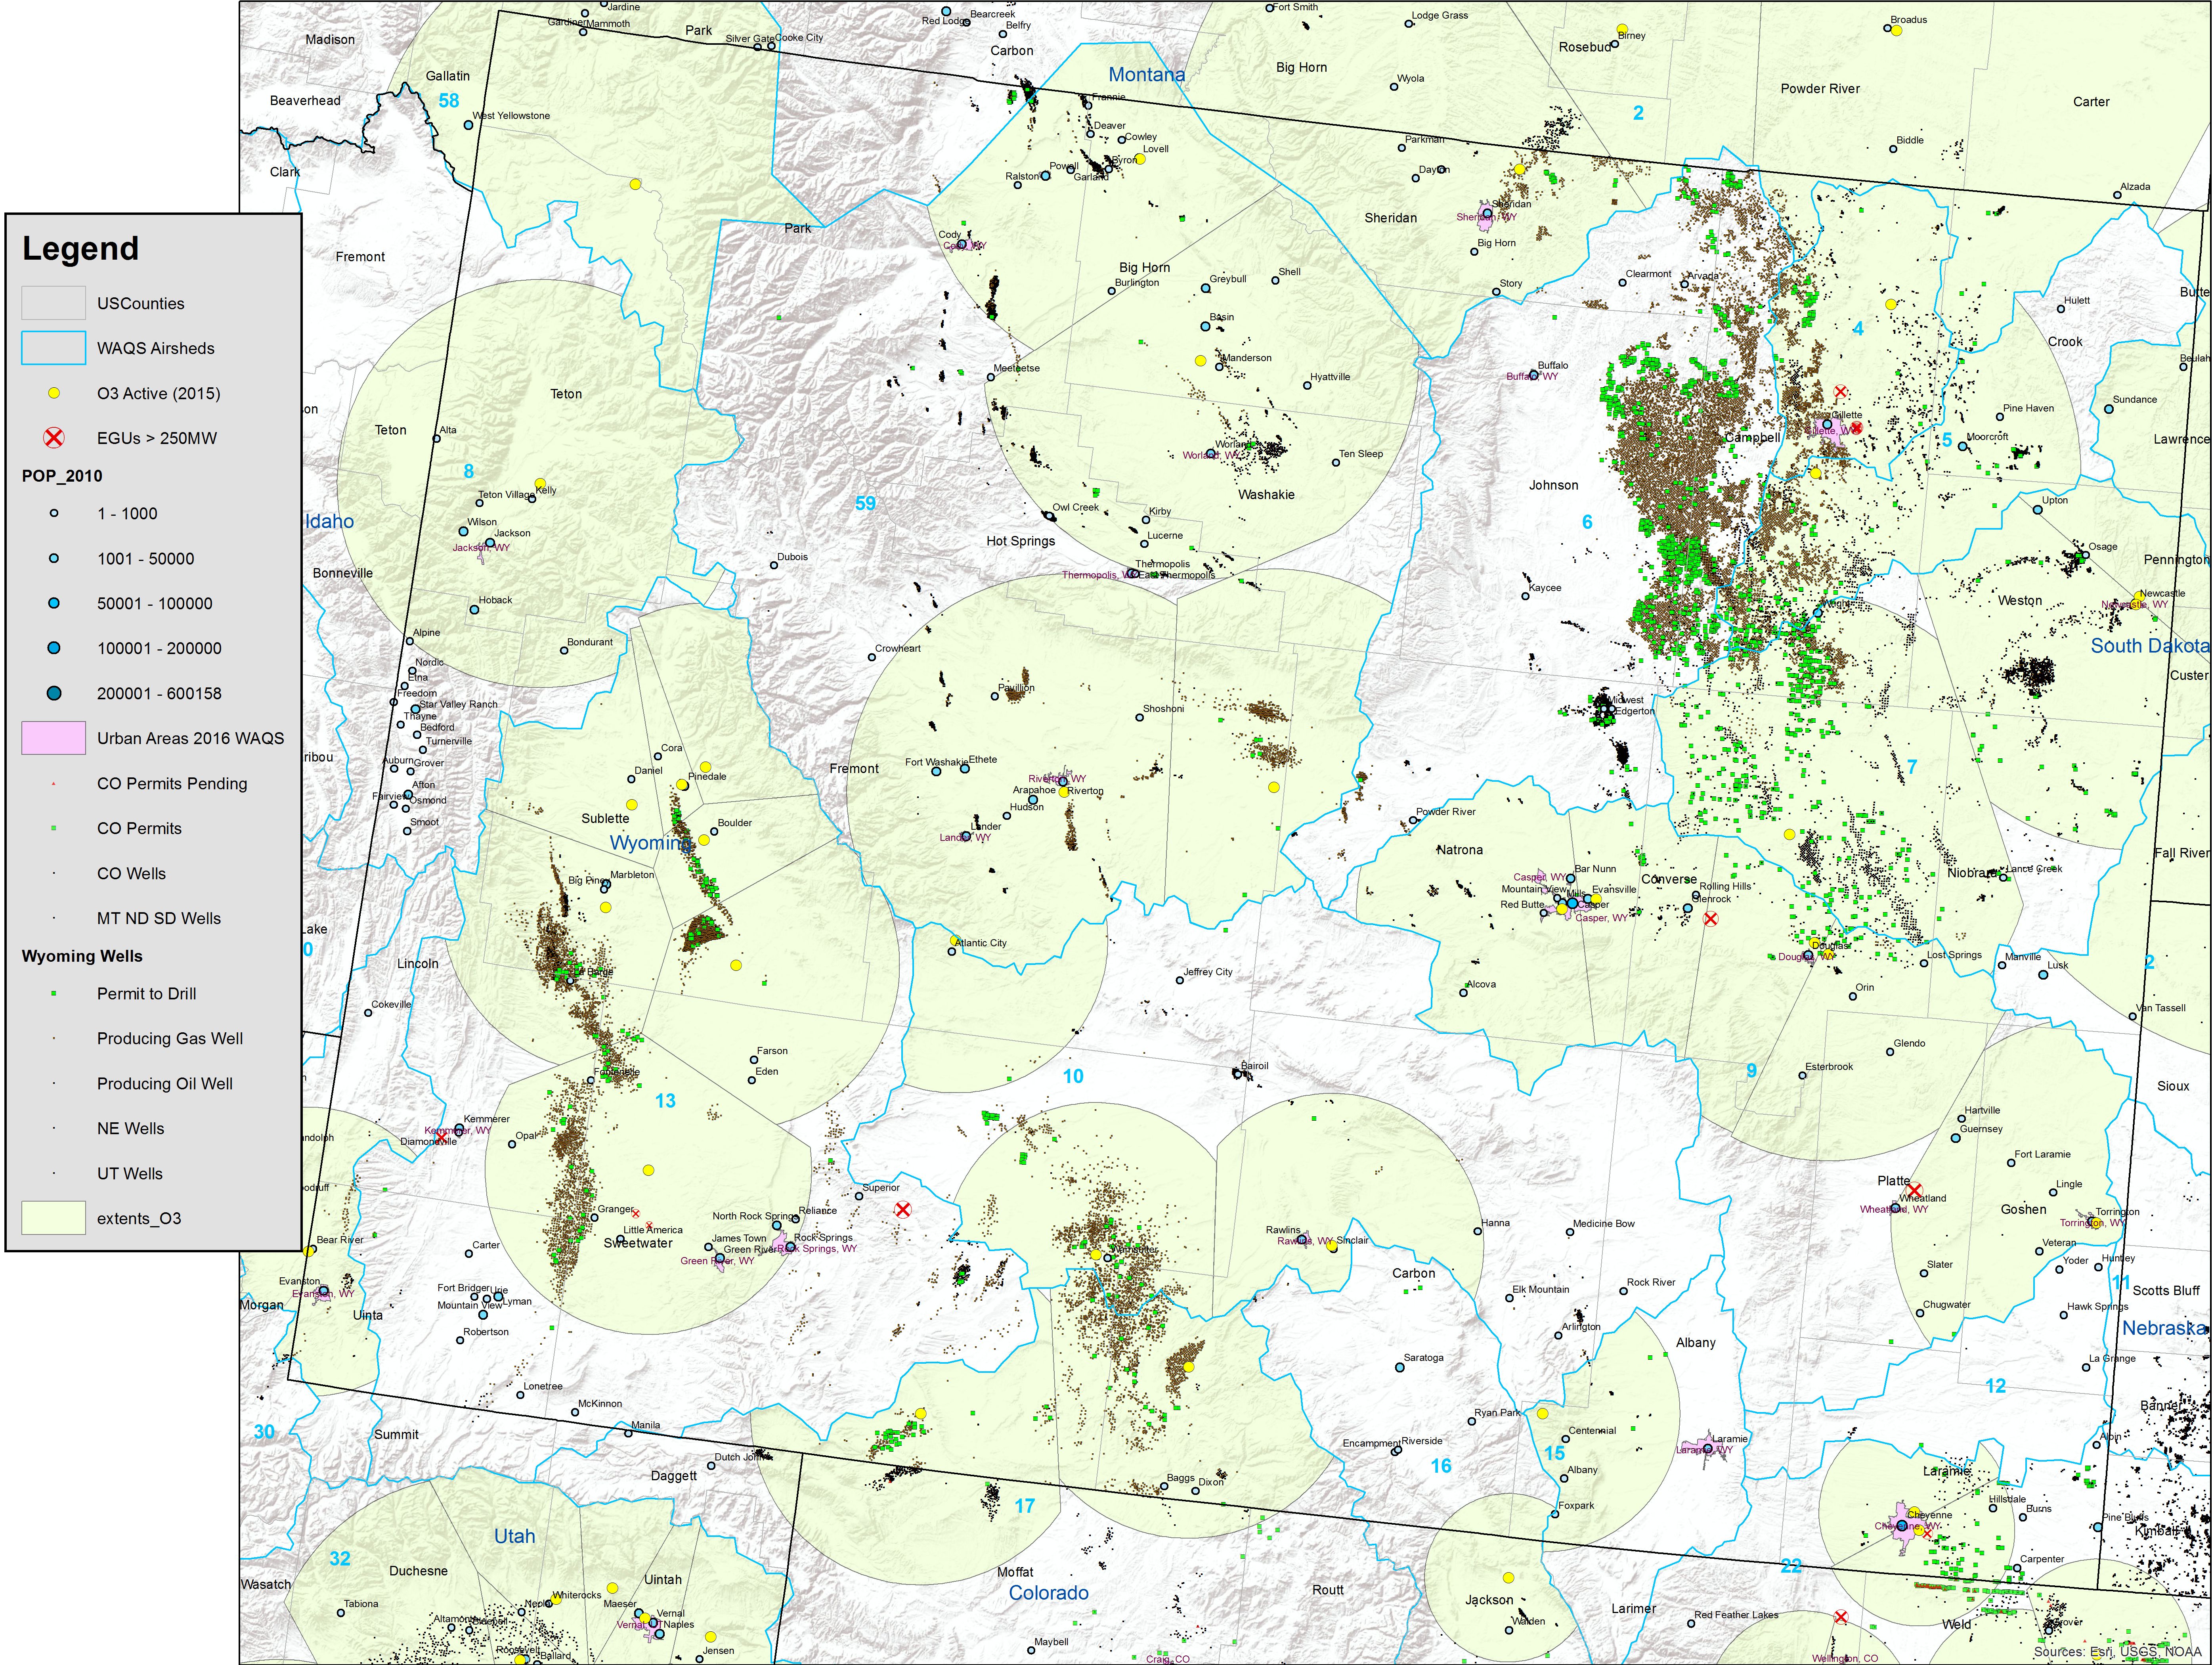
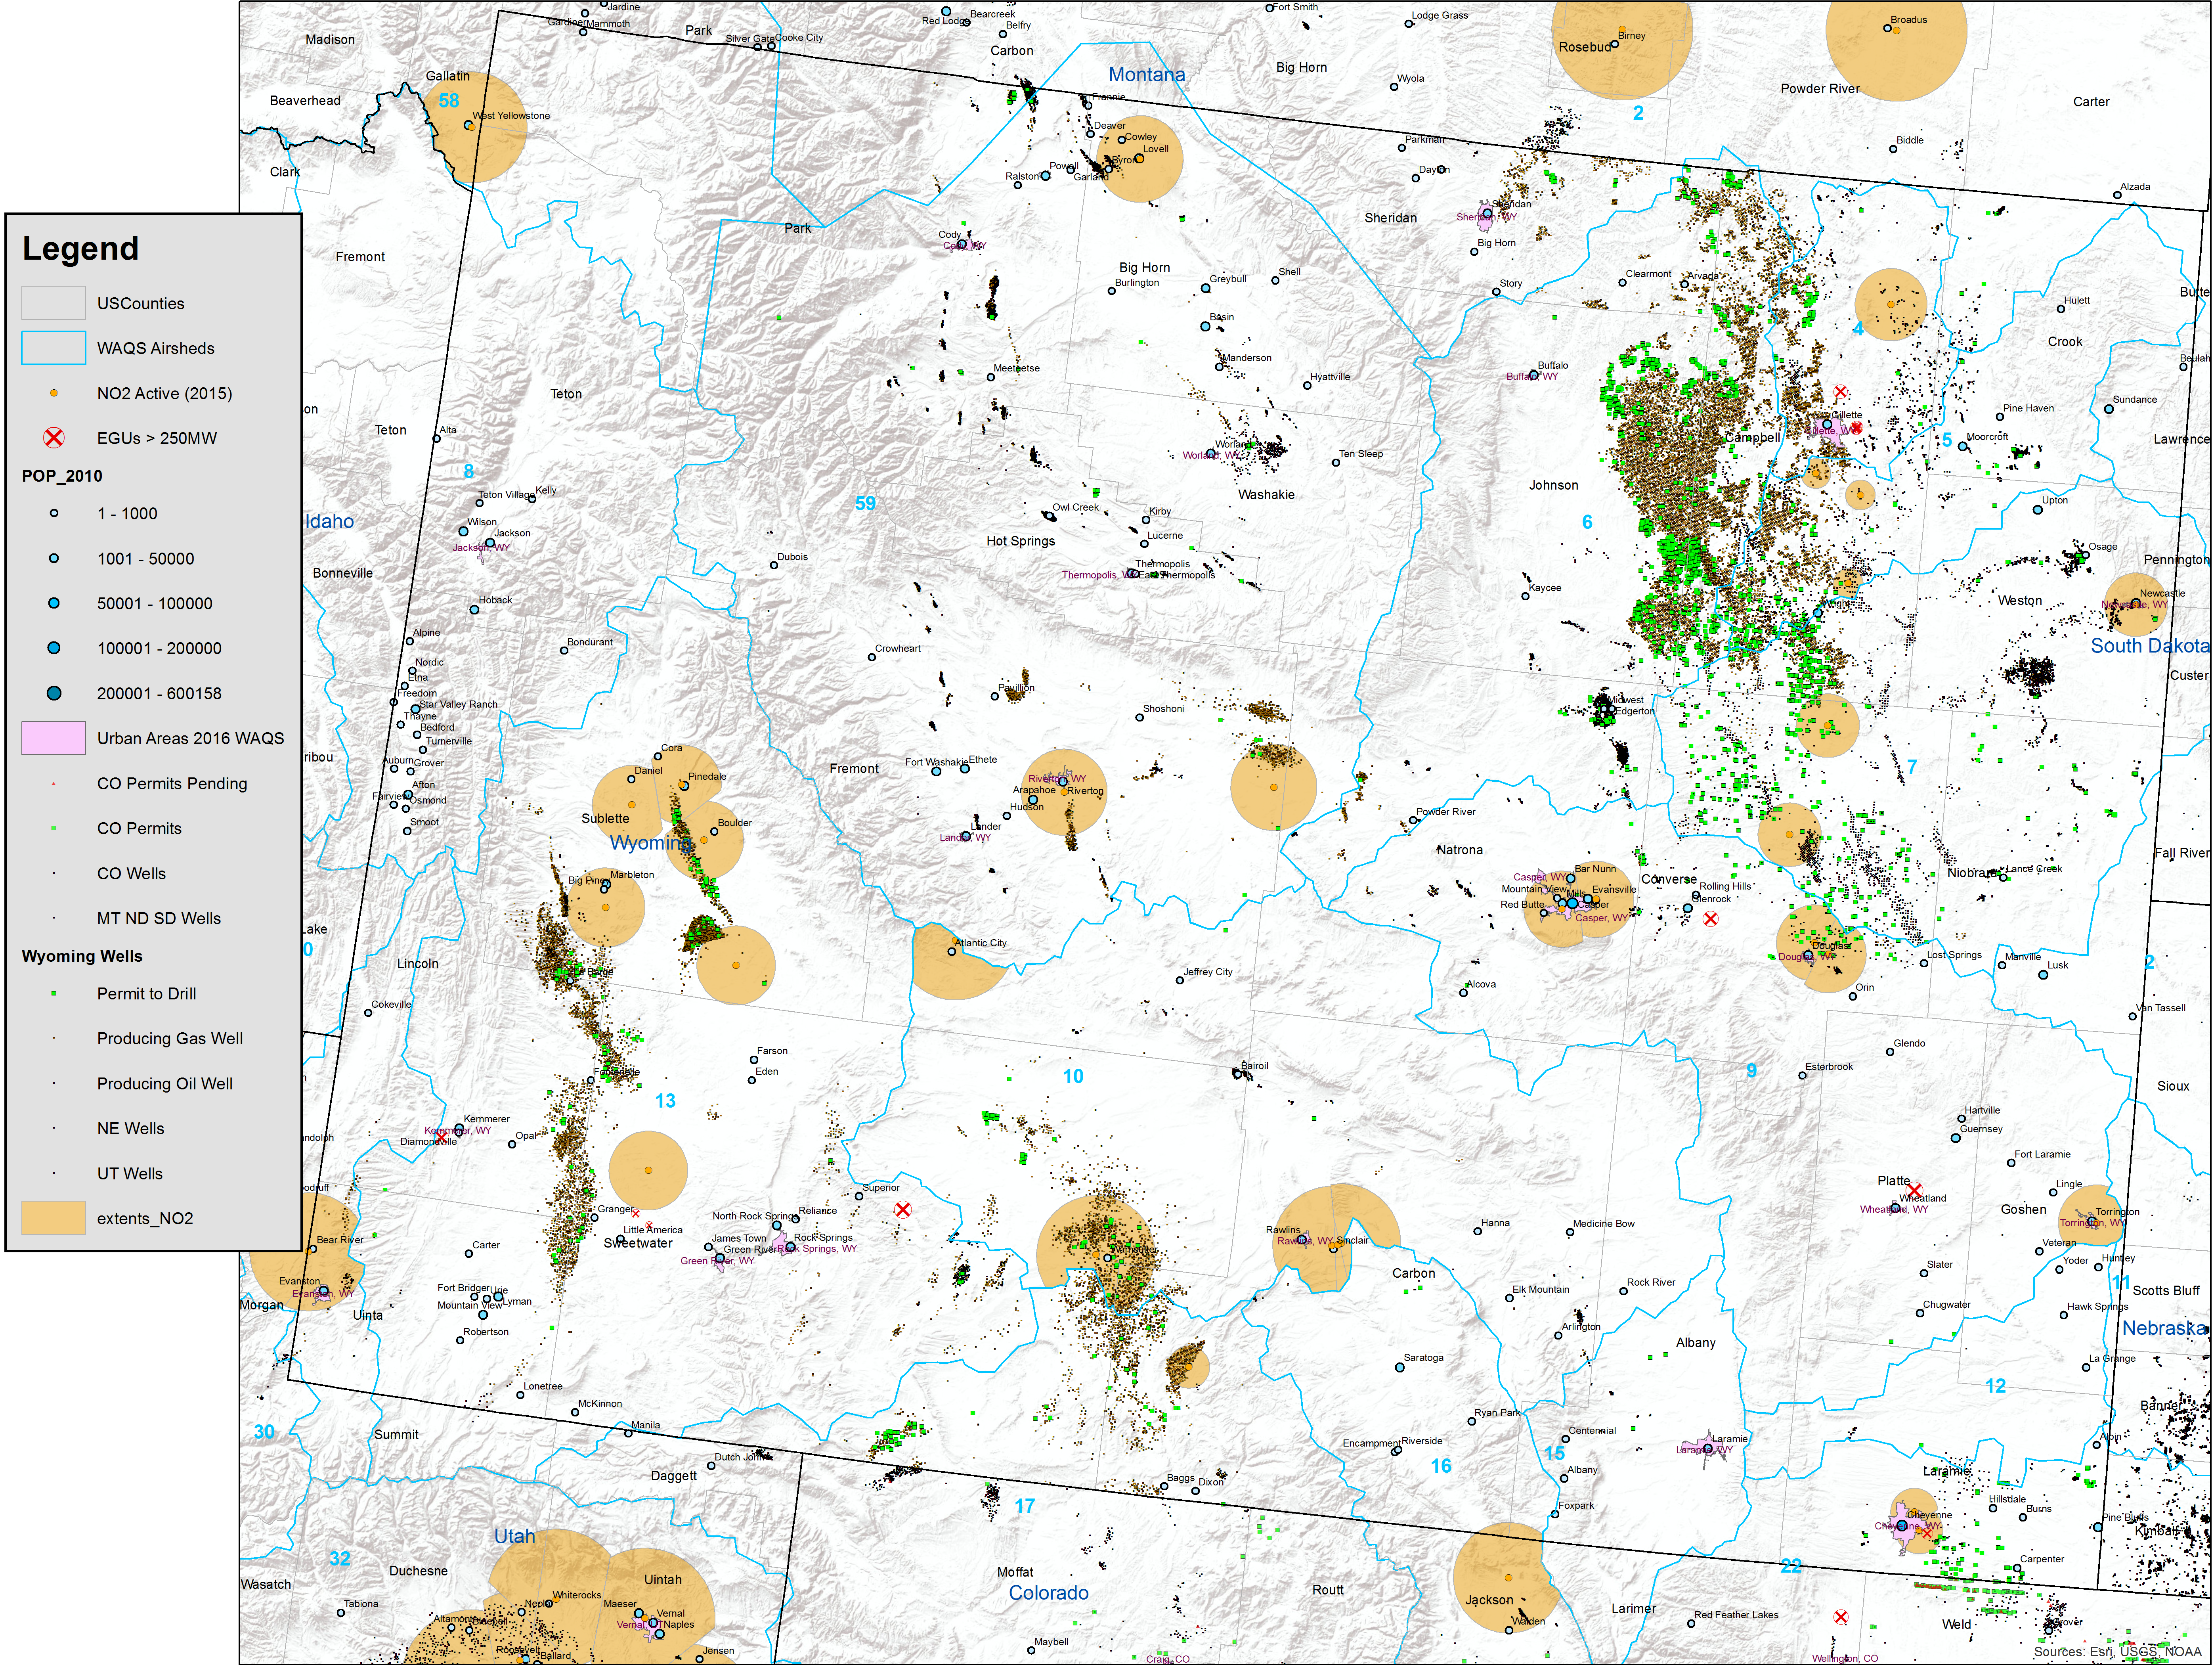
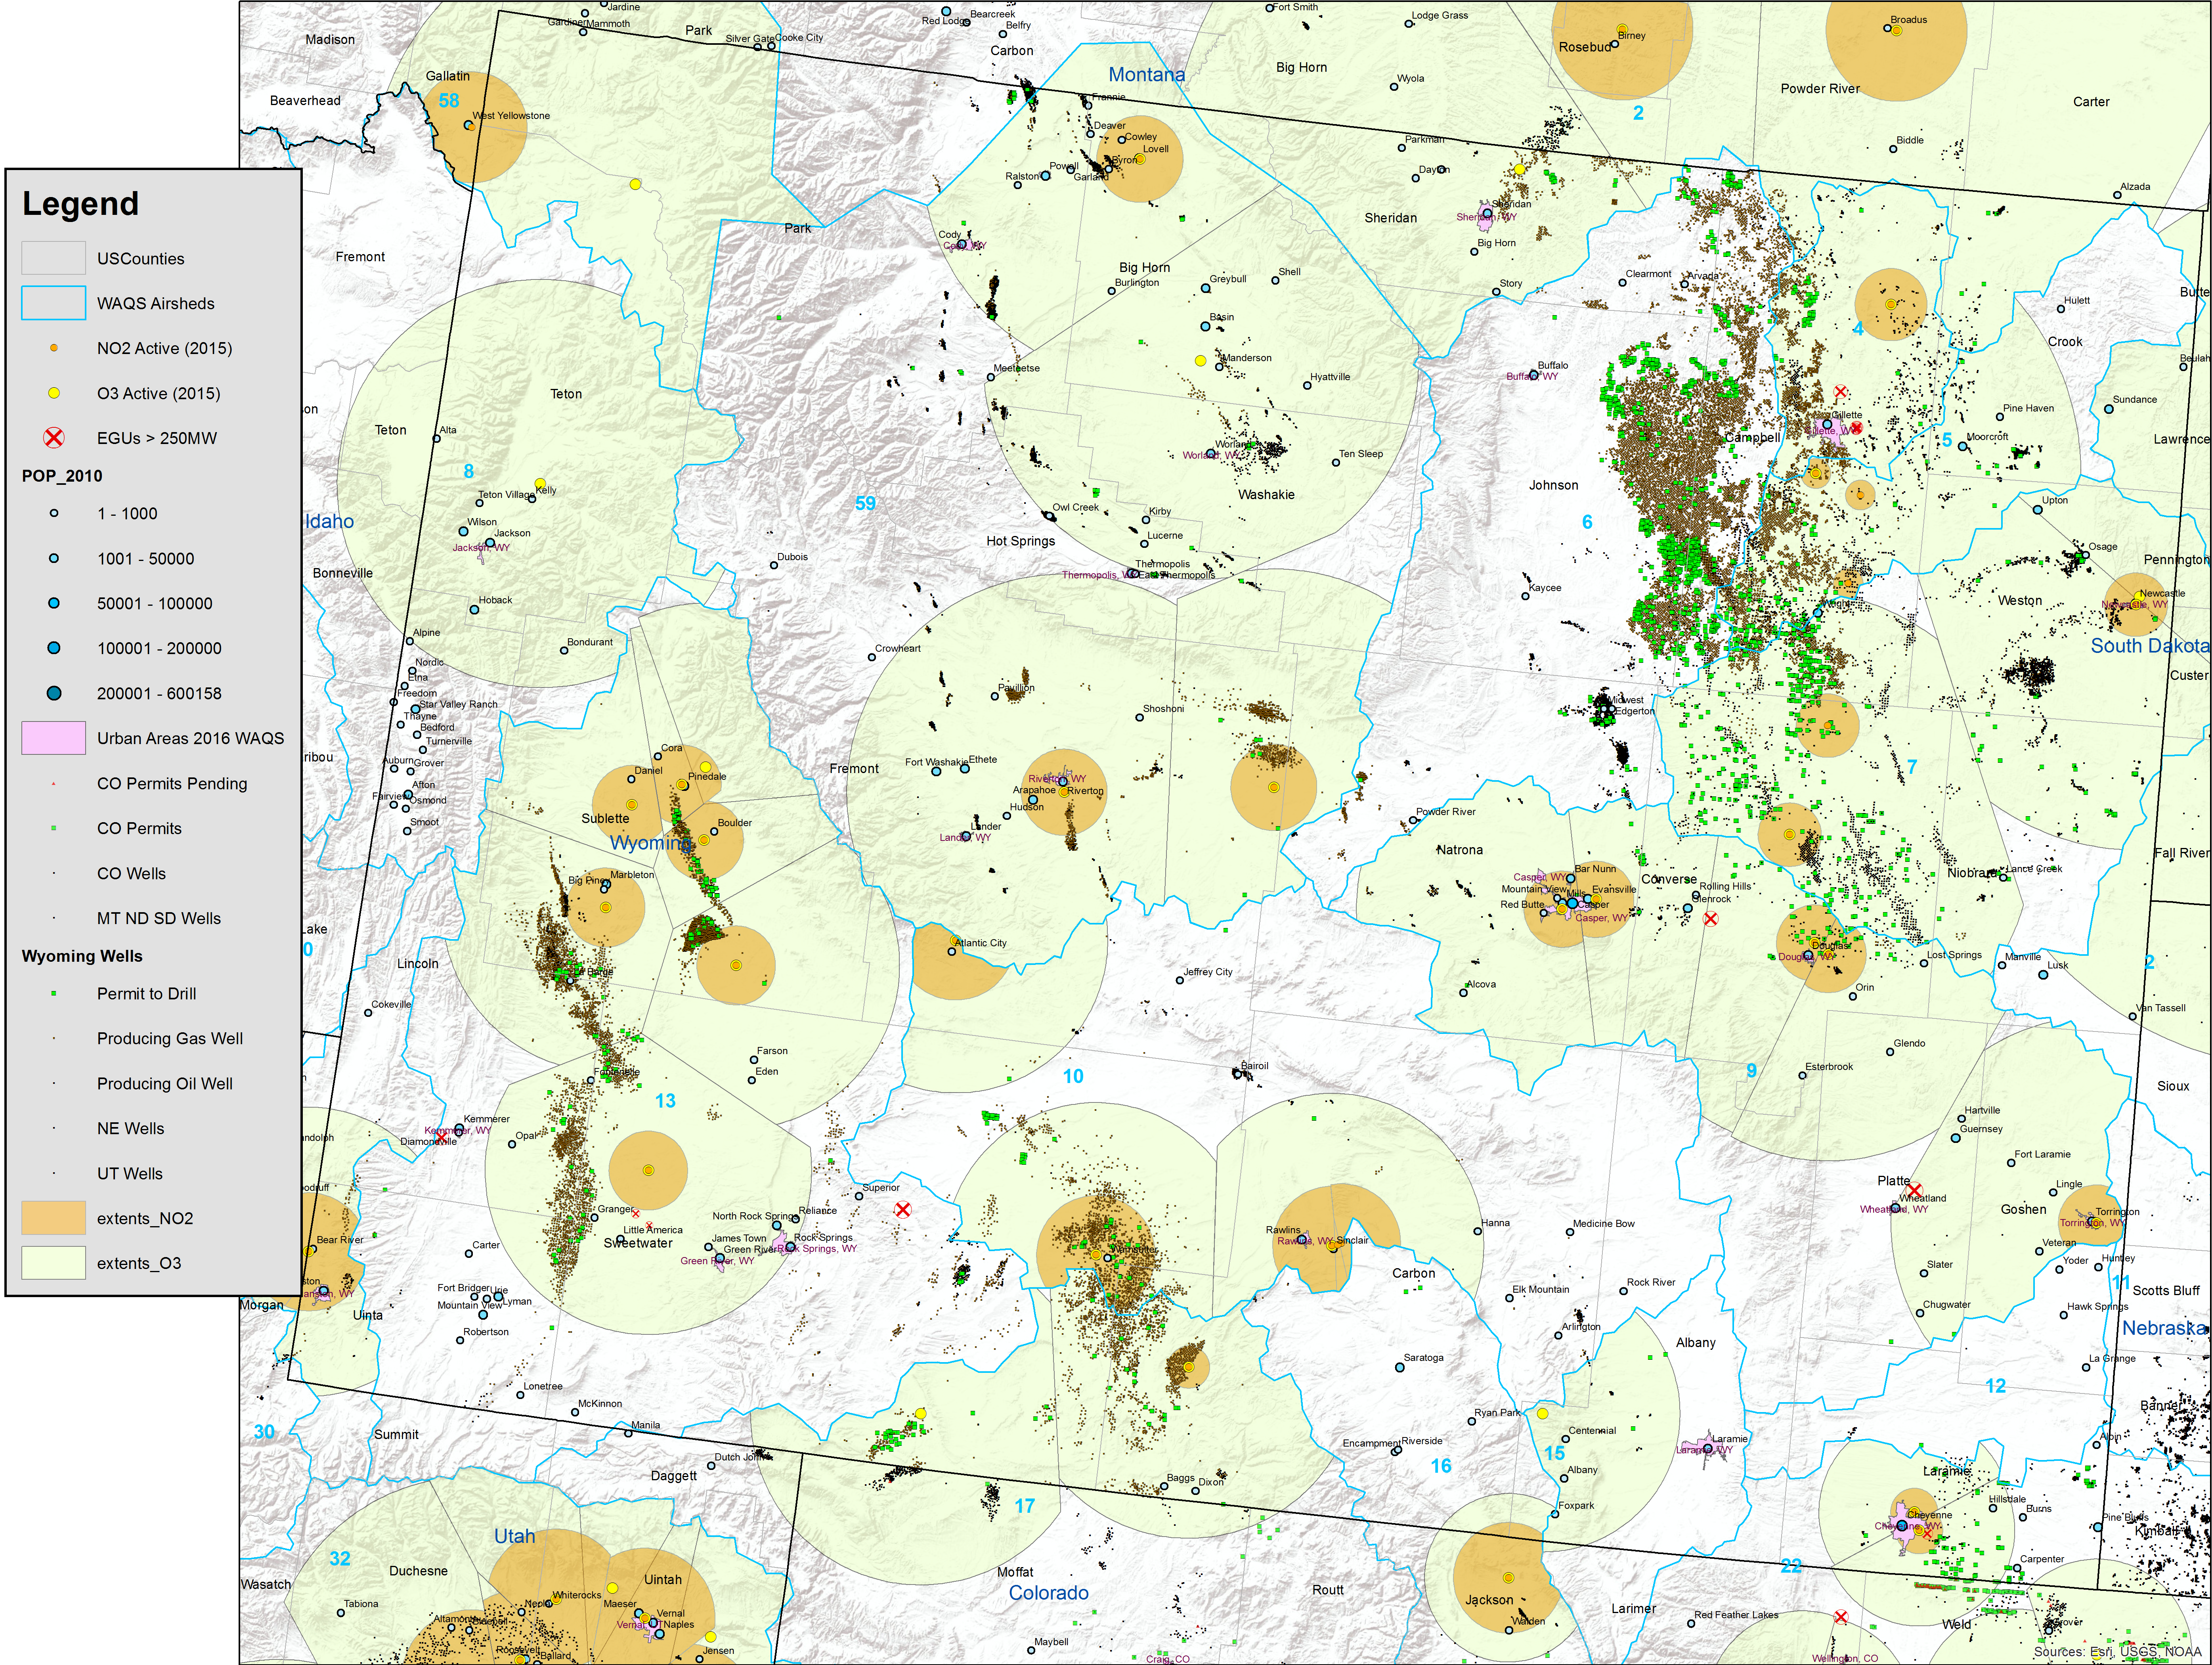
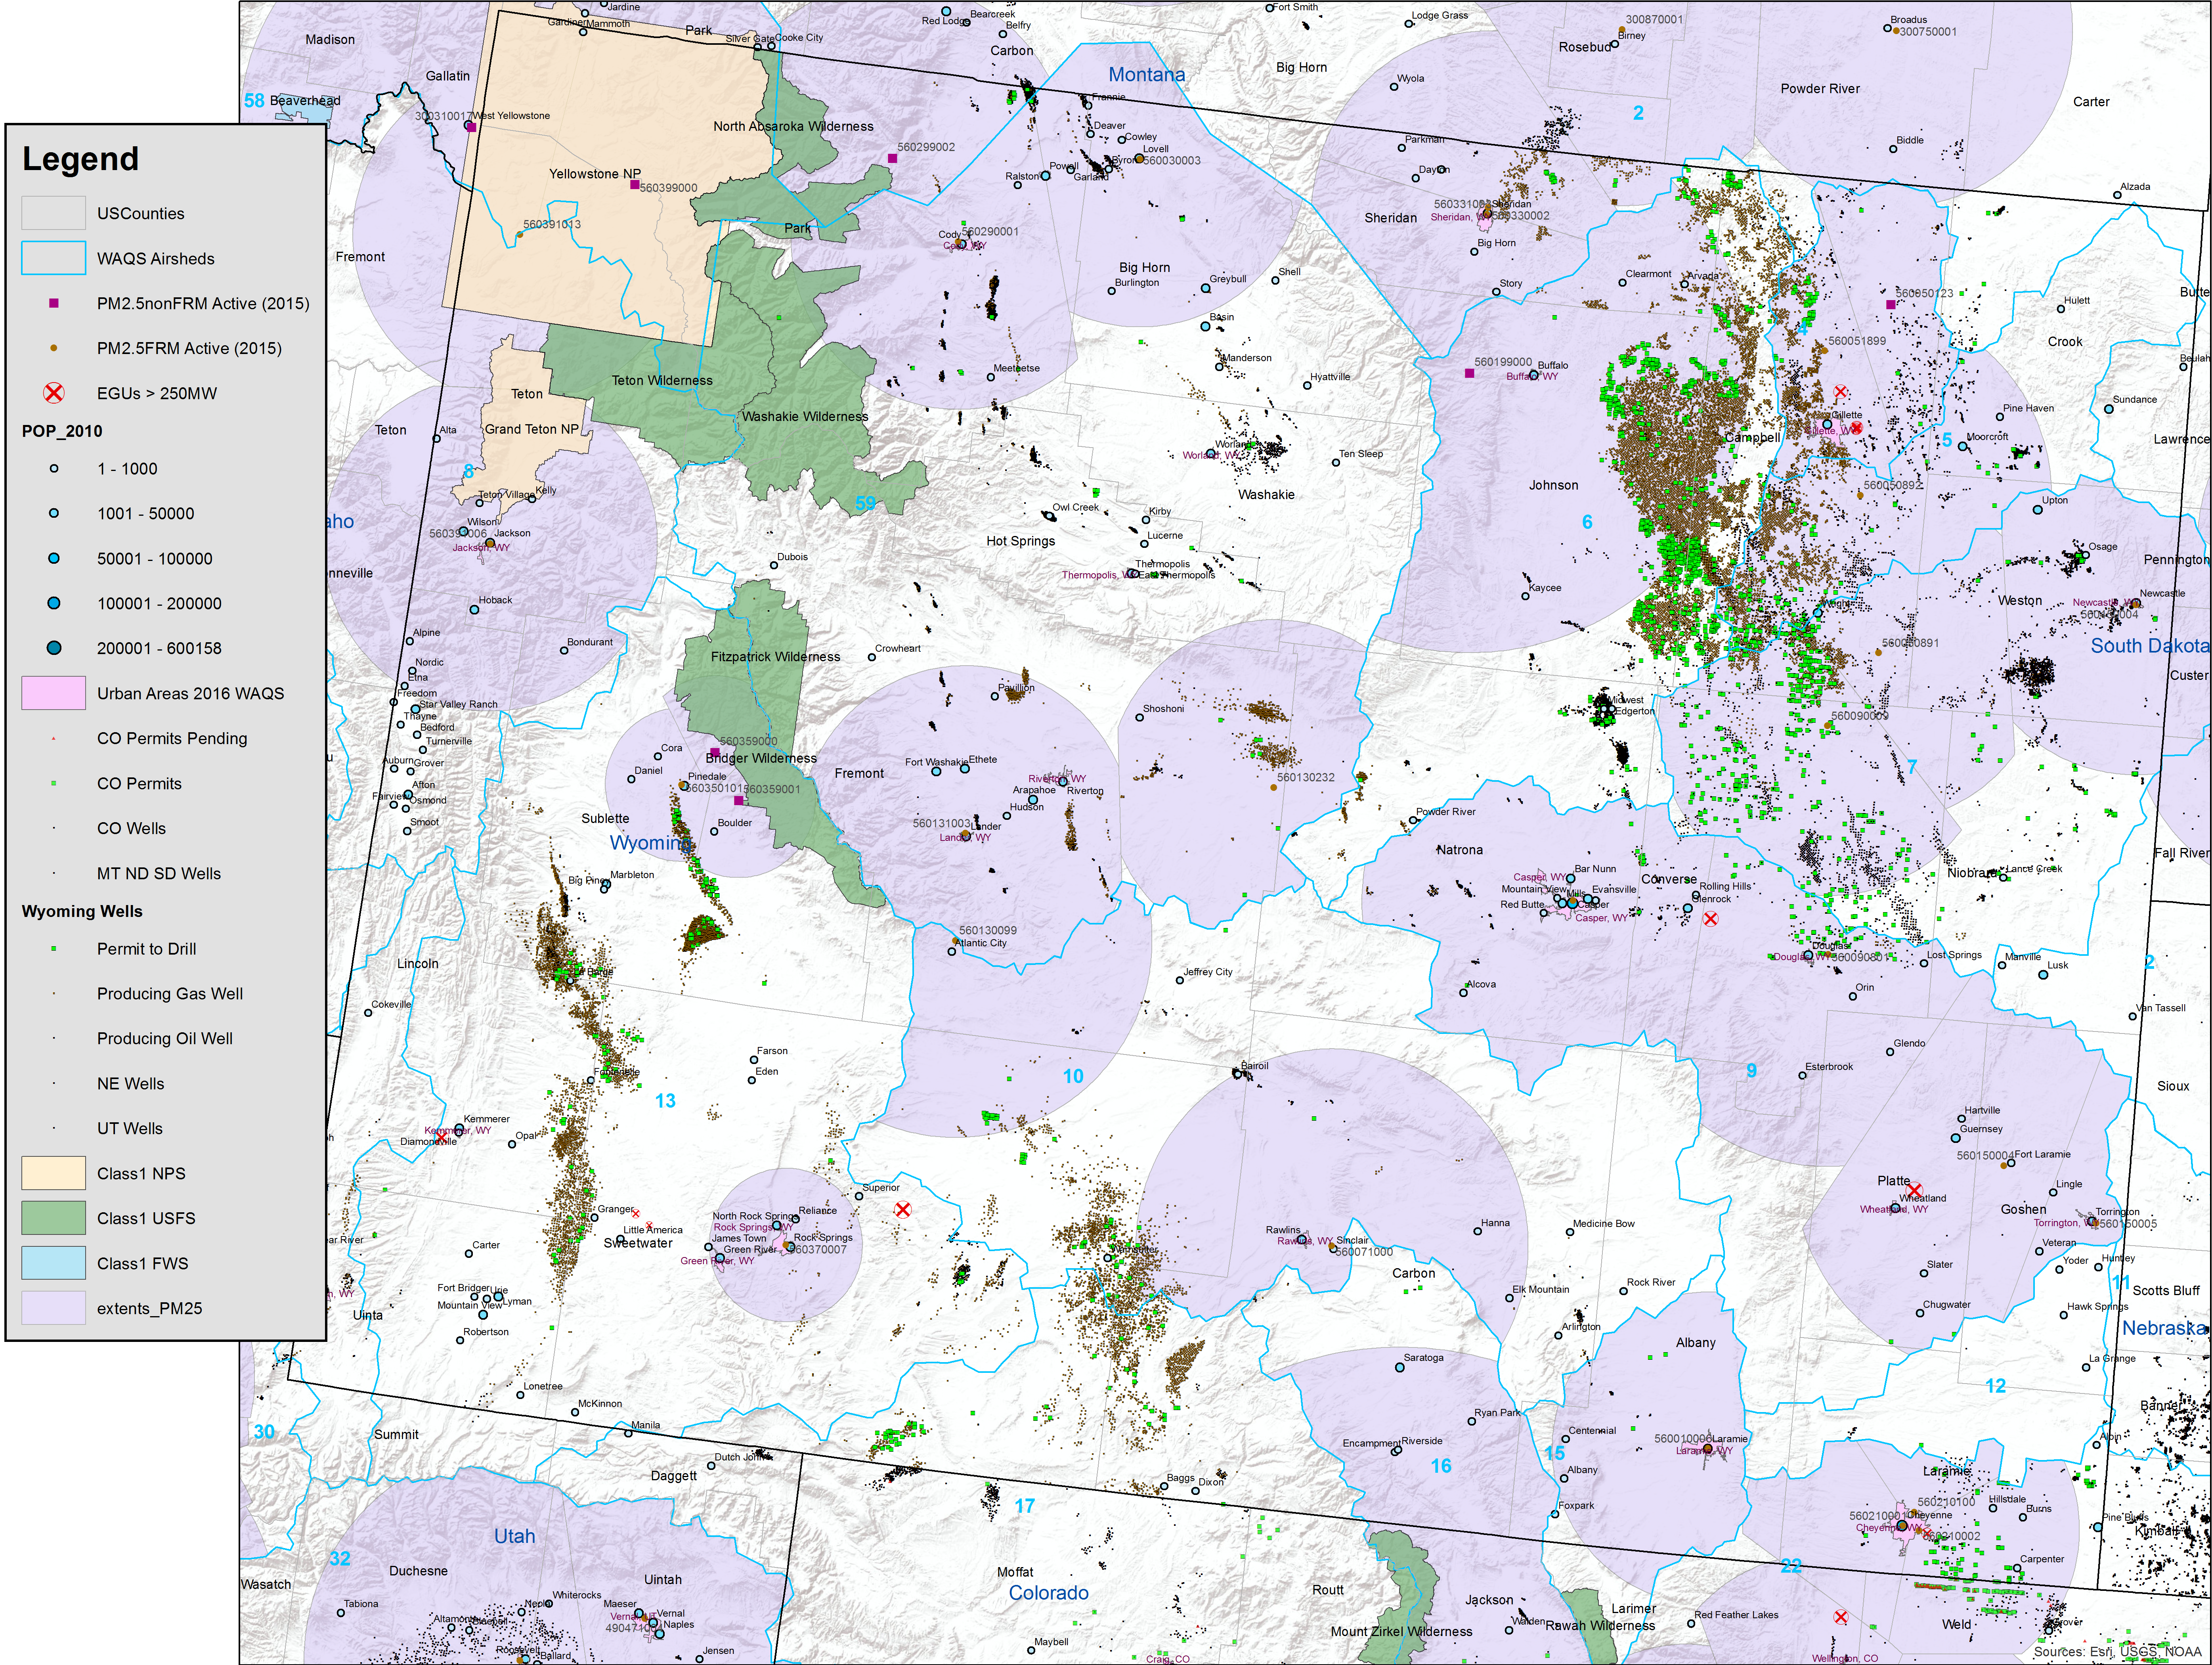
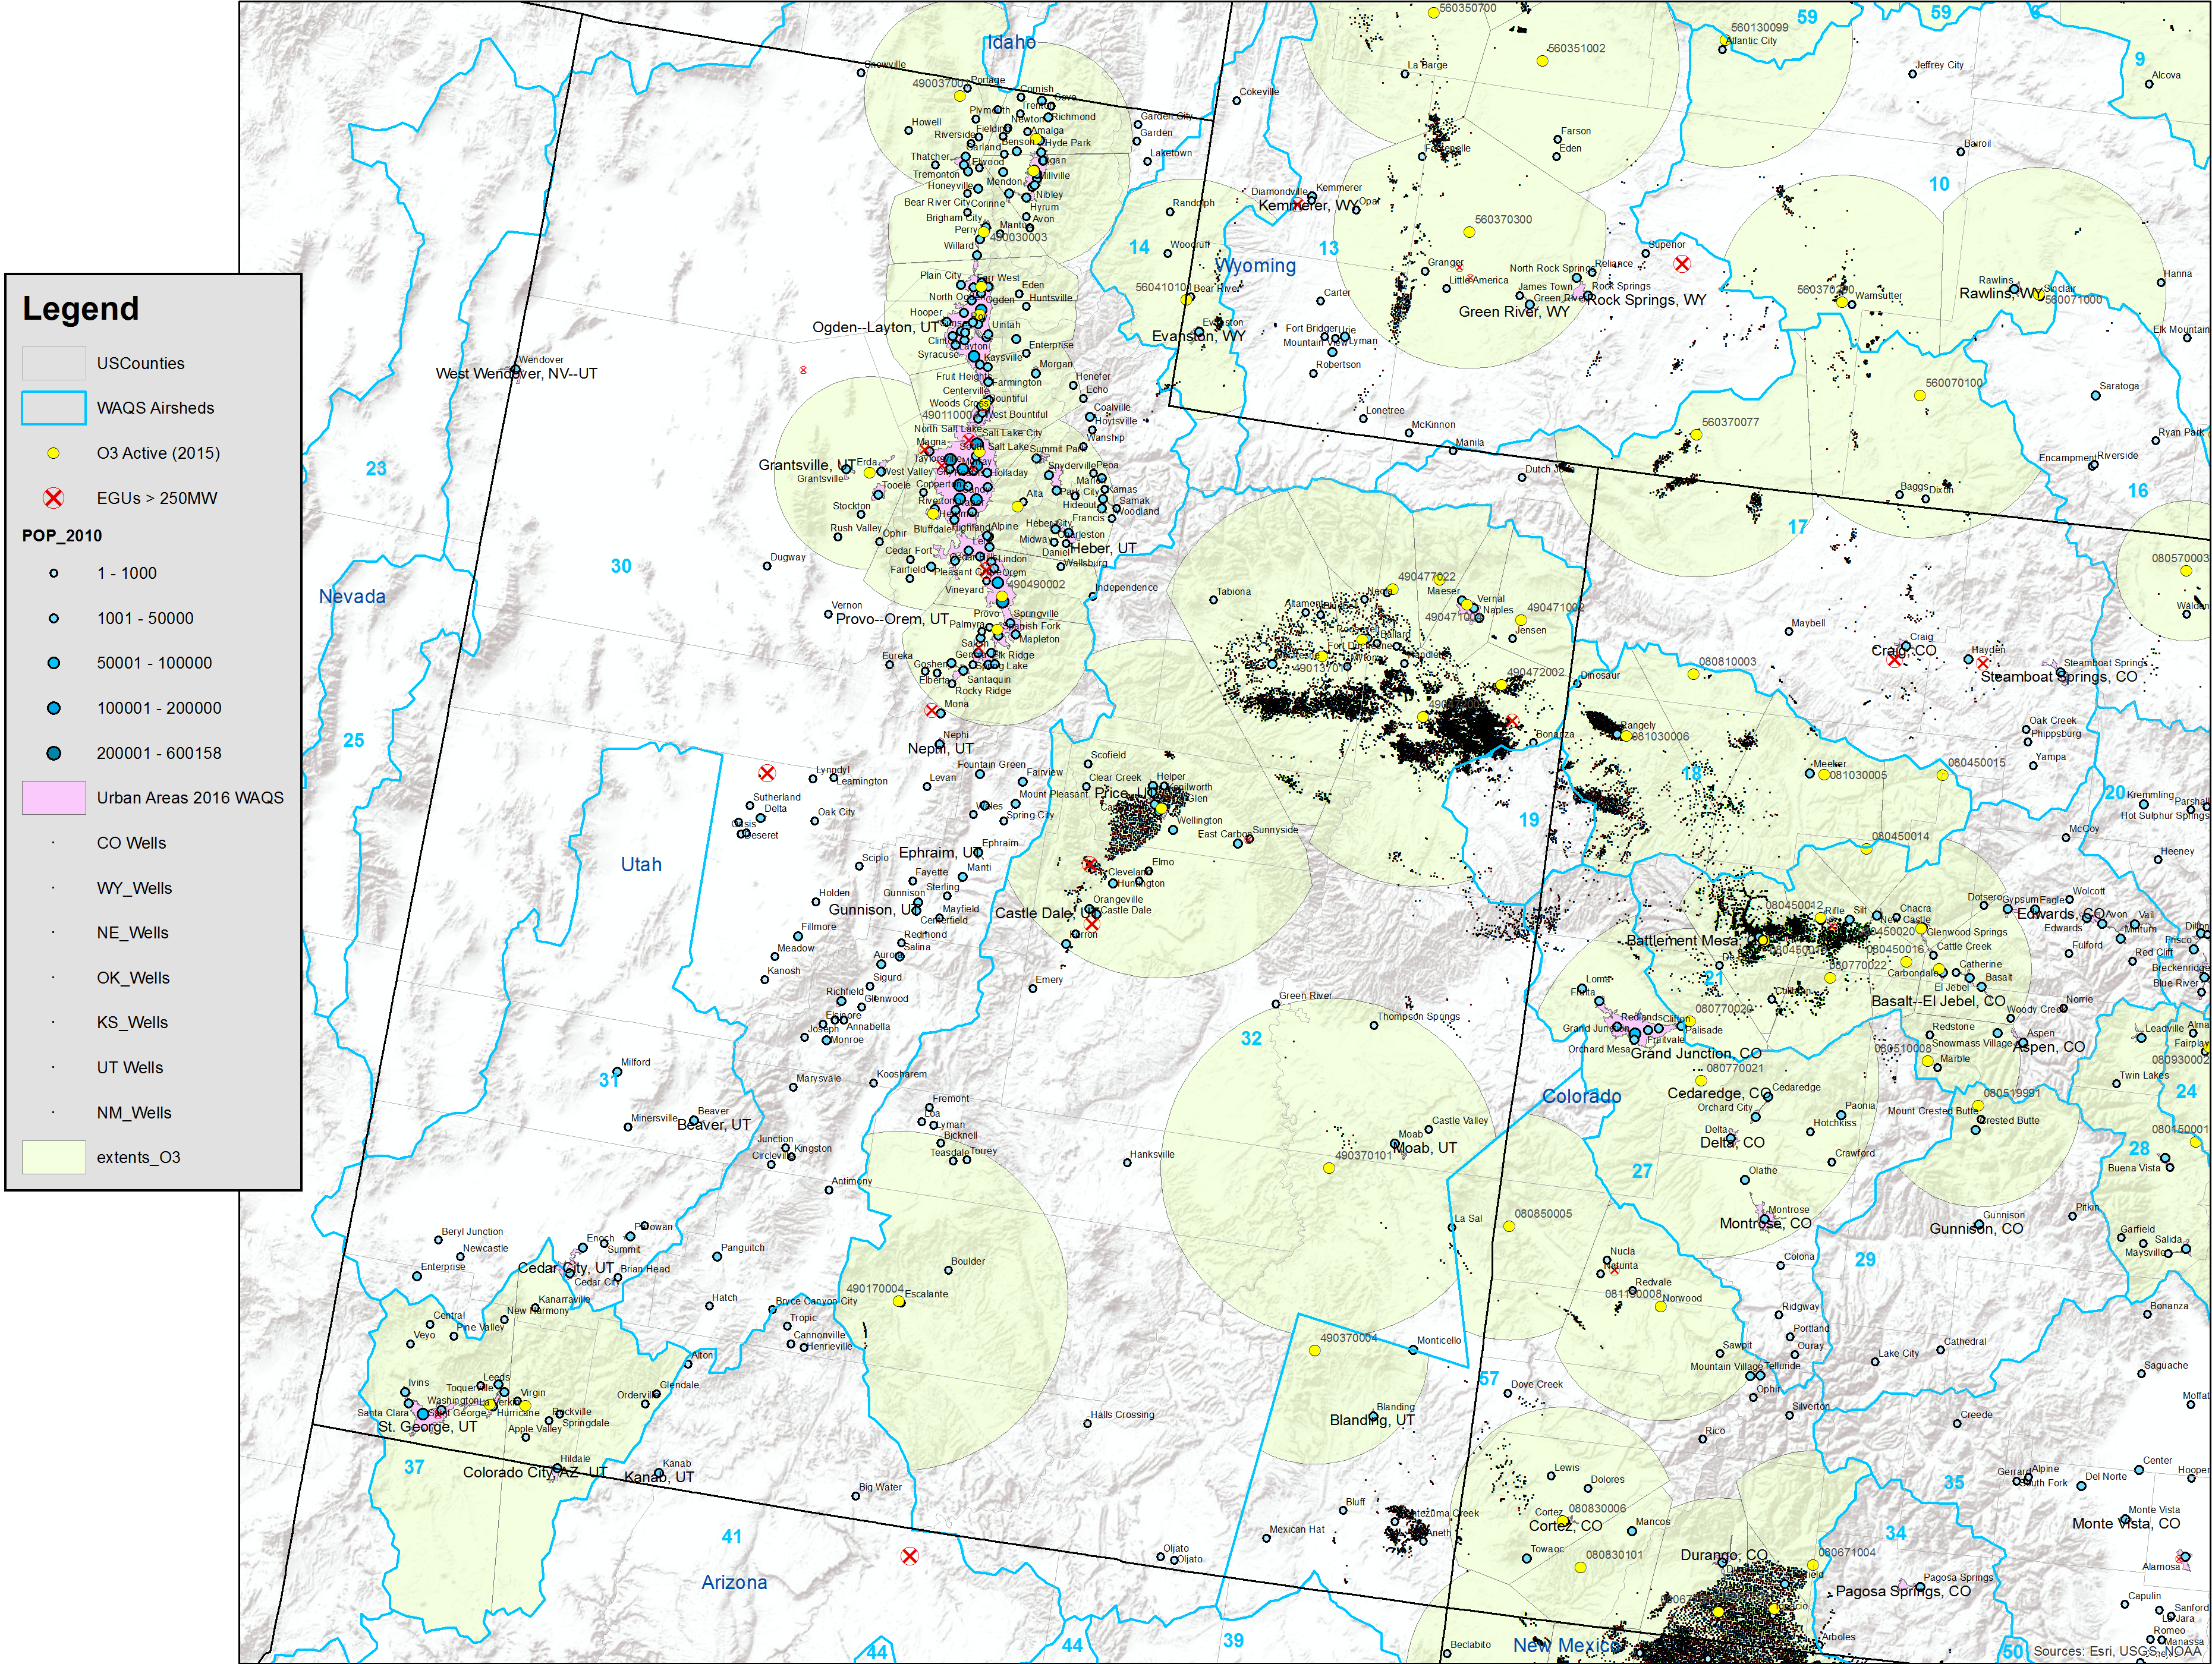
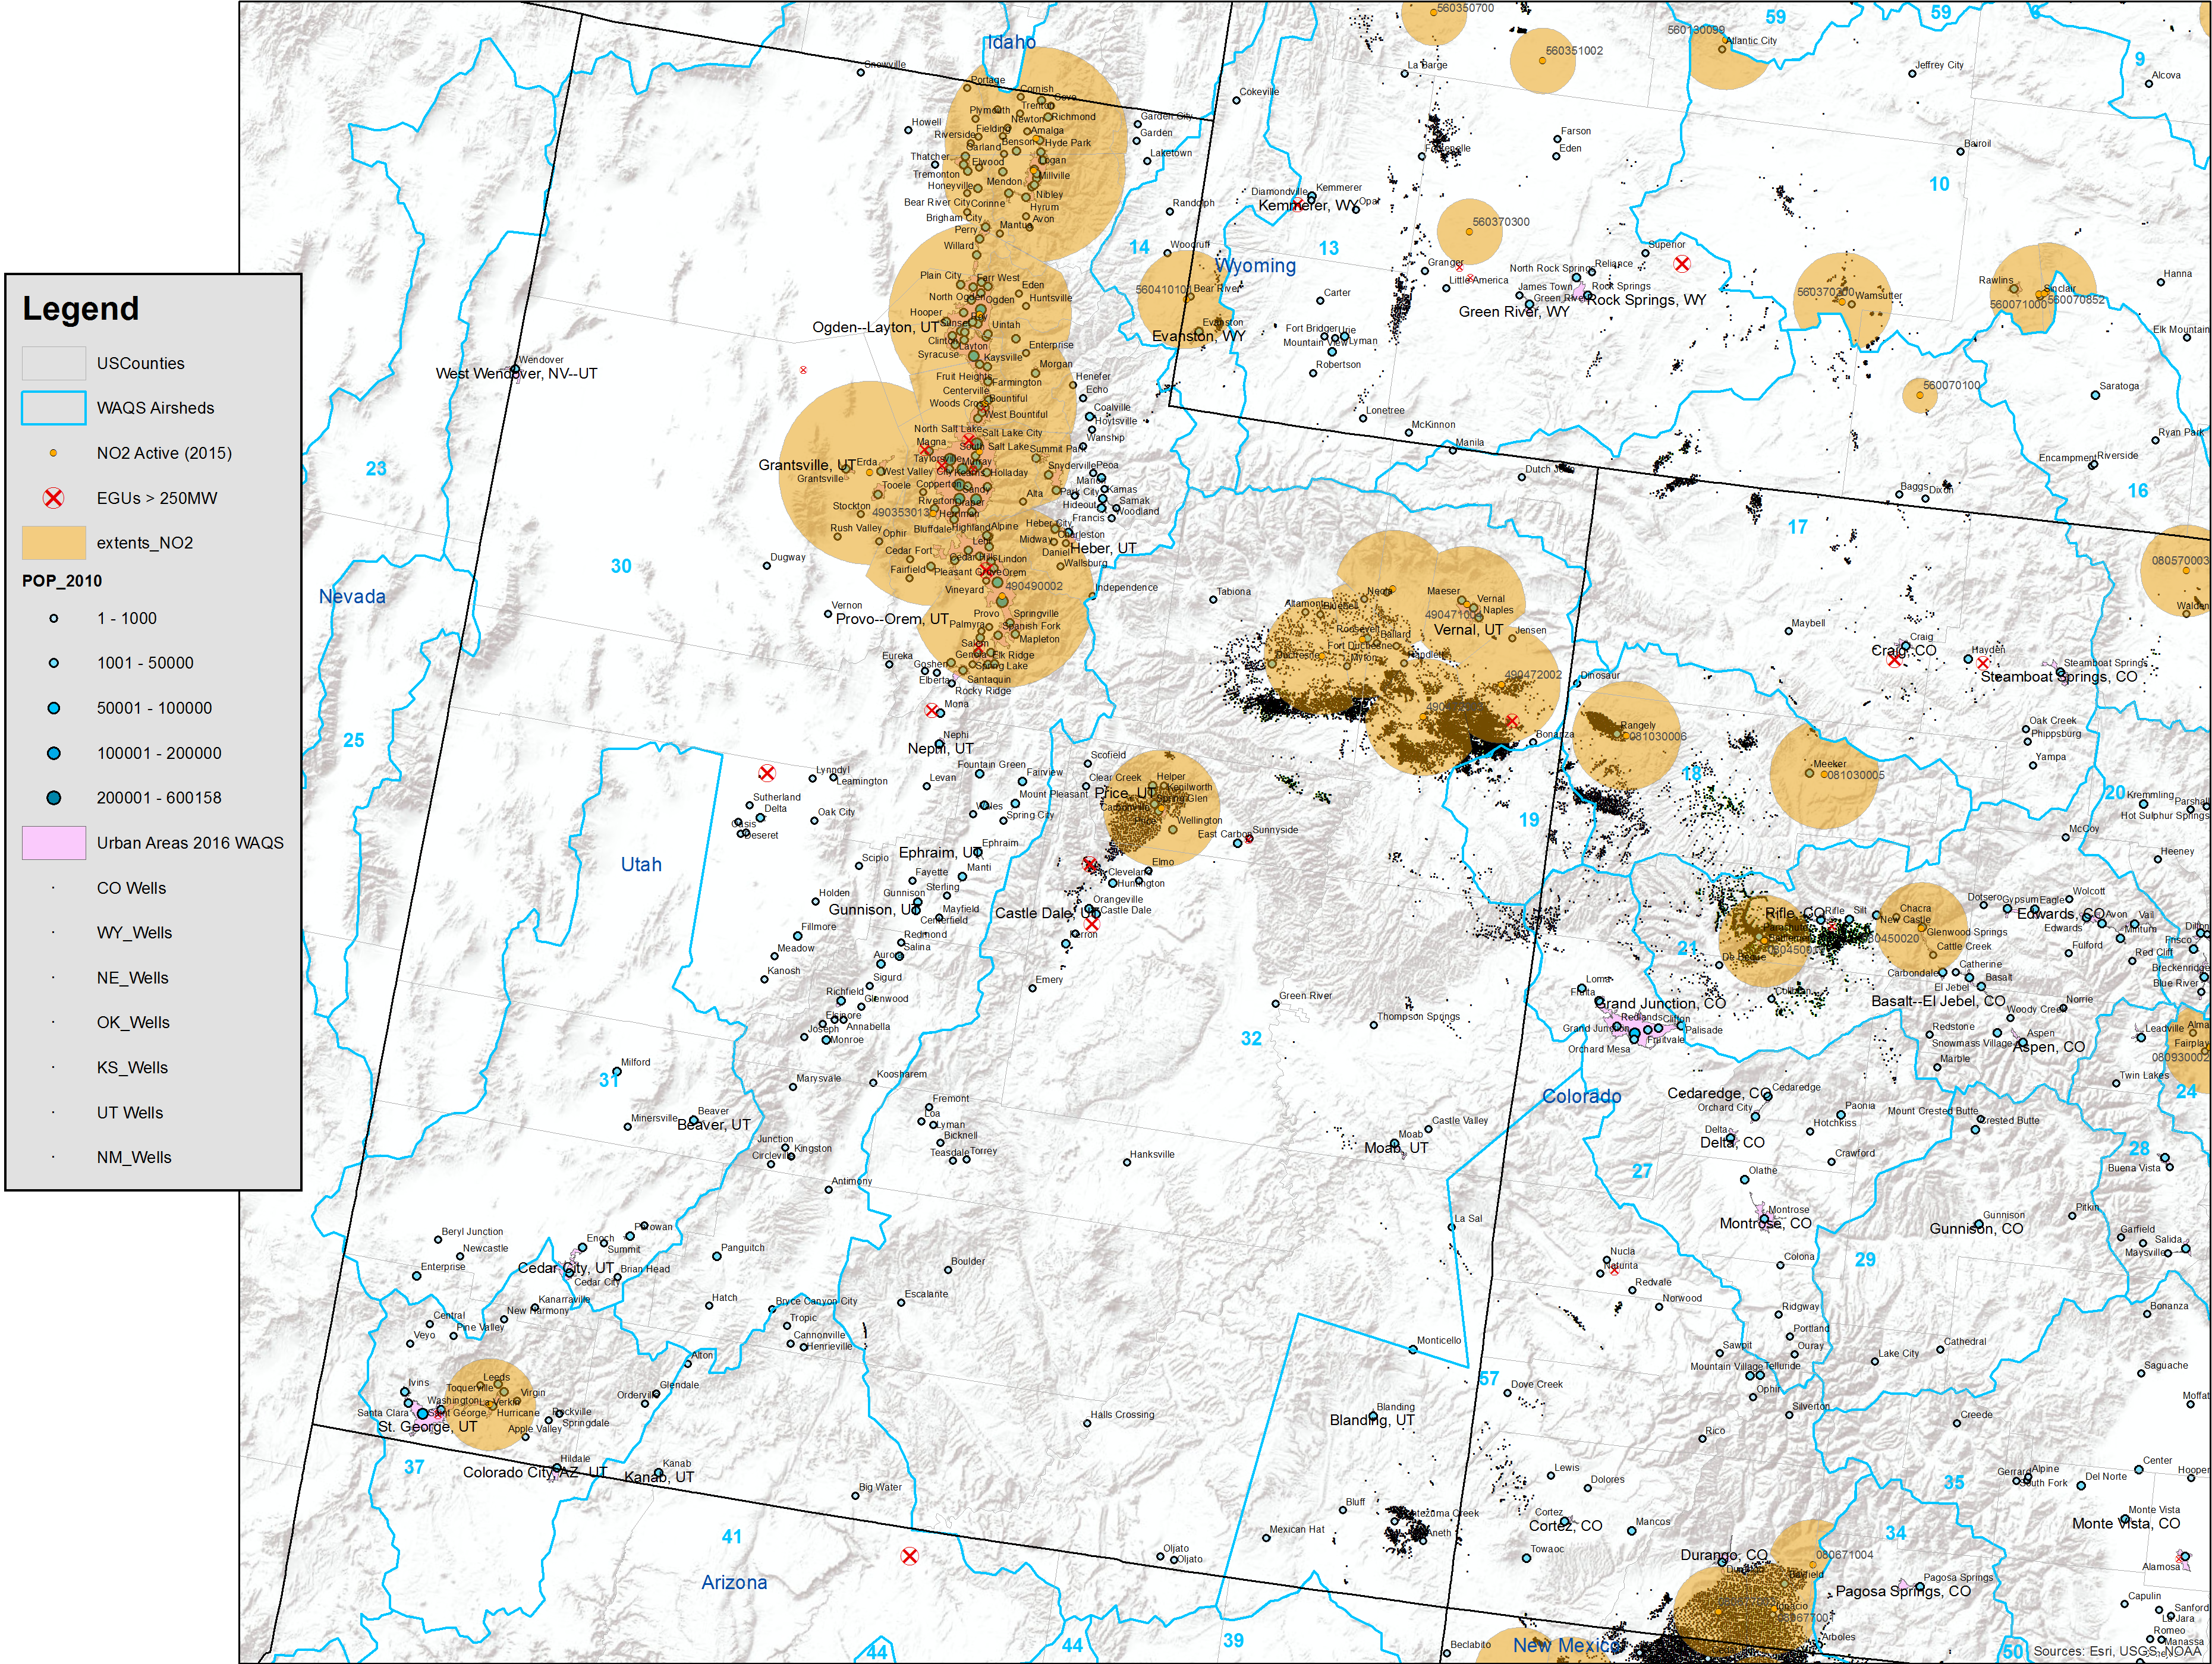
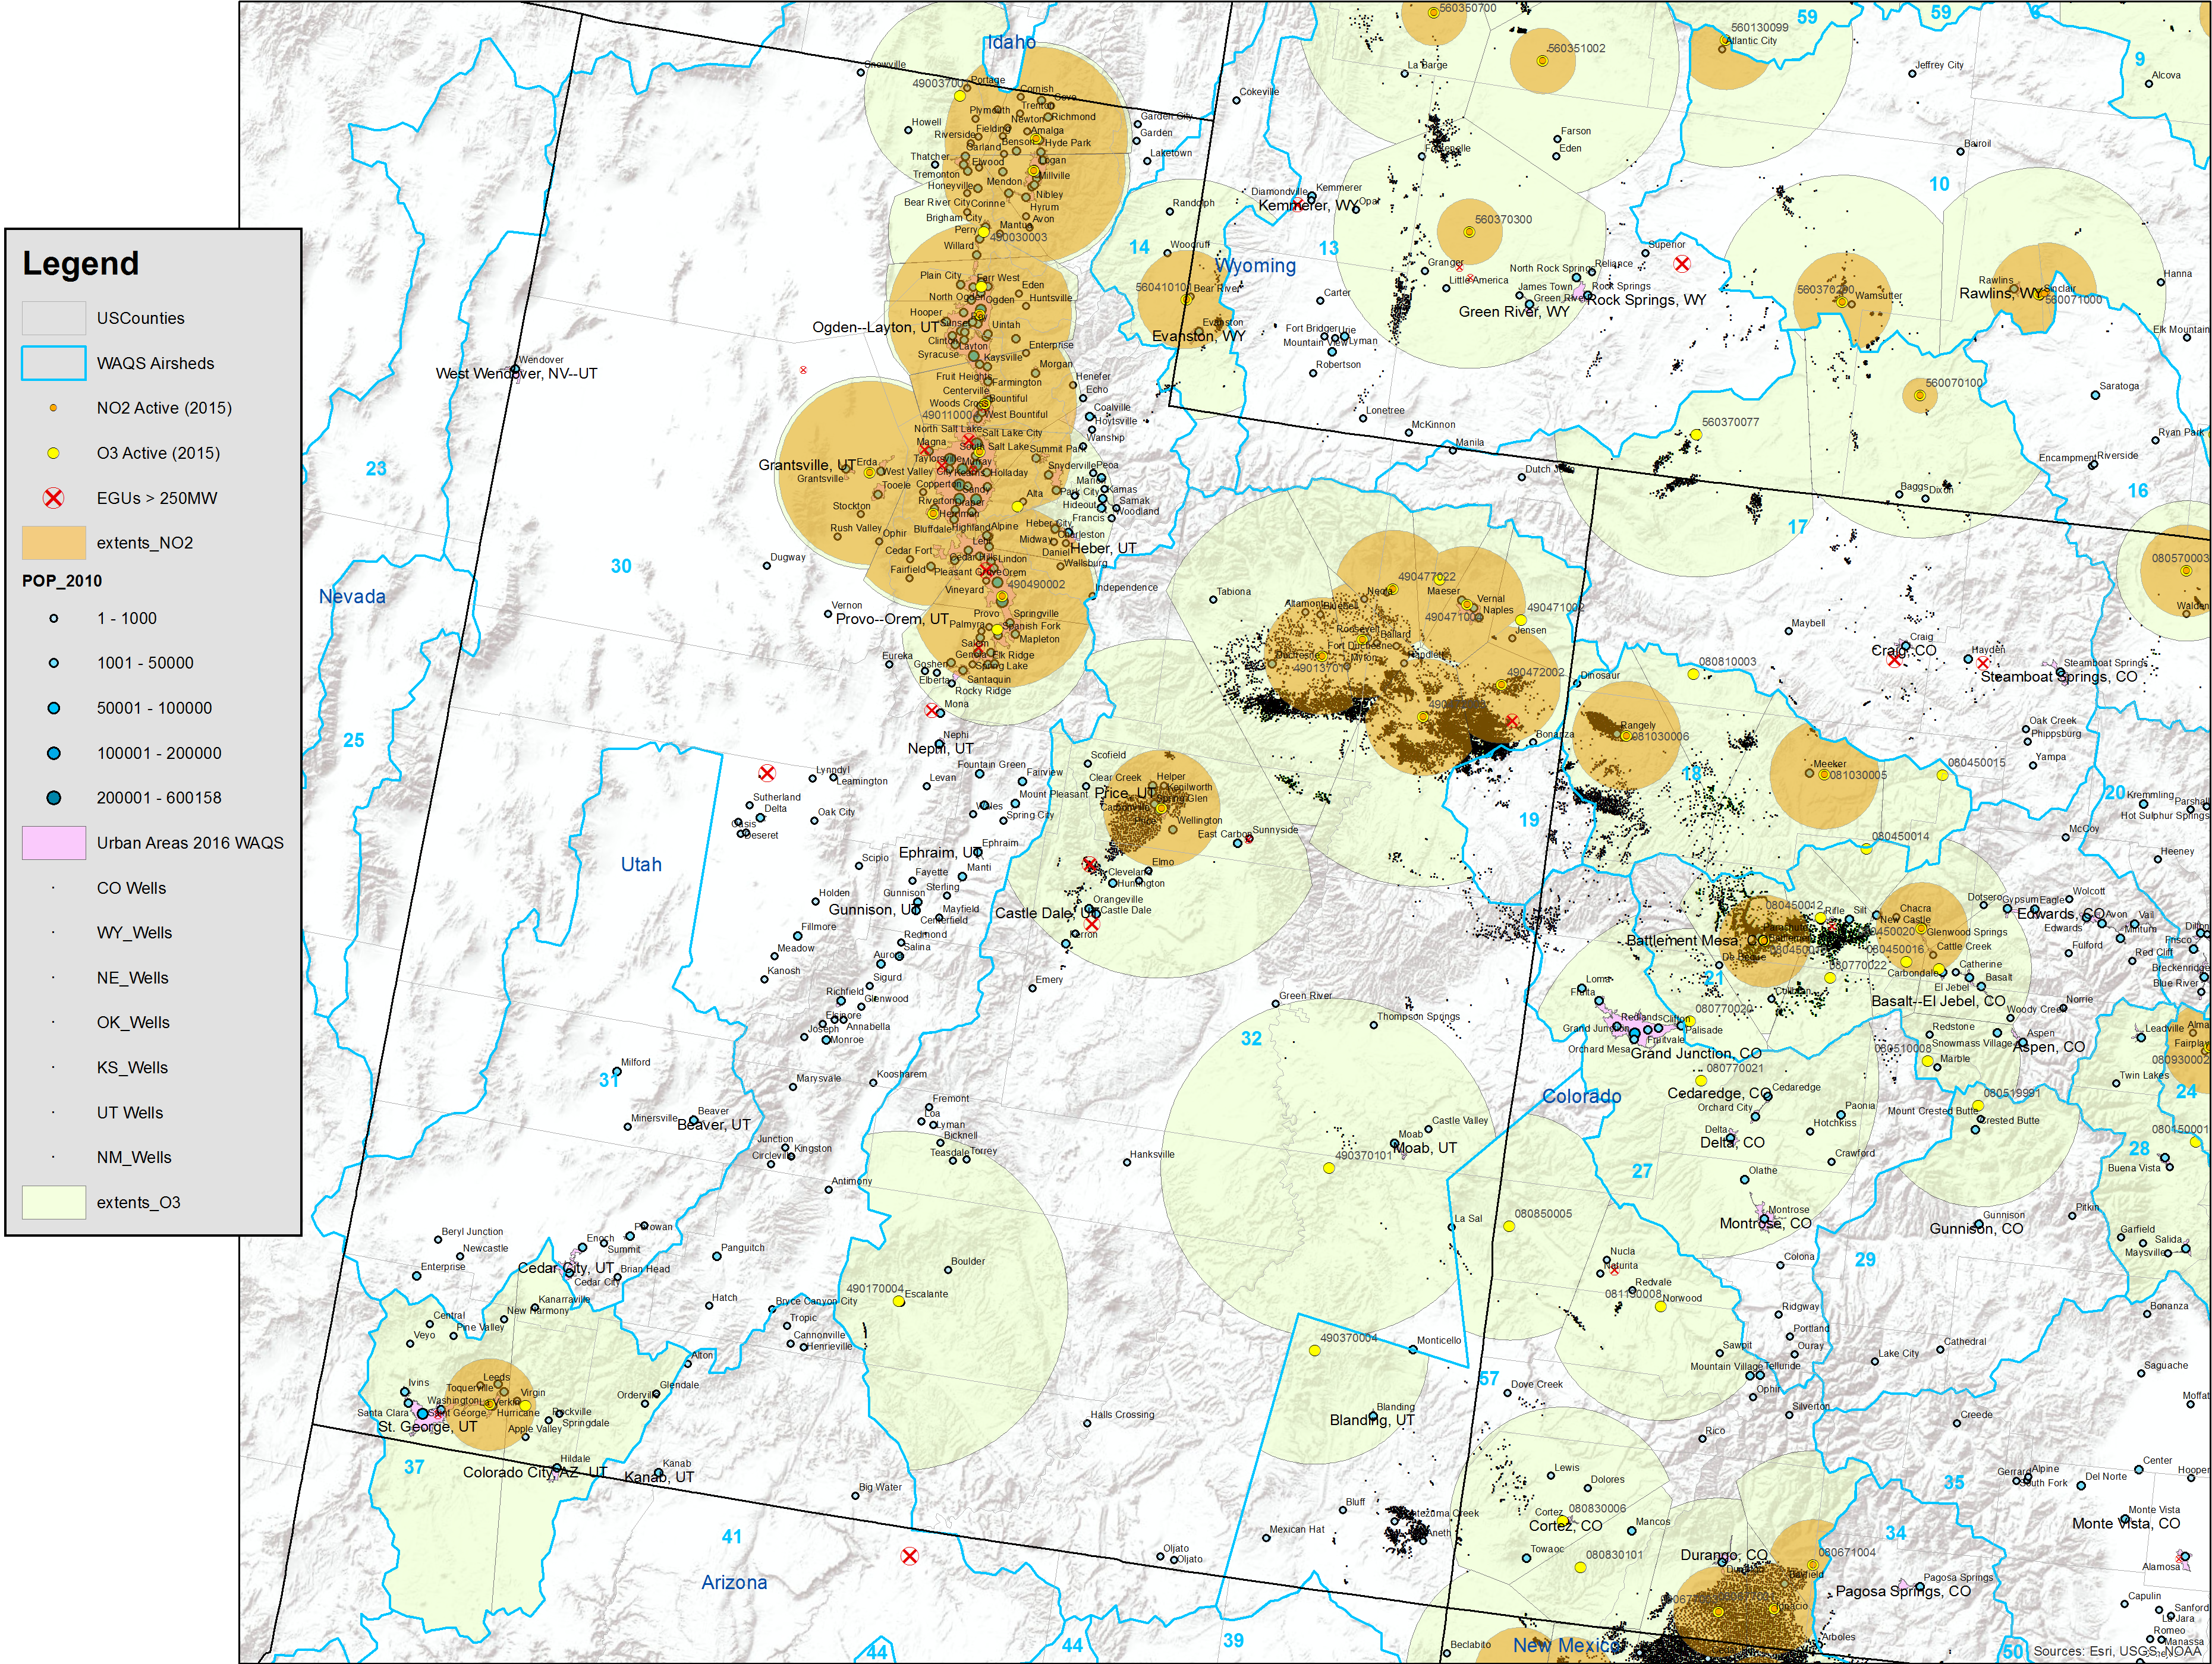
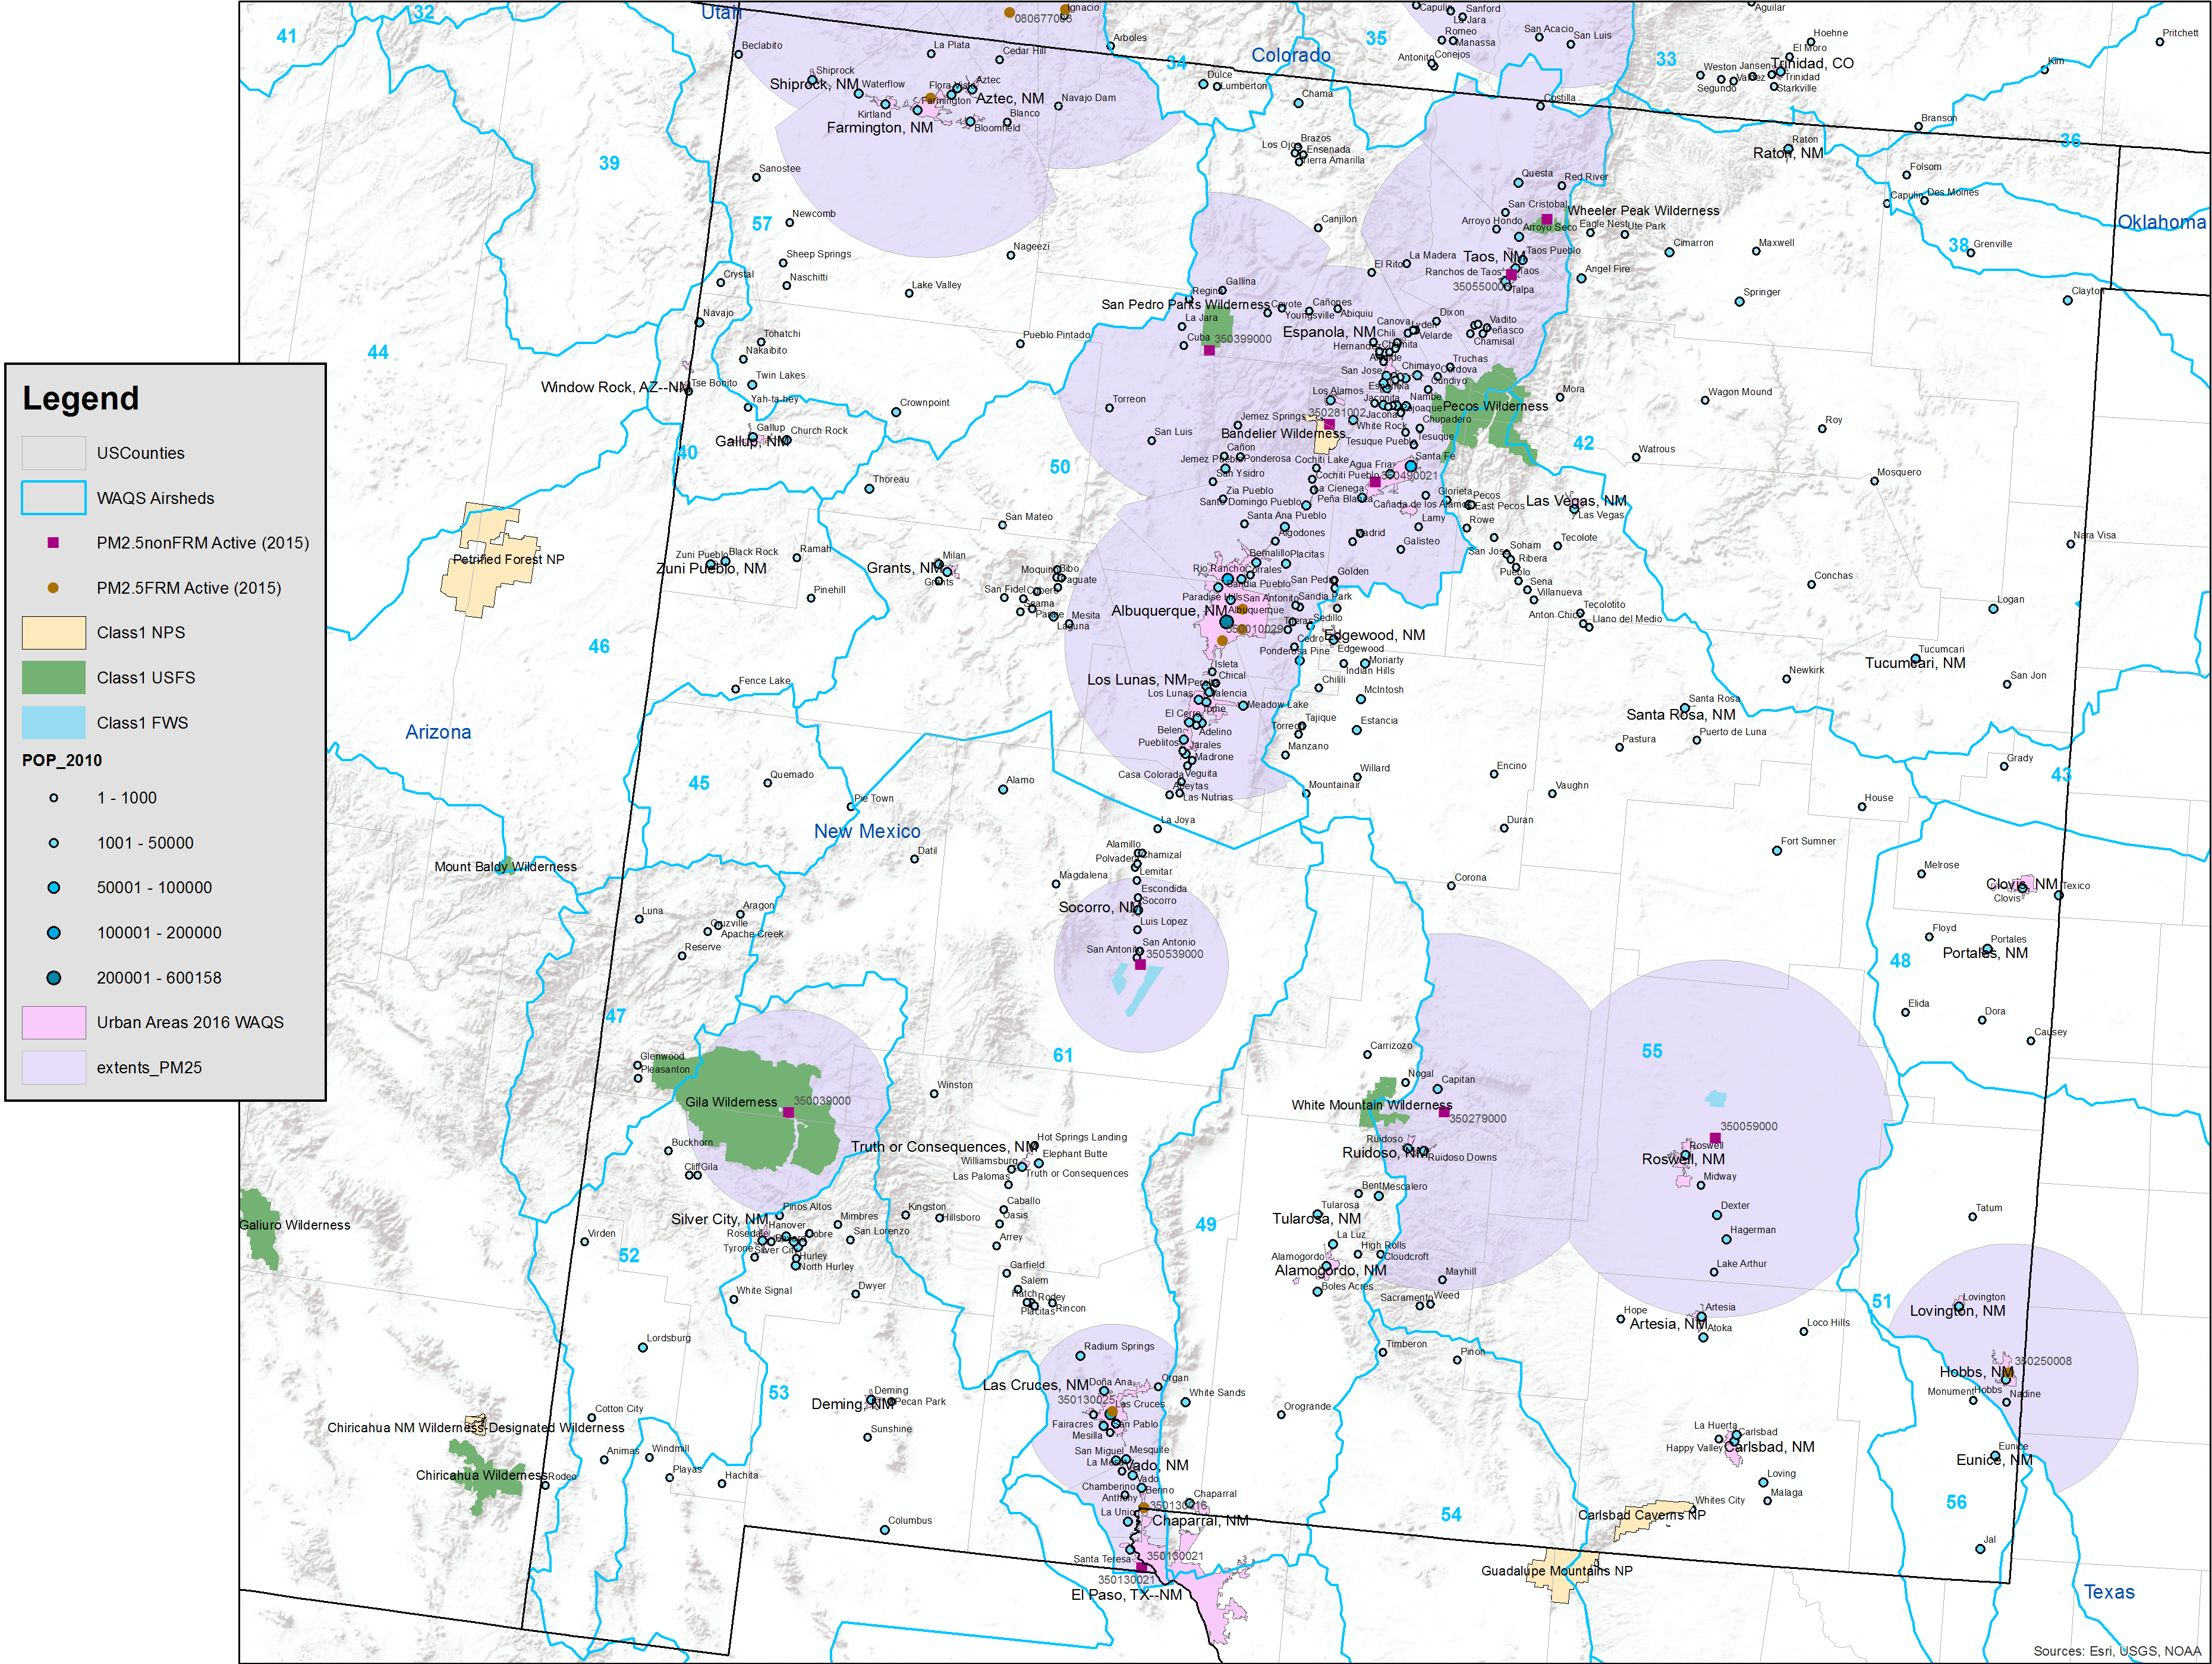
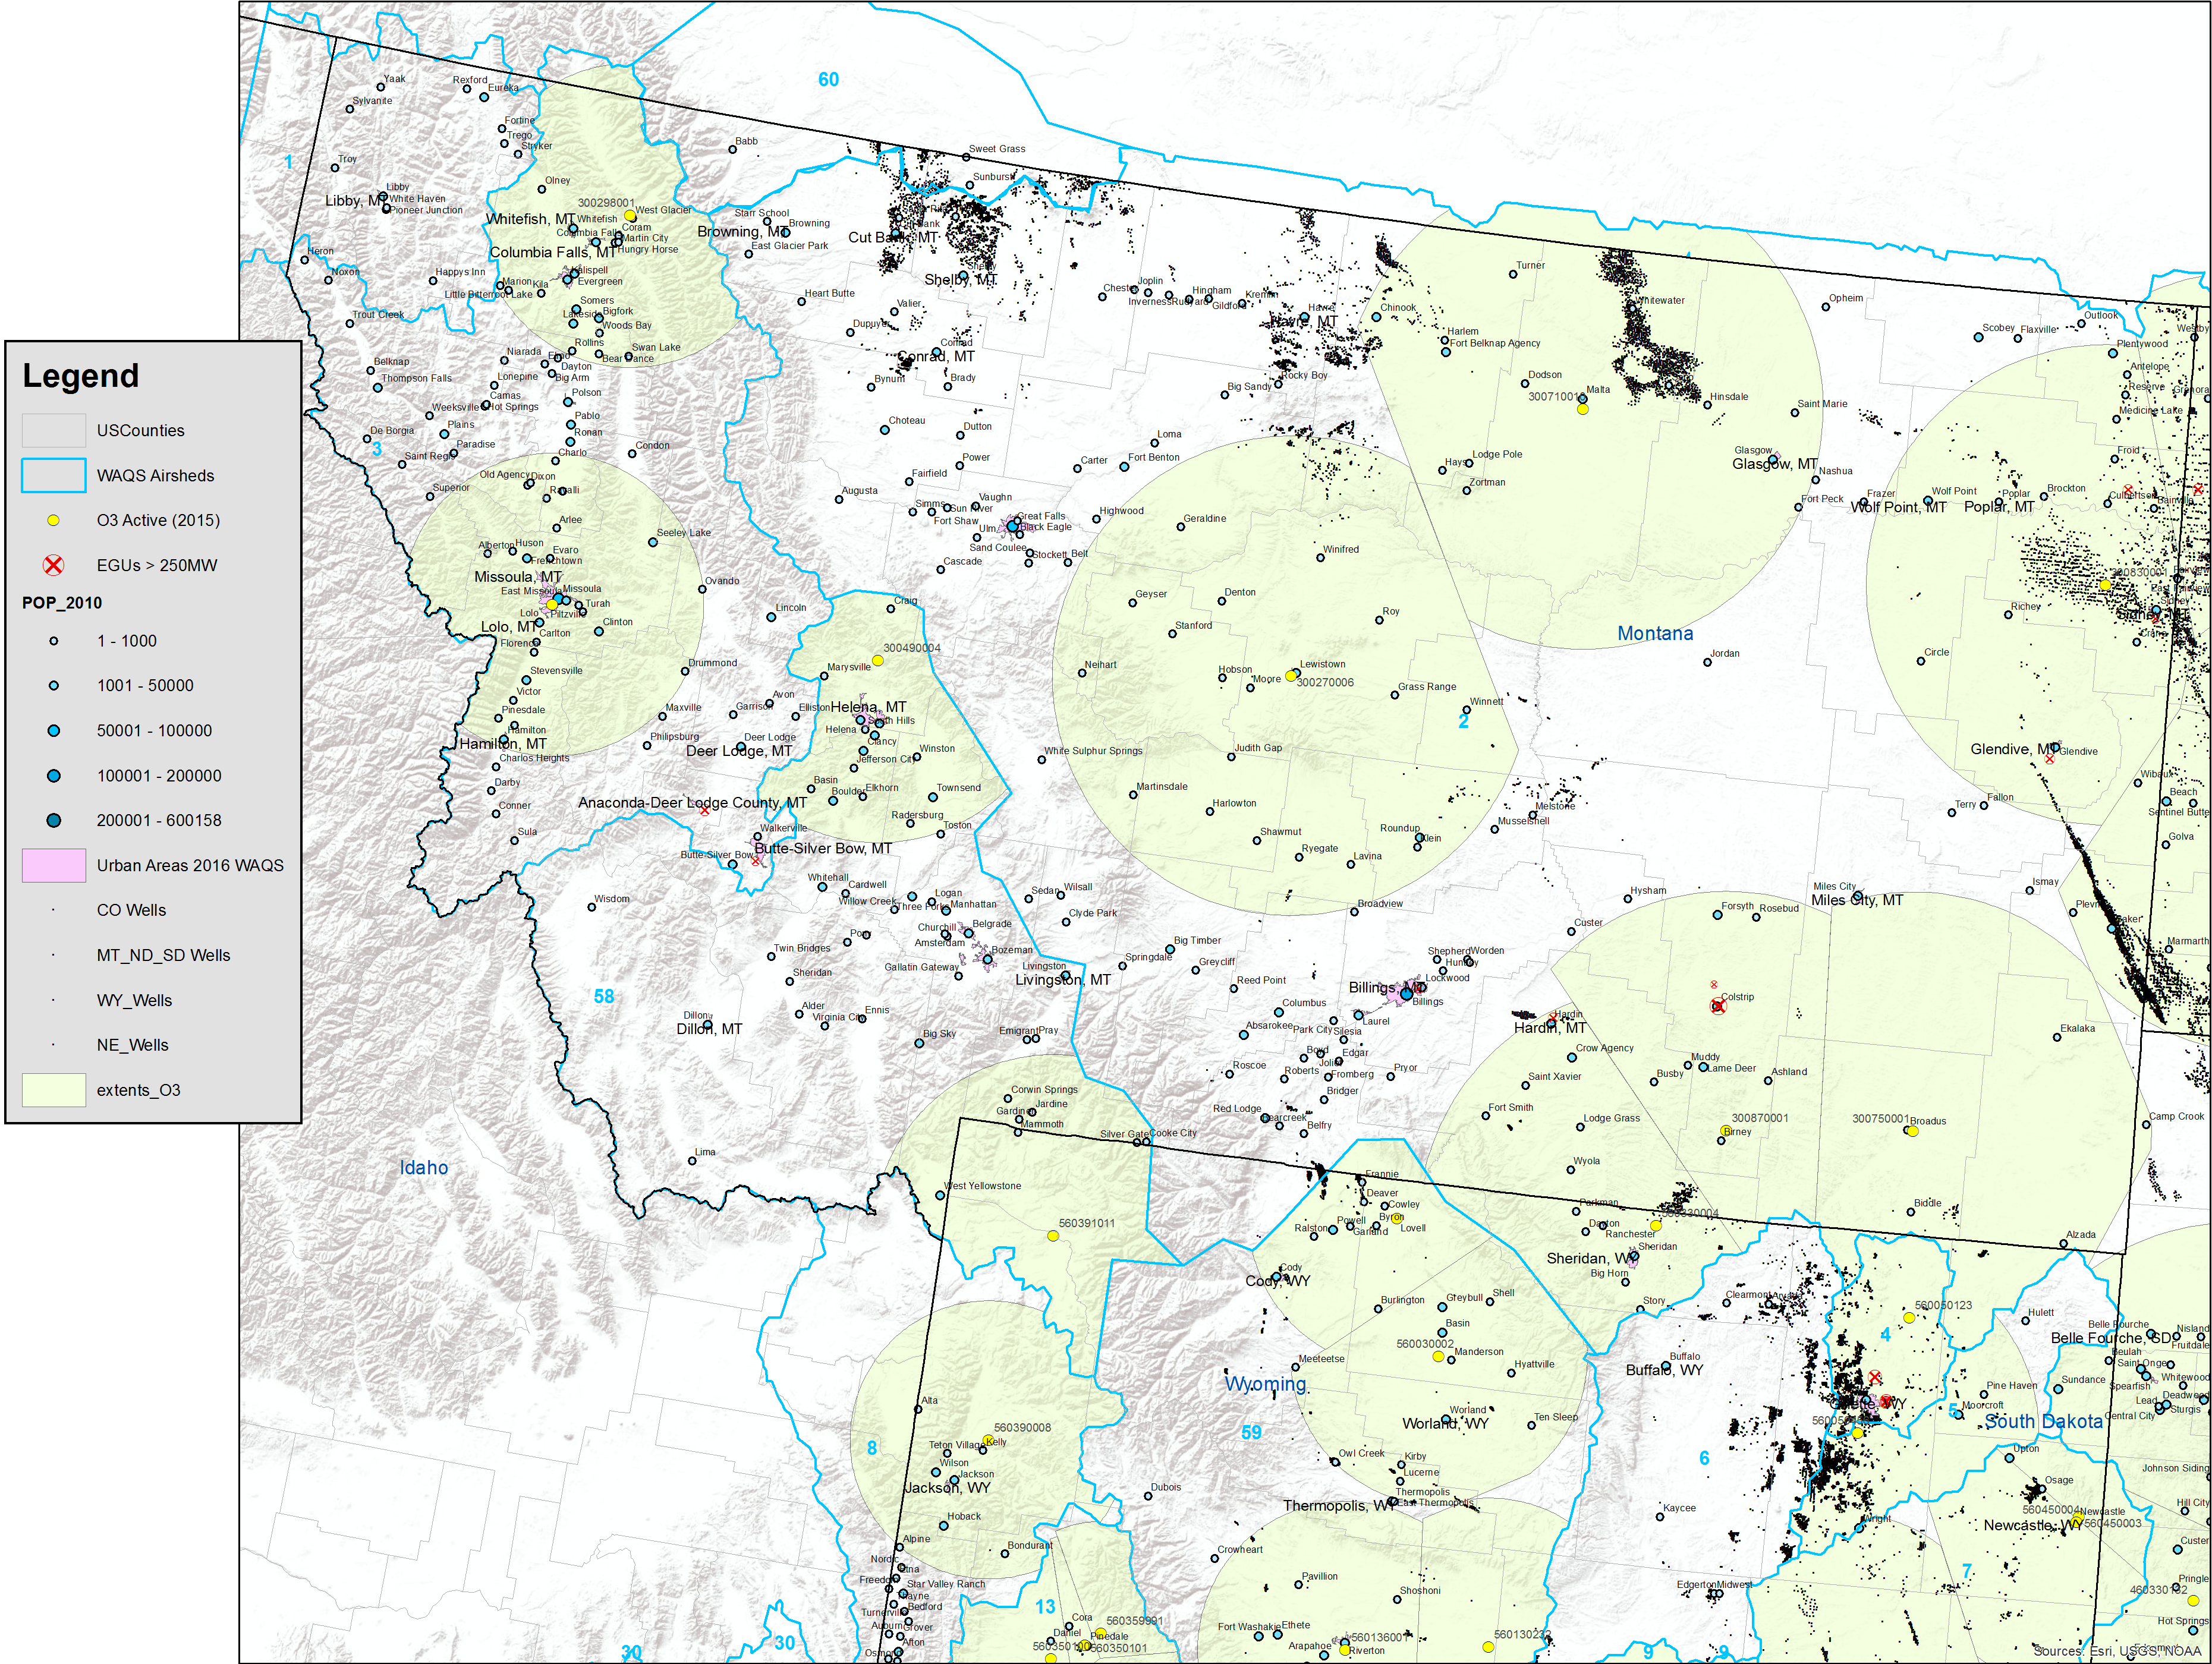
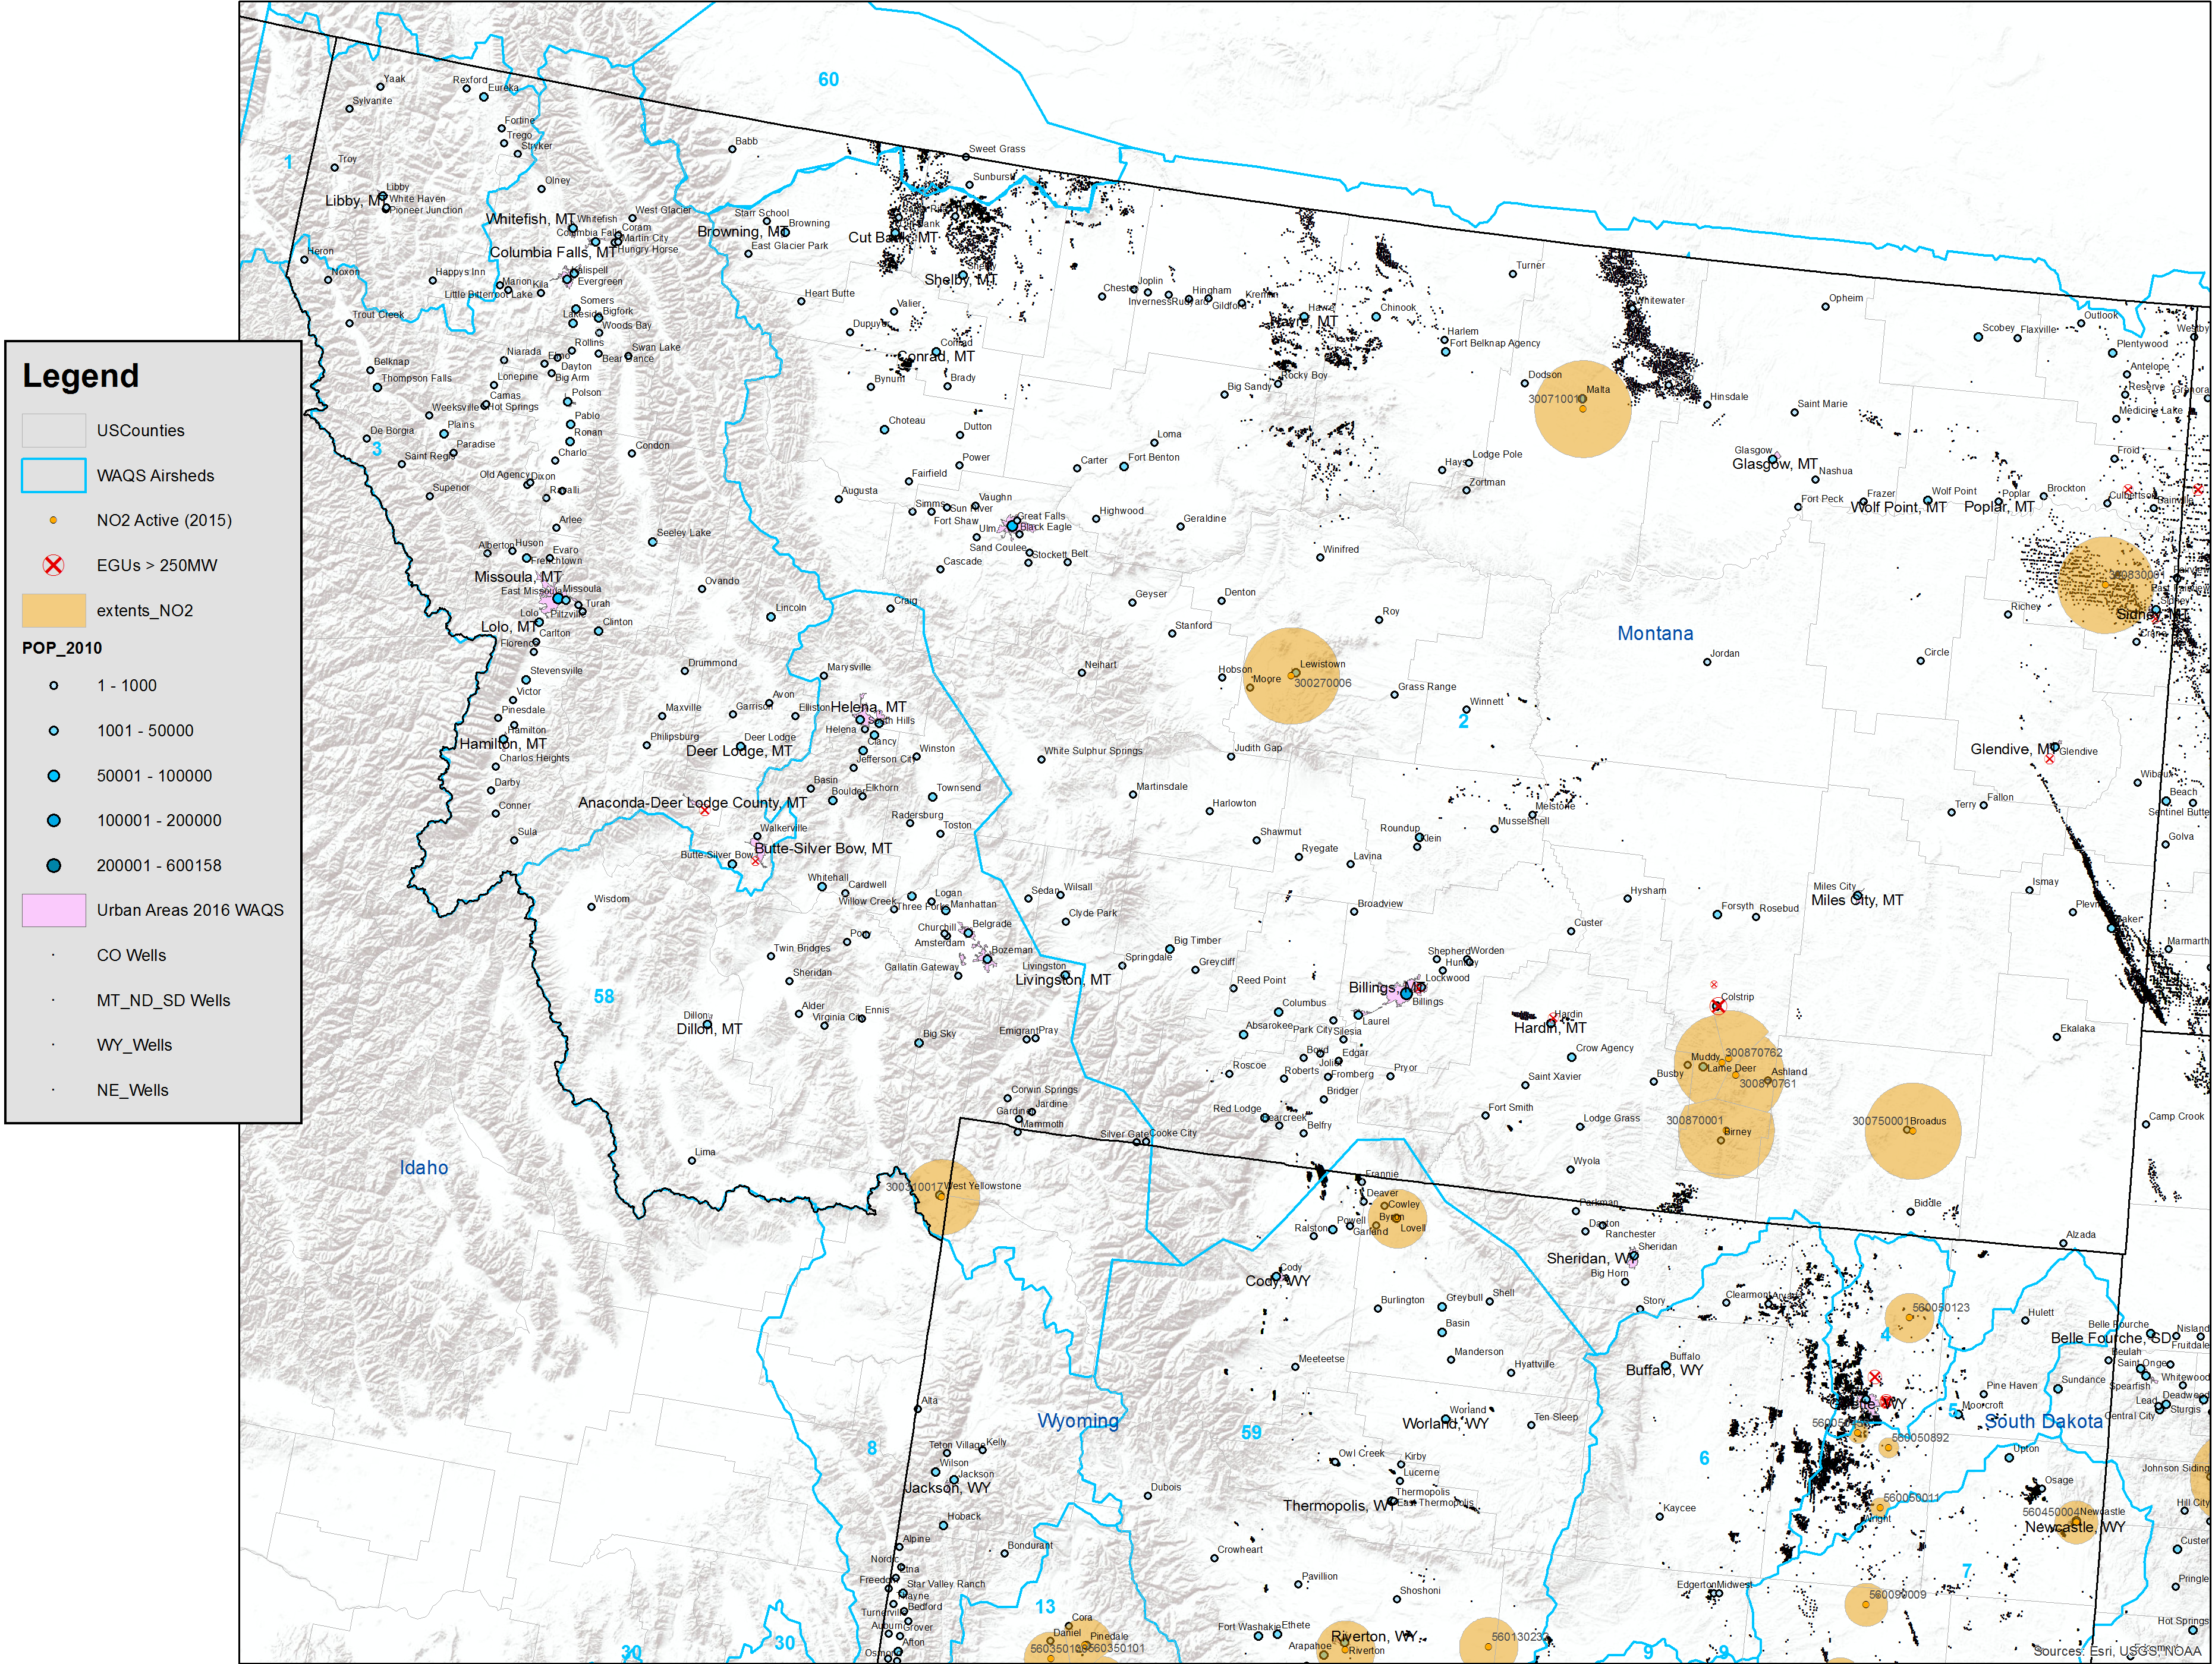
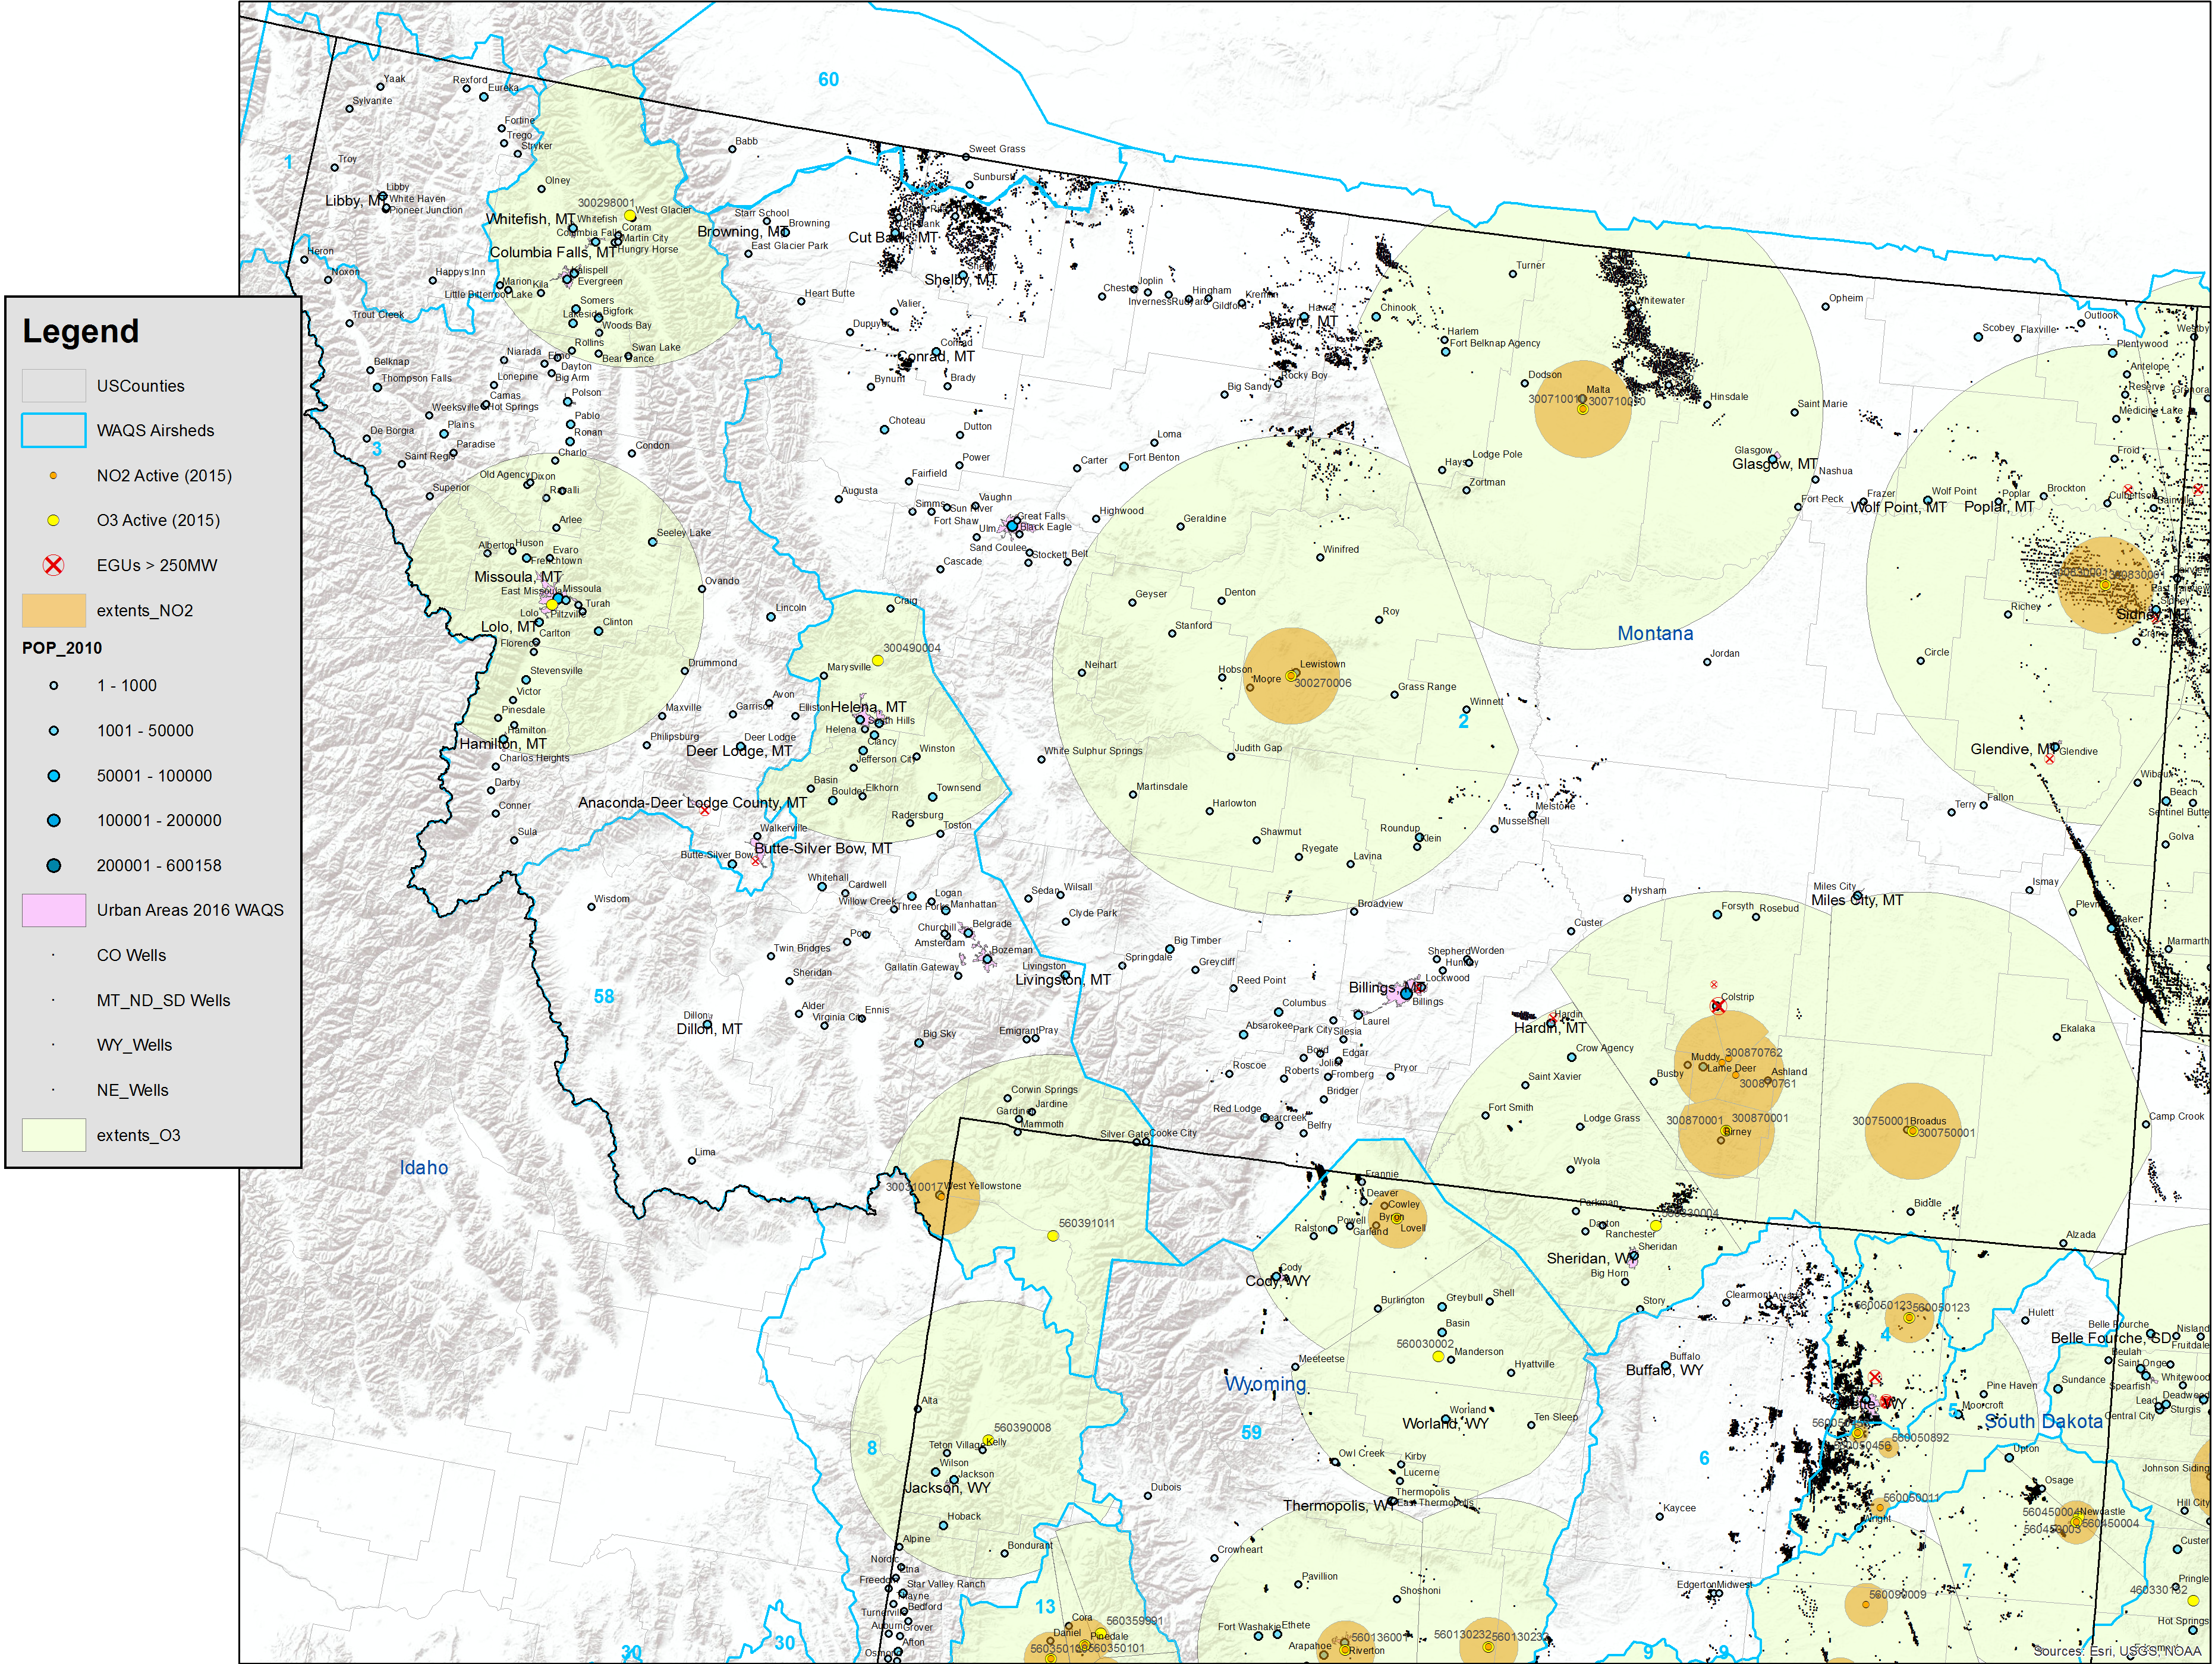
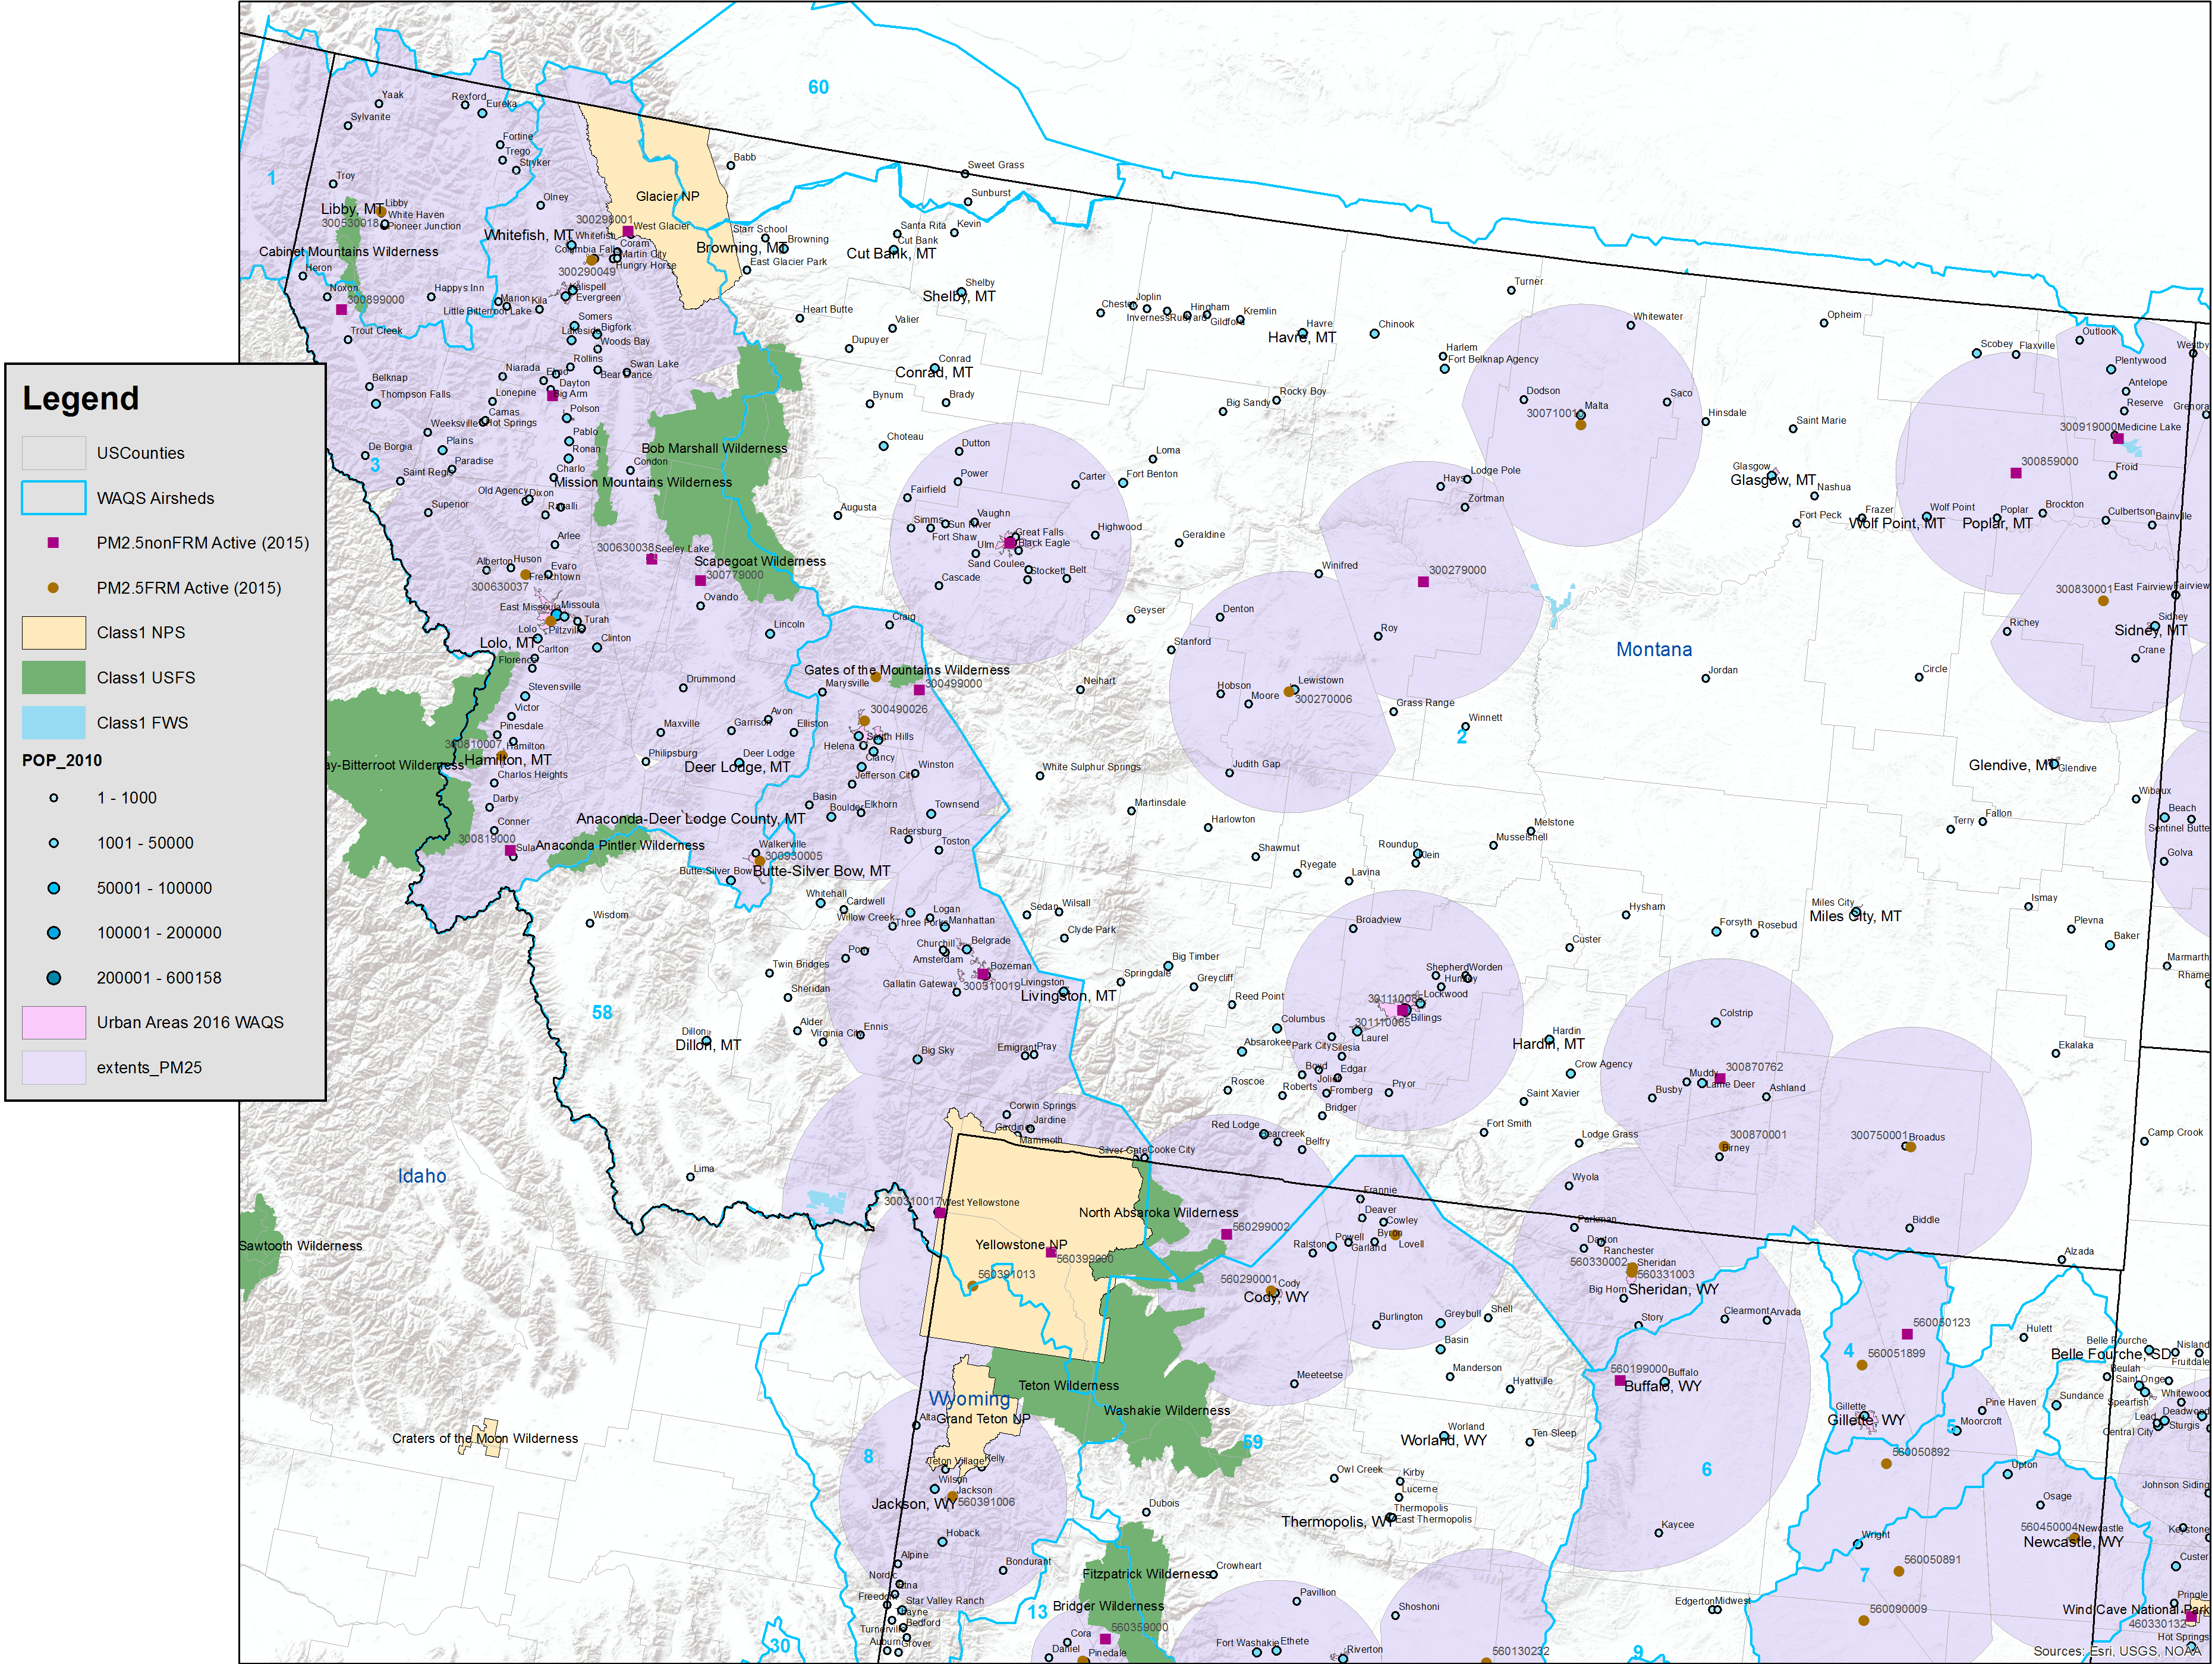
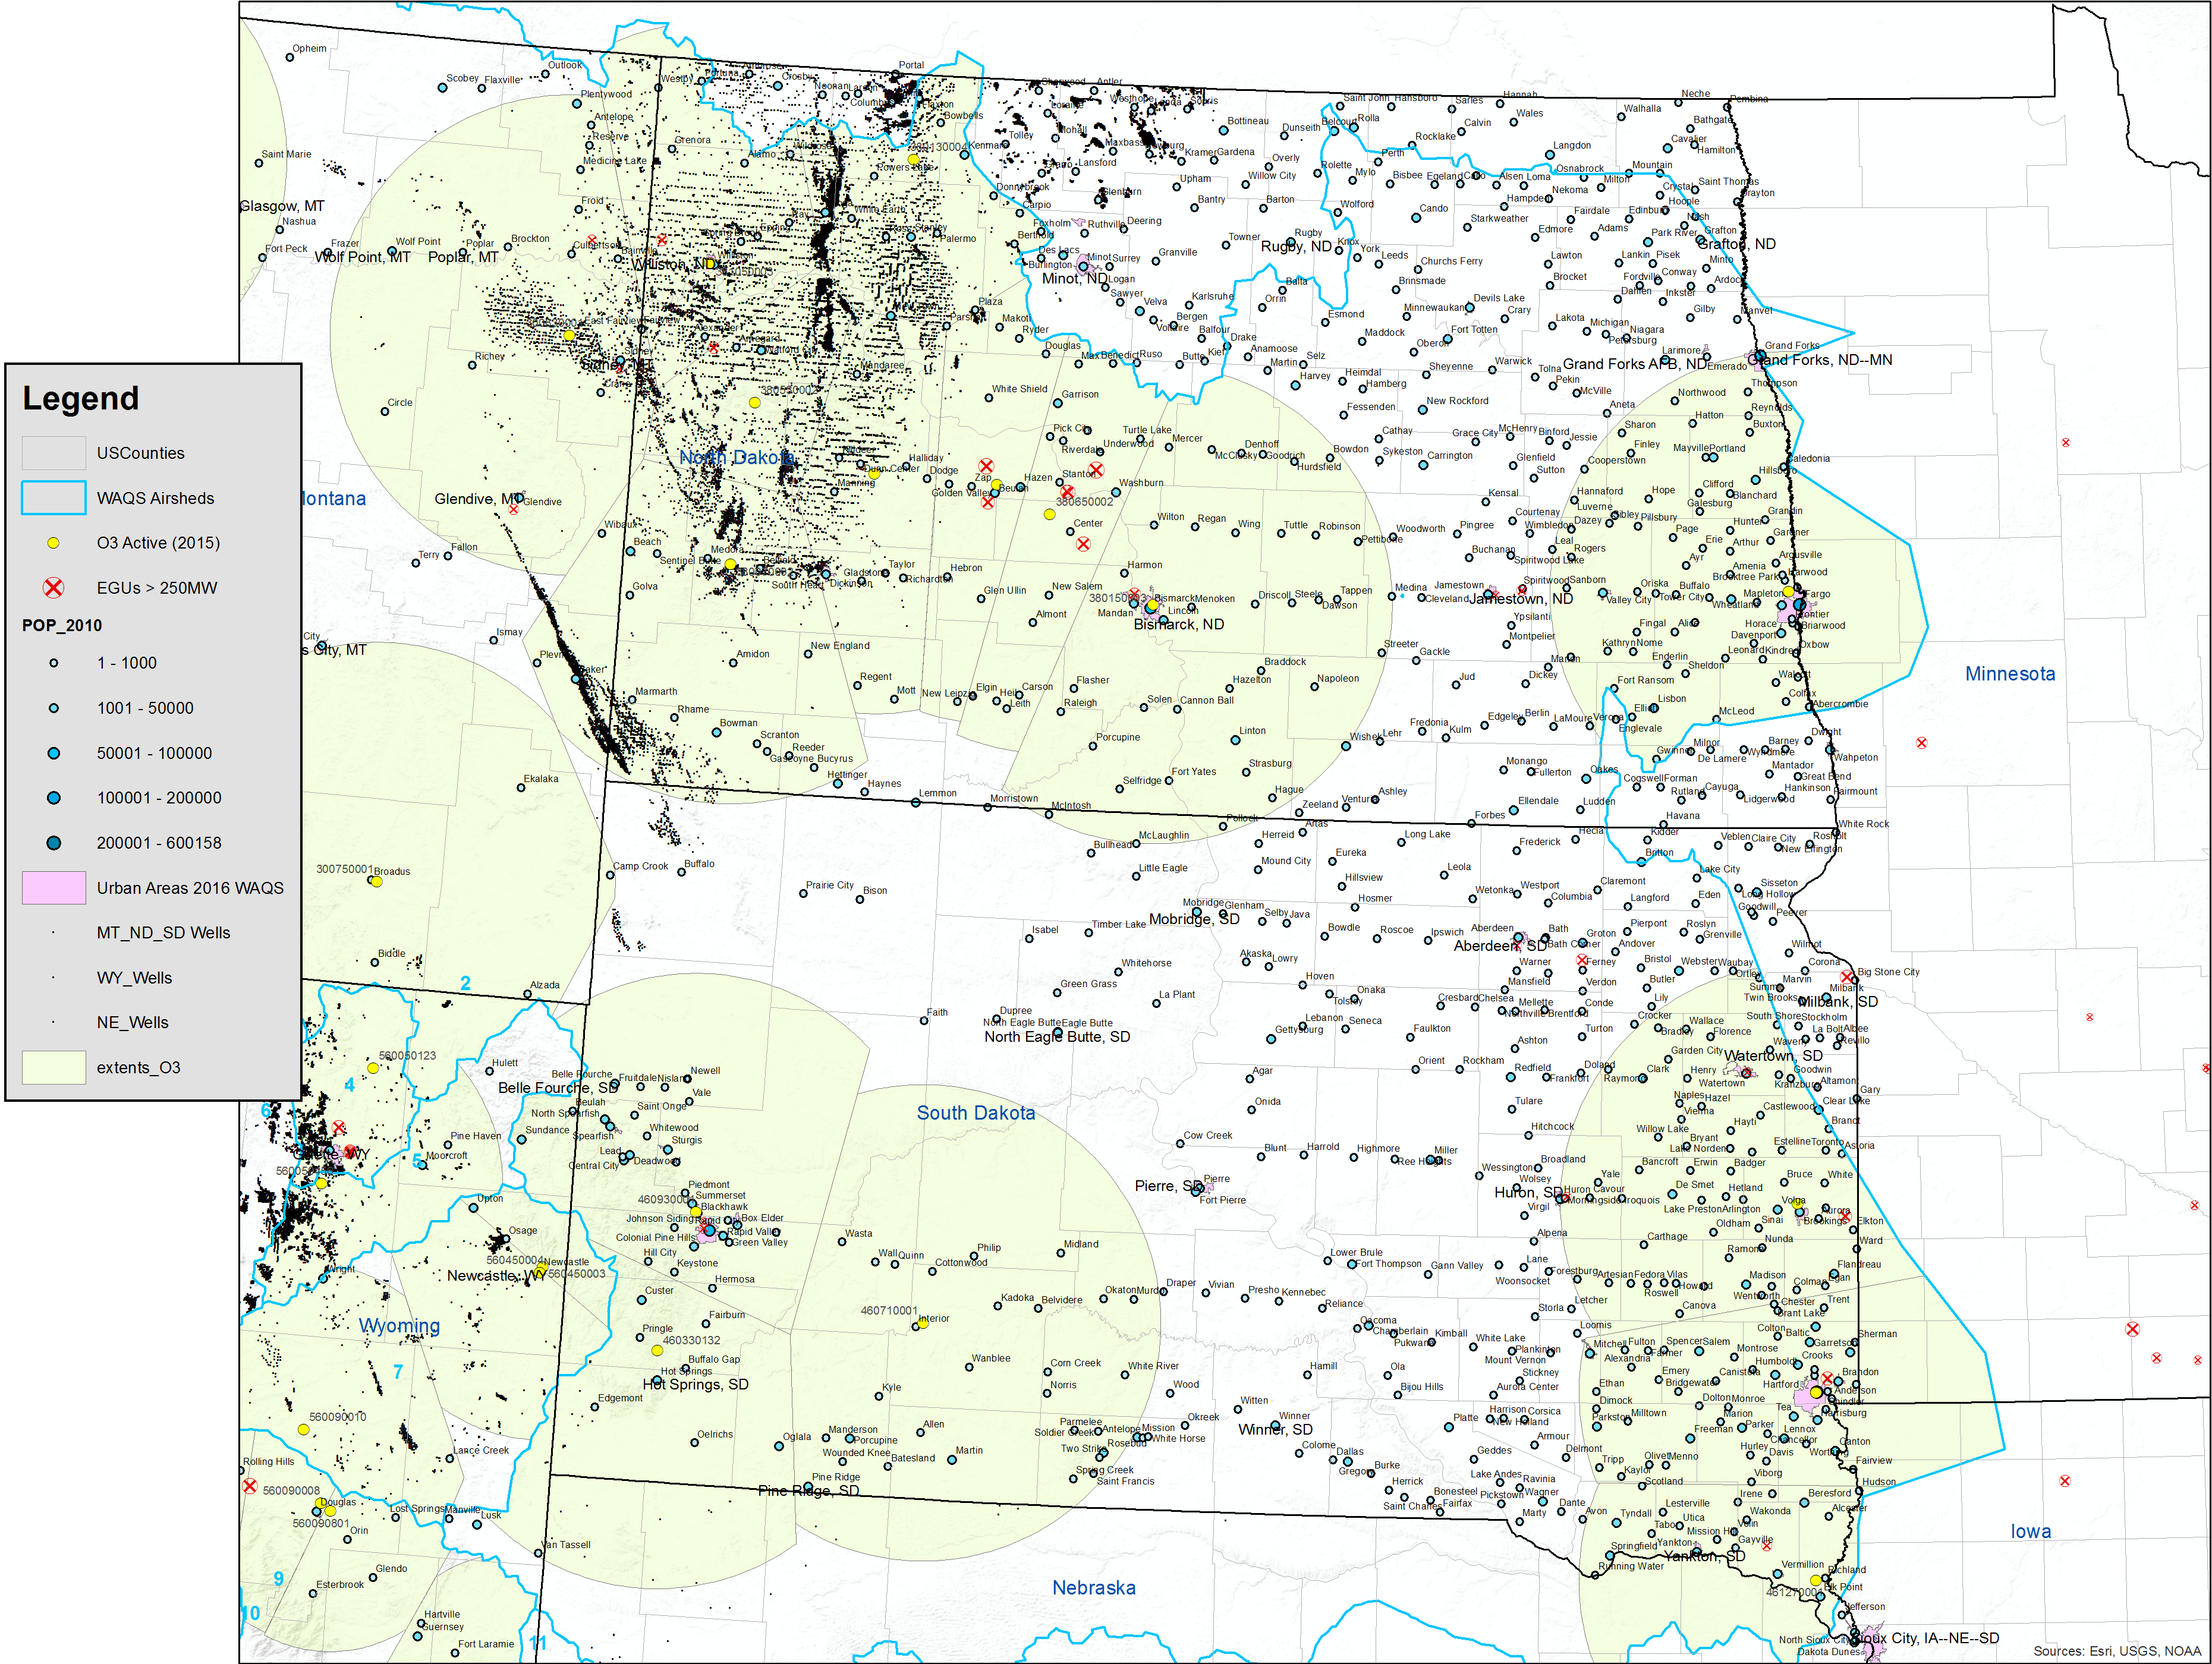
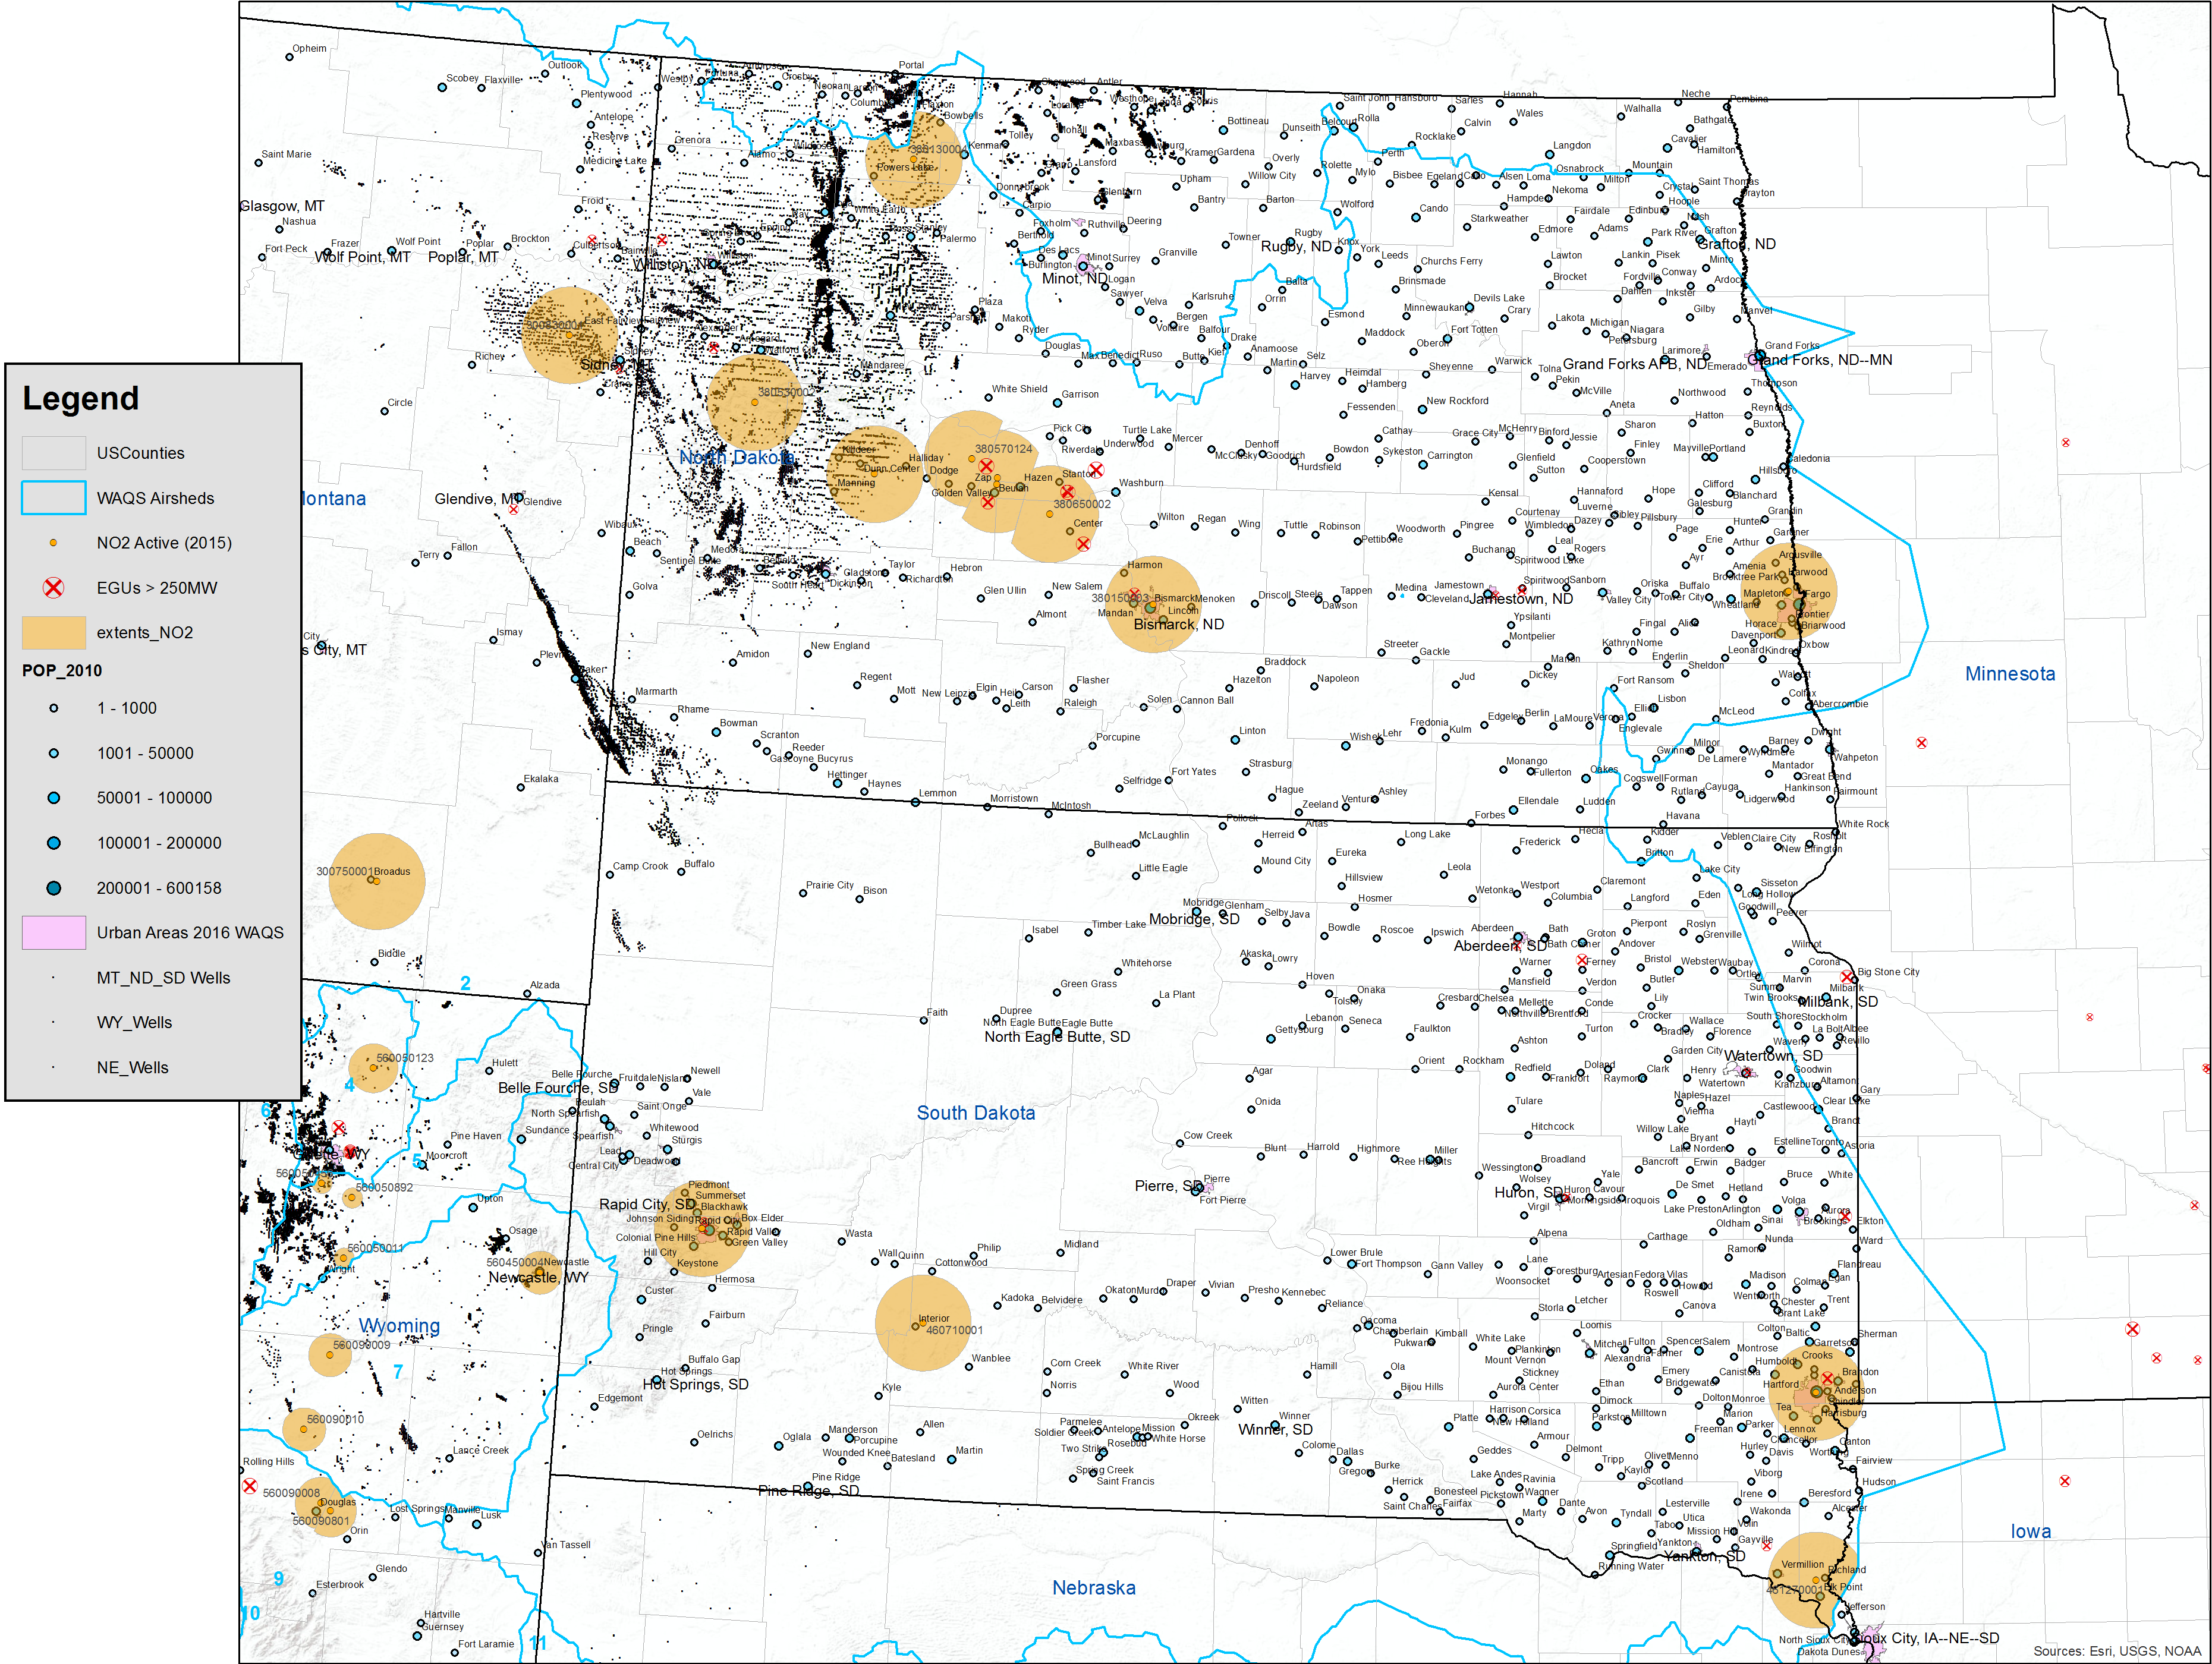
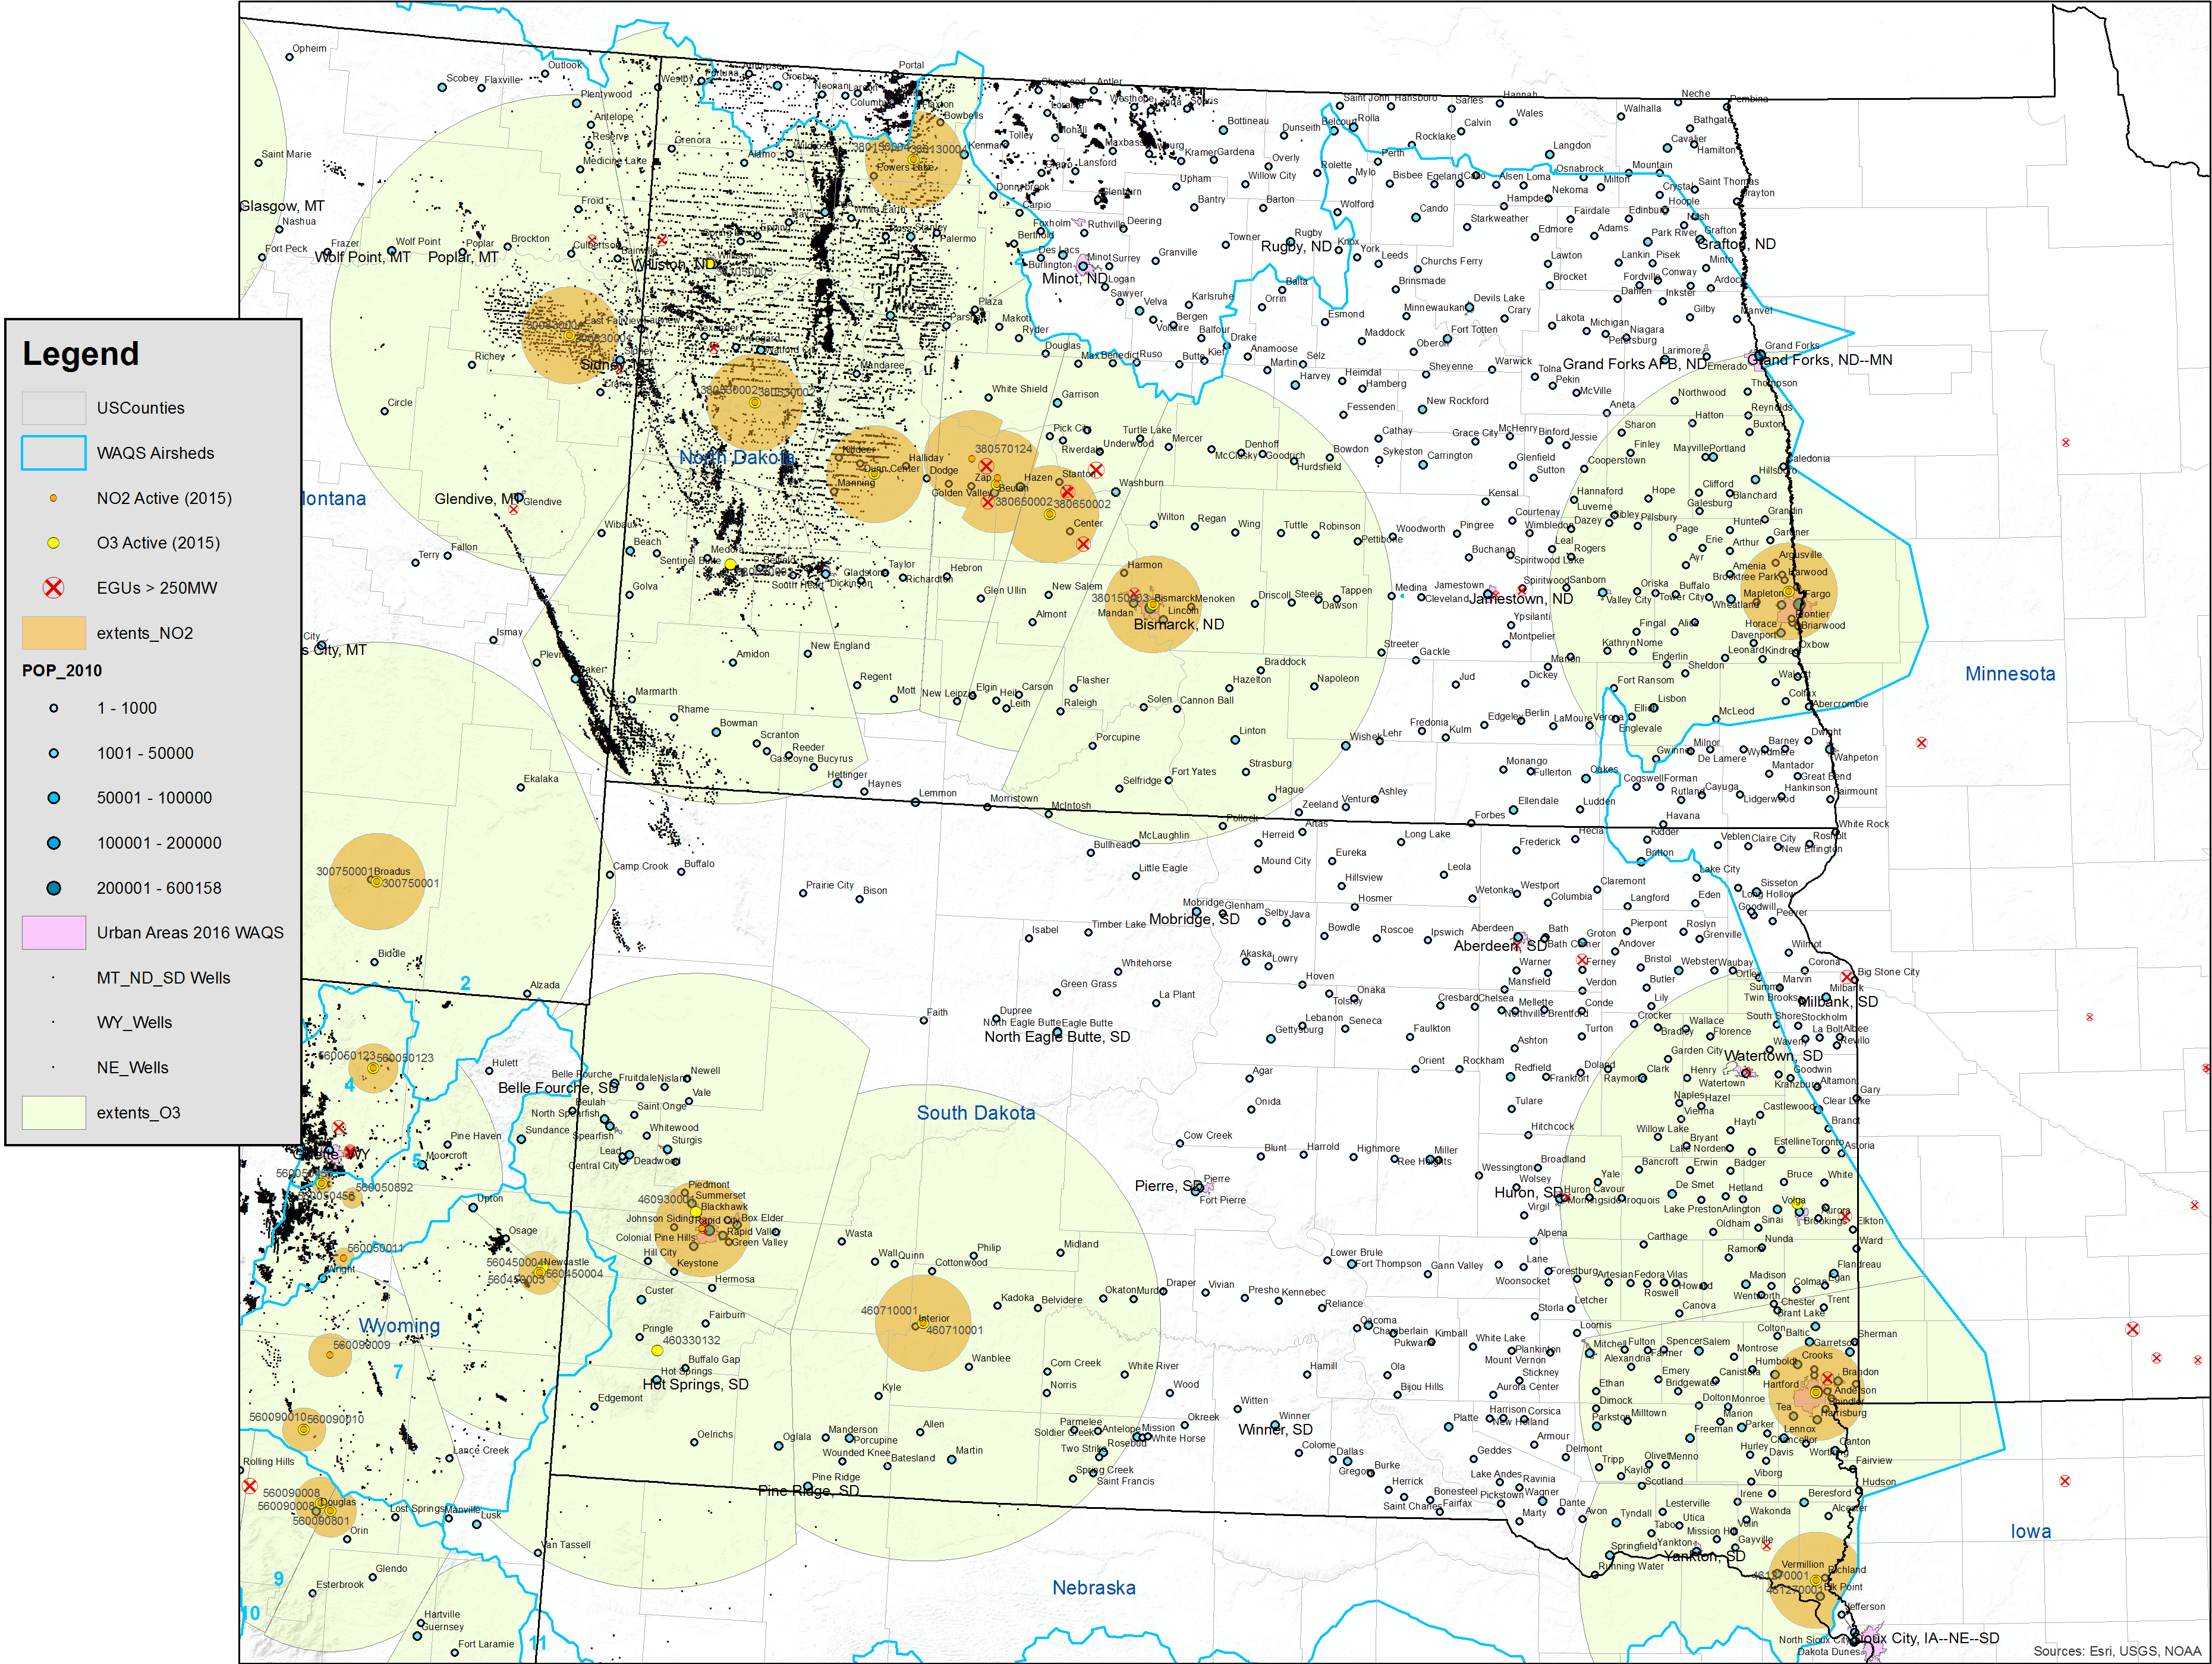
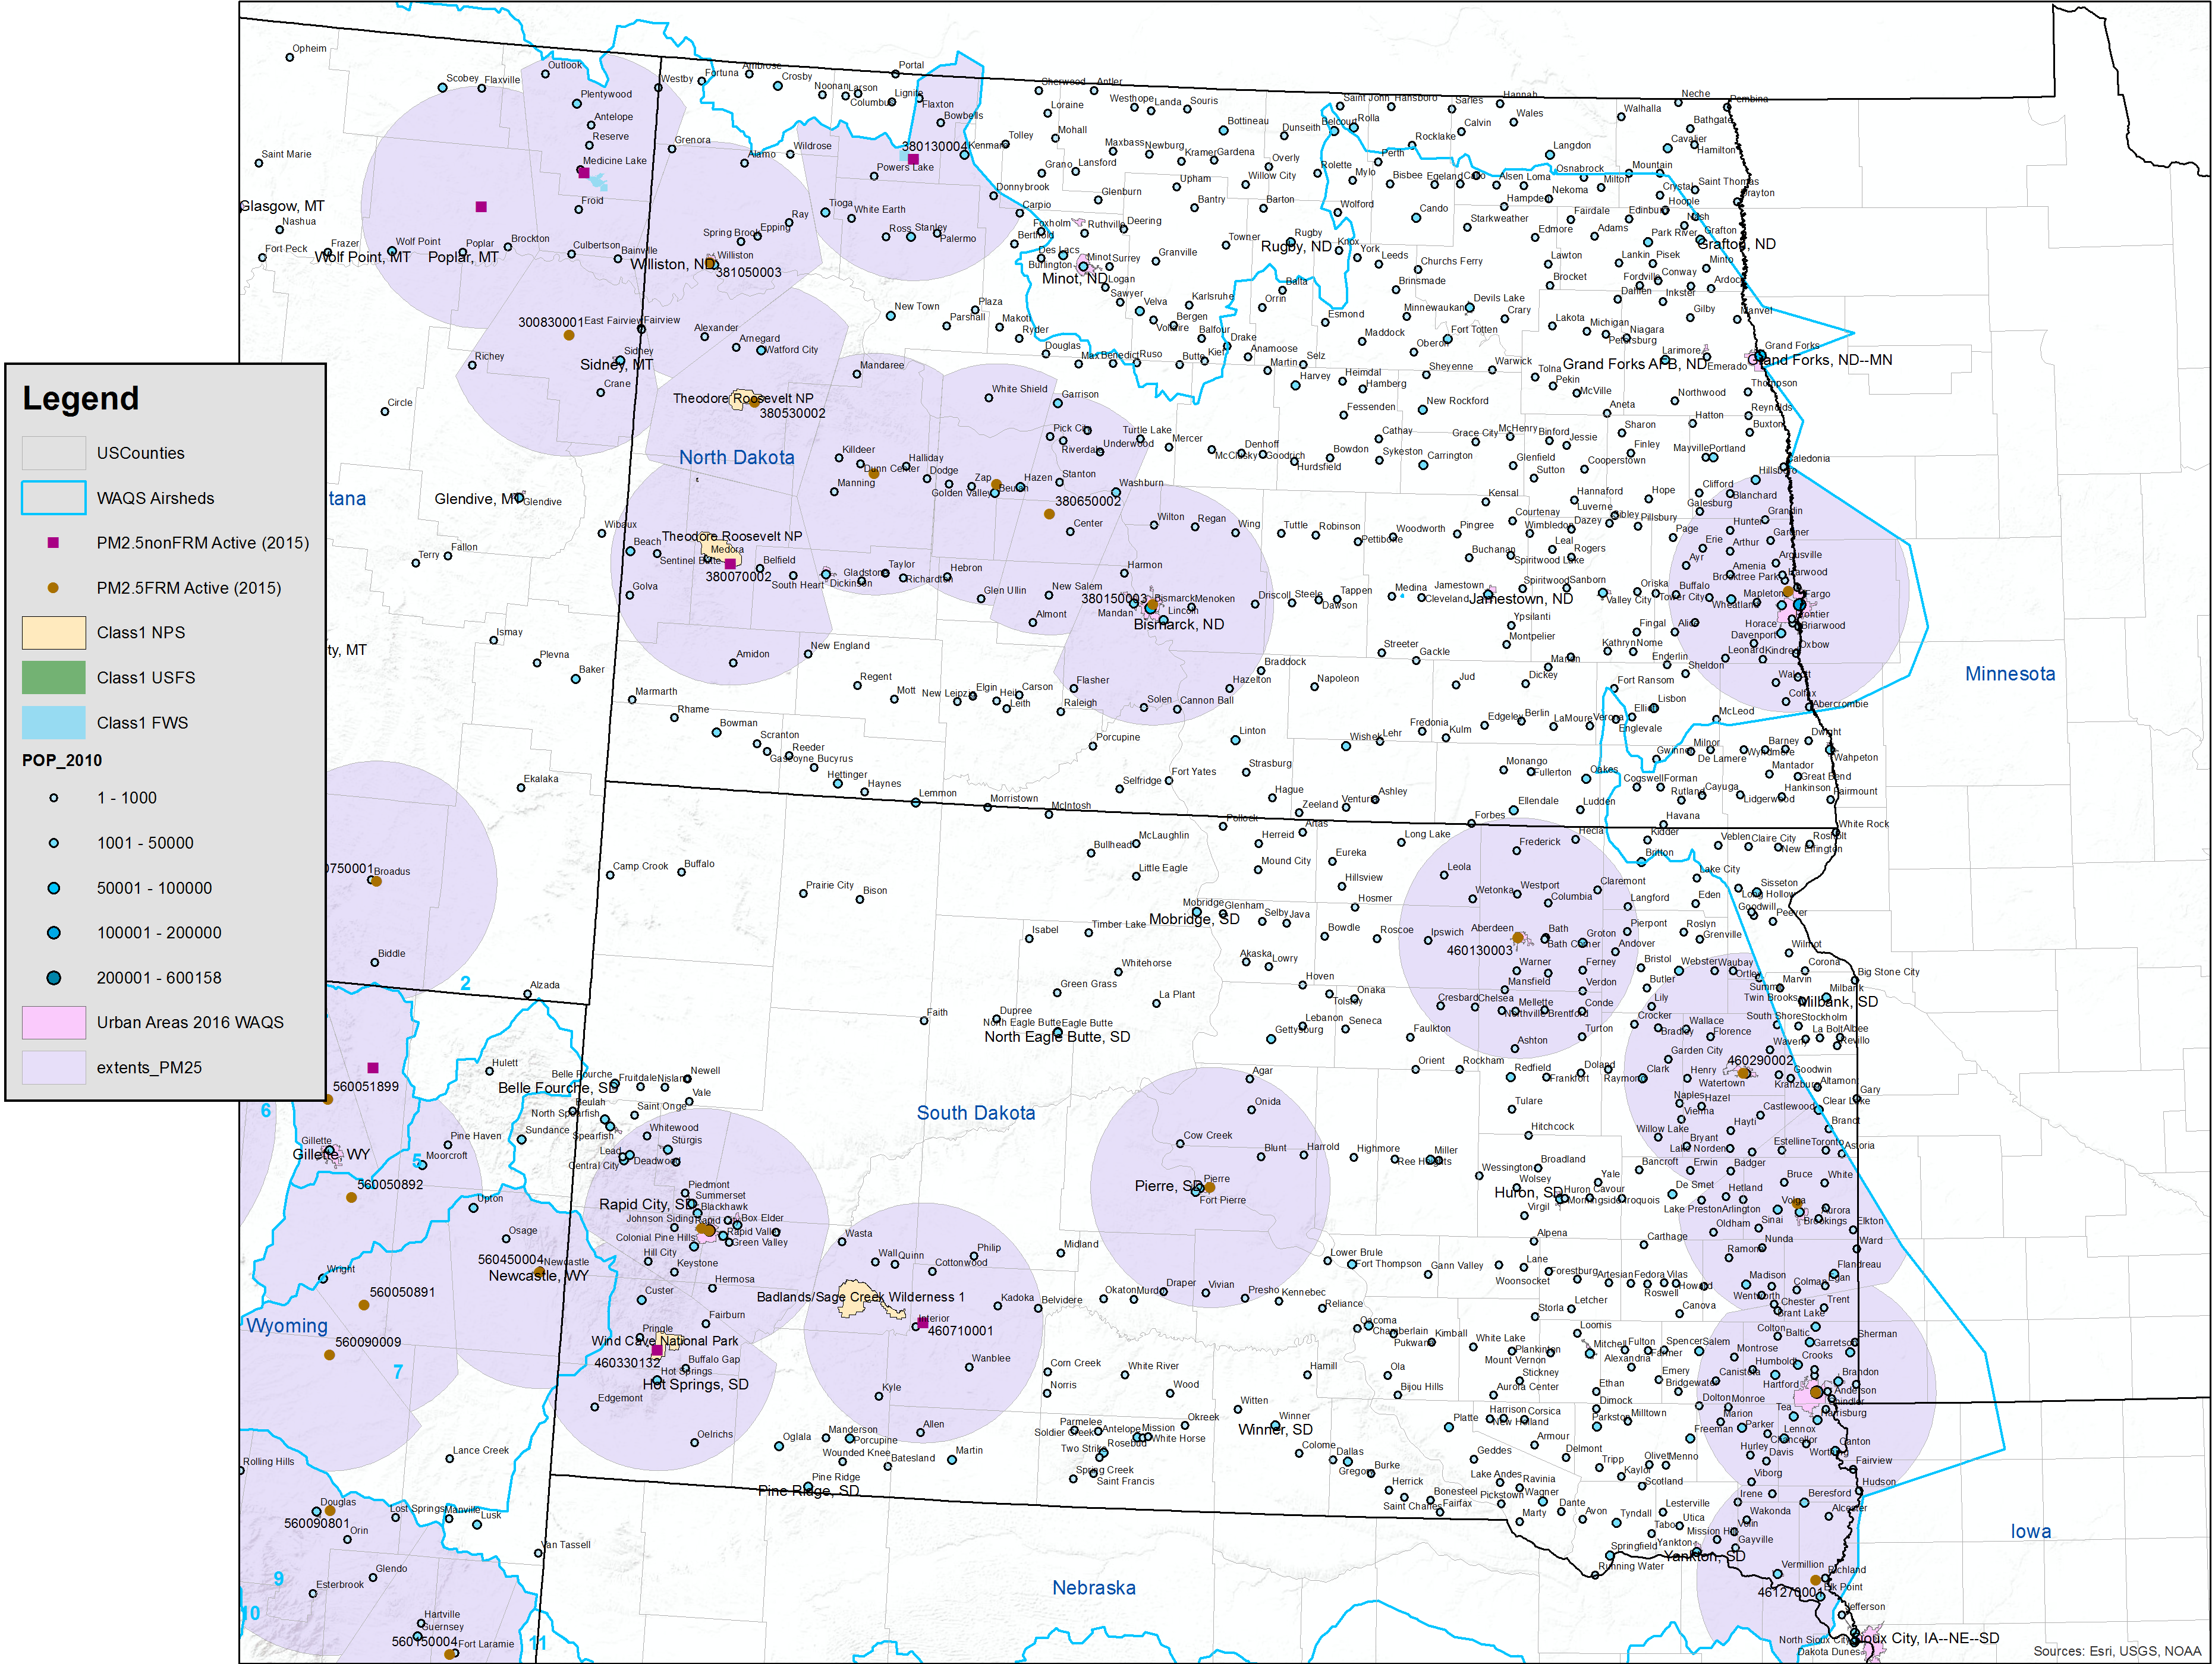
Maps showing monitor locations, O&G wells, population centers. PM2.5 maps show Class I Areas.Colorado
O3 NO2 O3&NO2 PM2.5
(O3 and NO2 maps include well locations for 'approved and pending' permits)
New Mexico
O3 NO2 O3&NO2 PM2.5
North and South Dakota
O3 NO2 O3&NO2 PM2.5
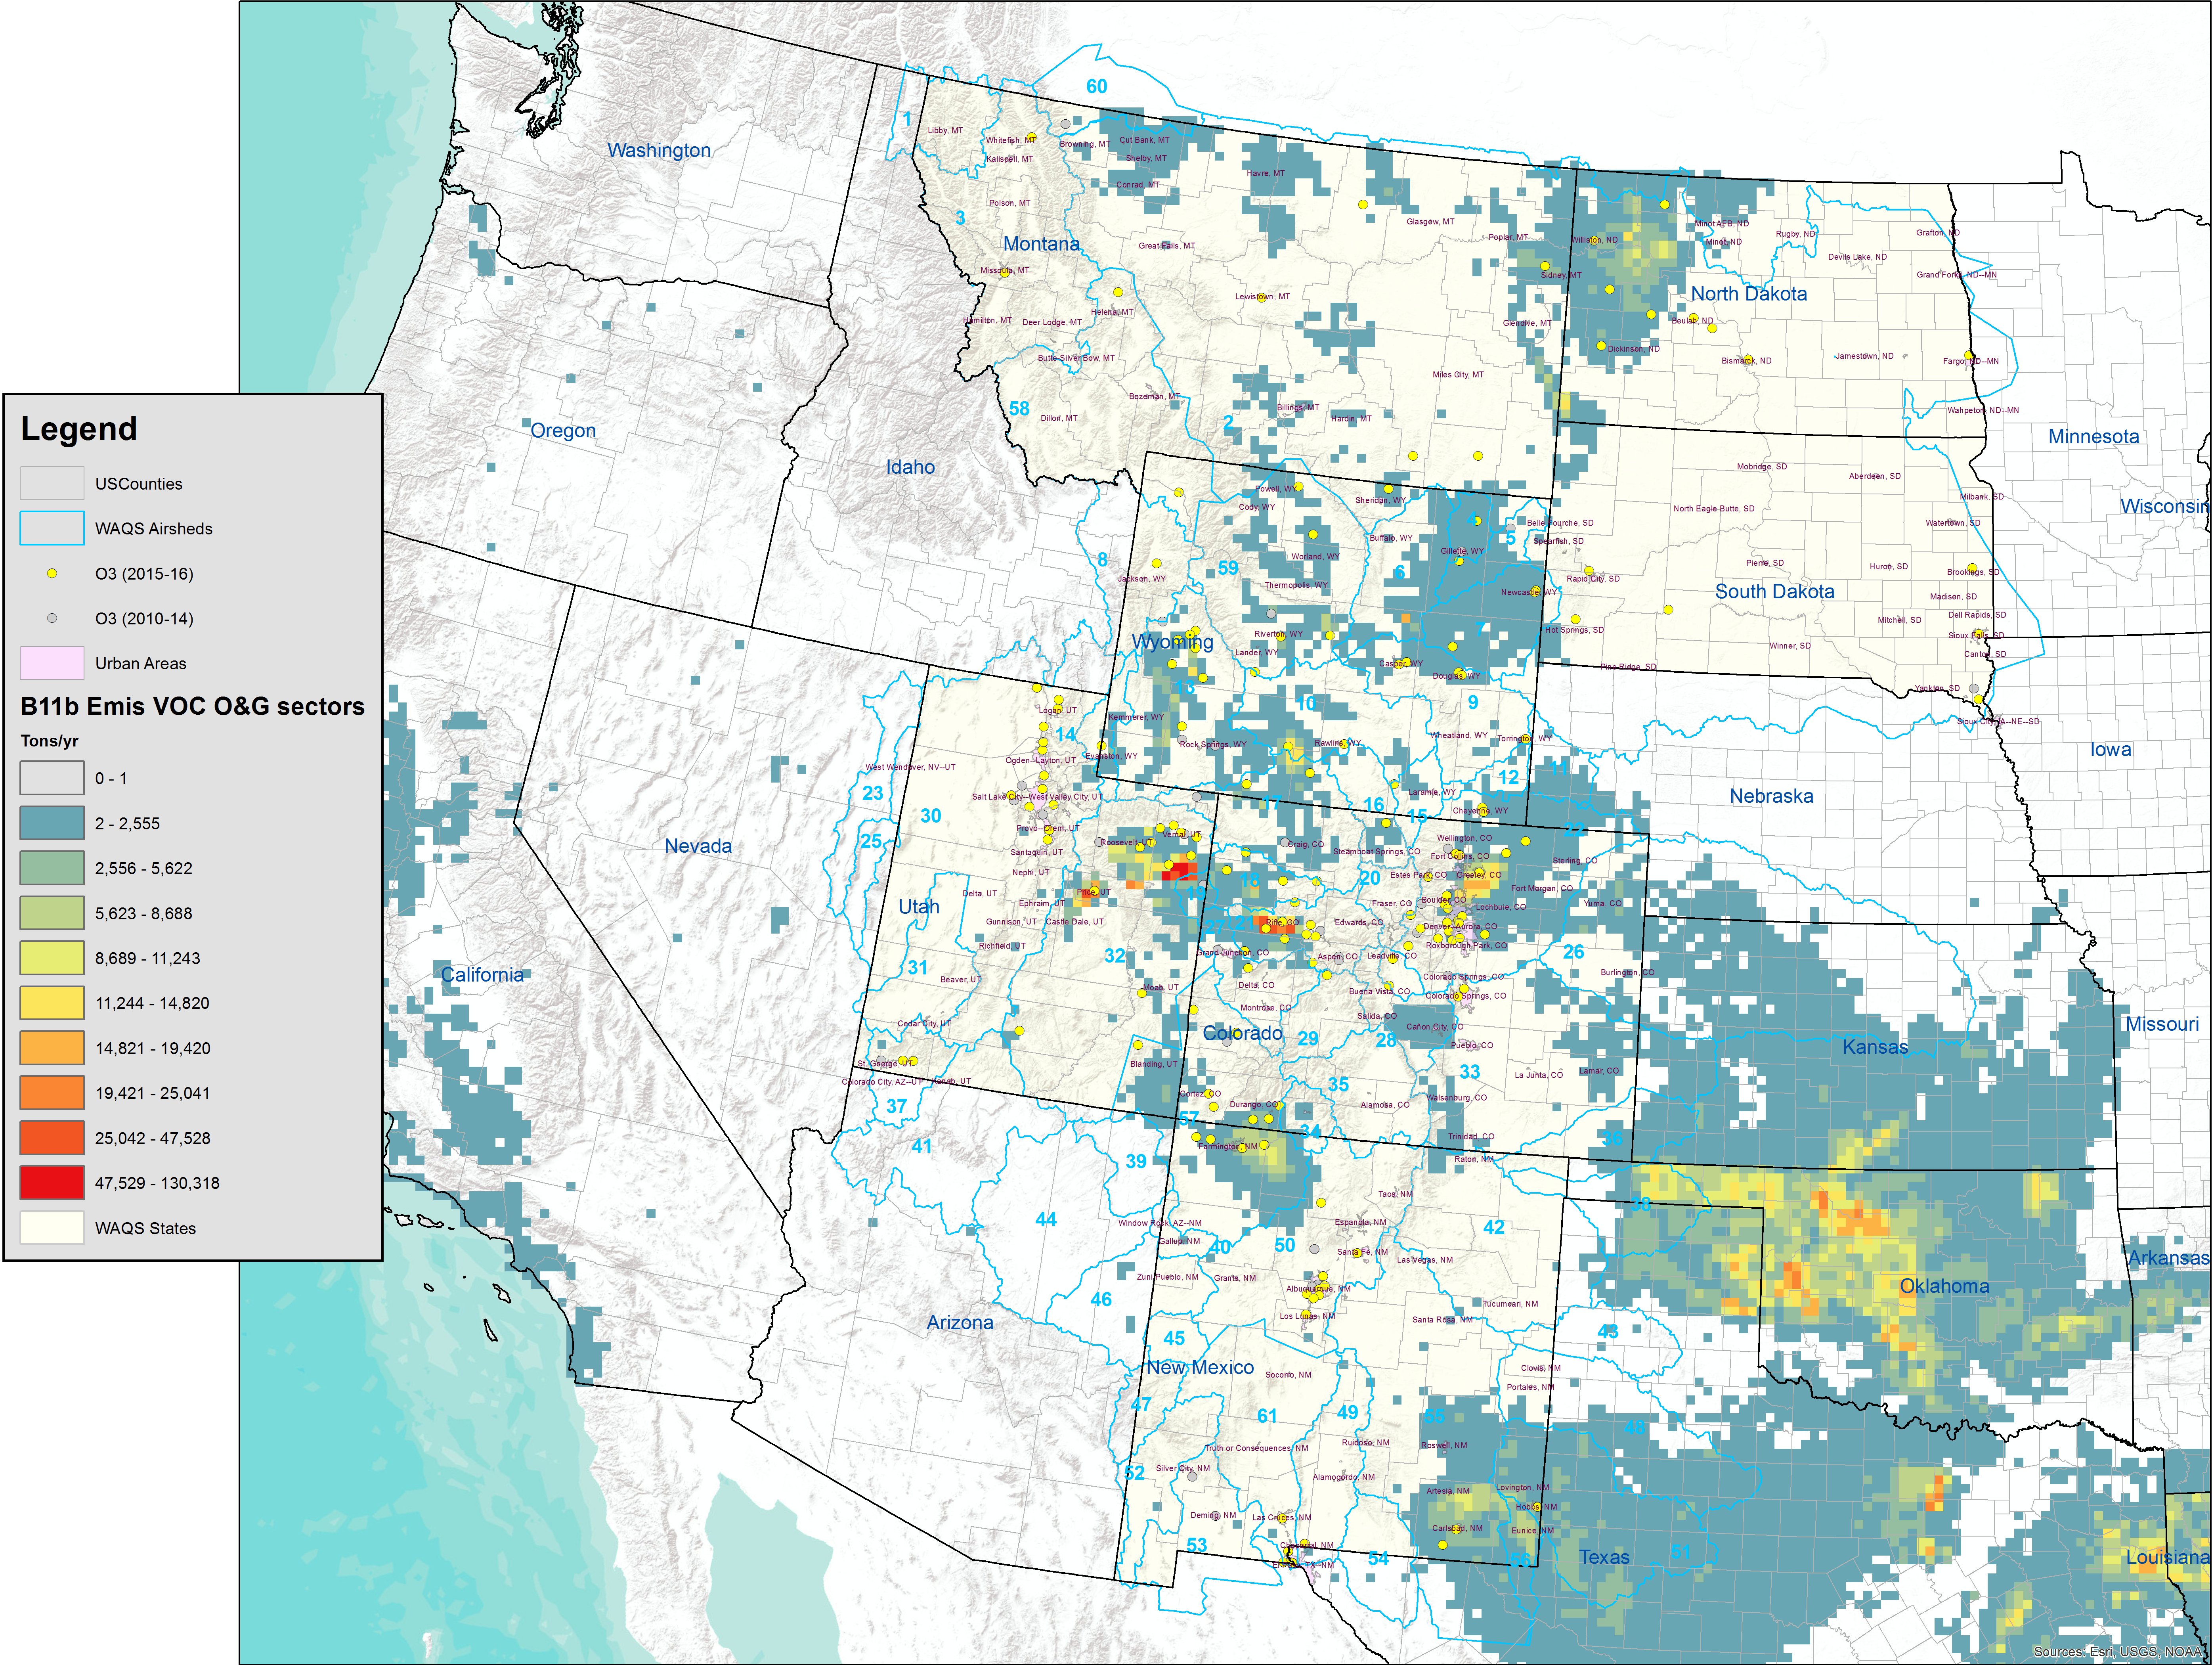
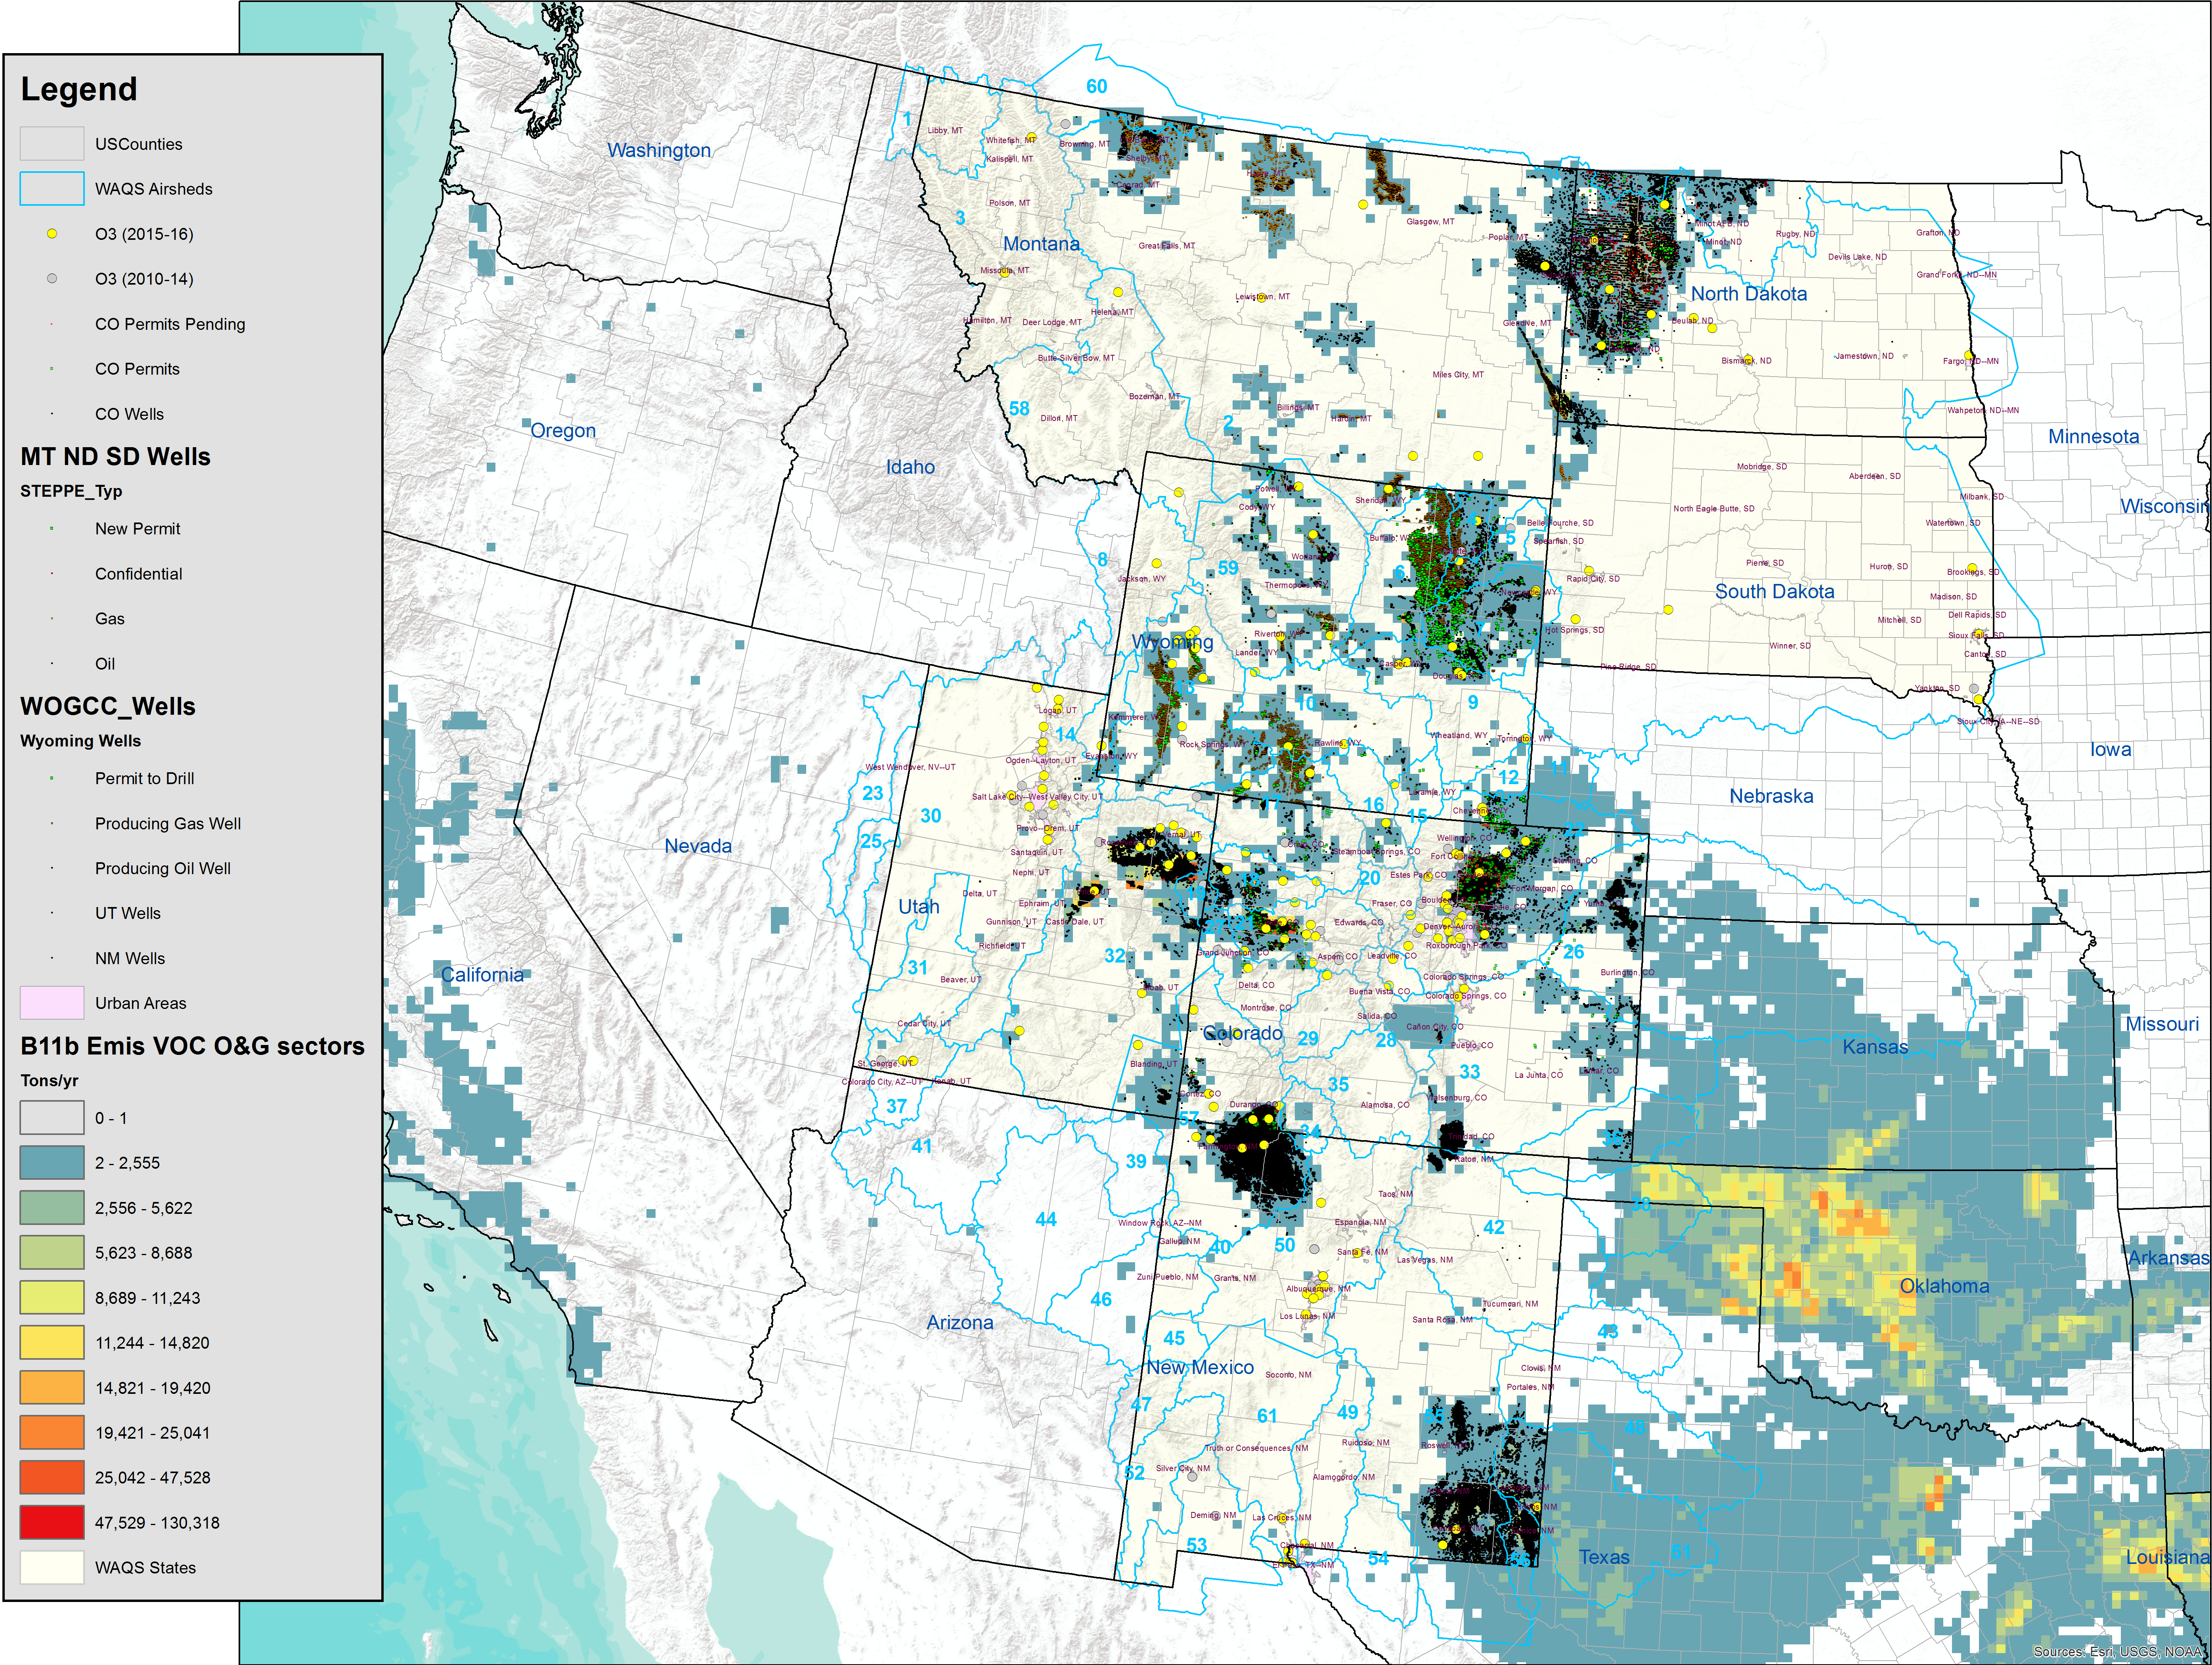
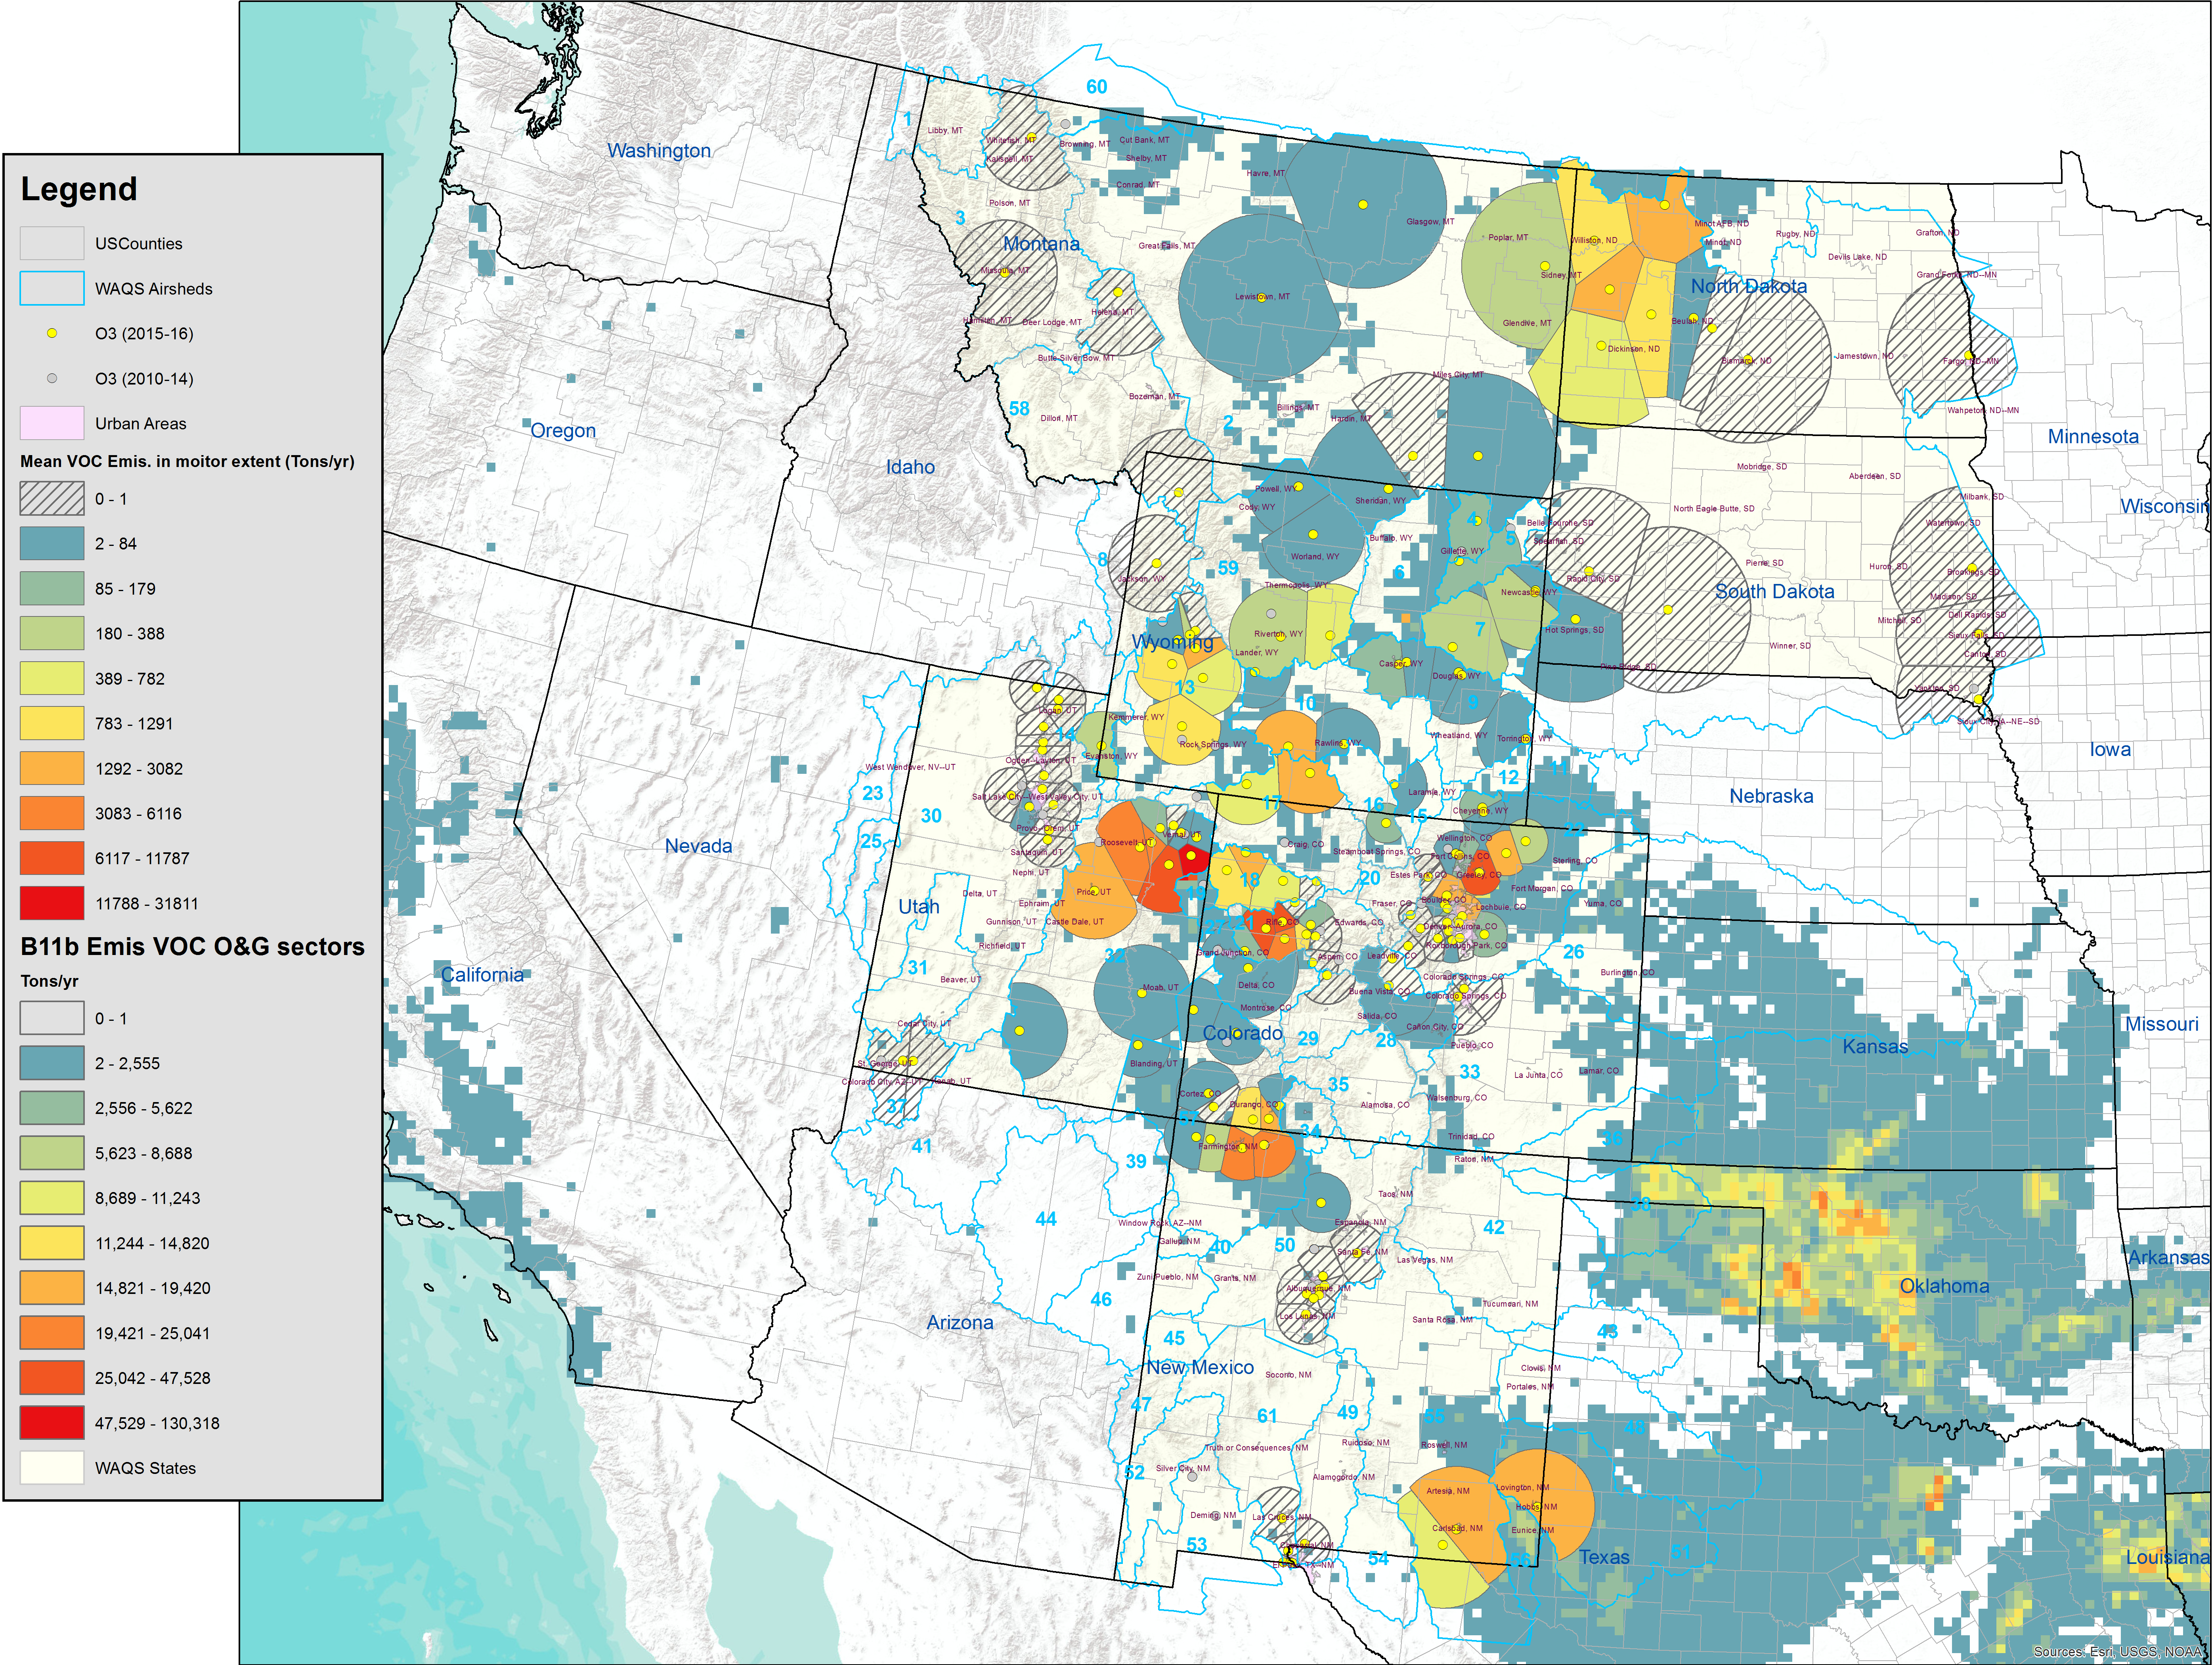
Emissions Analysis
WAQS 2011b v2 O&G Sector EmissionsVOCs Emissions Wells Monitor Rankings
NMHC Emissions Wells Monitor Rnkings
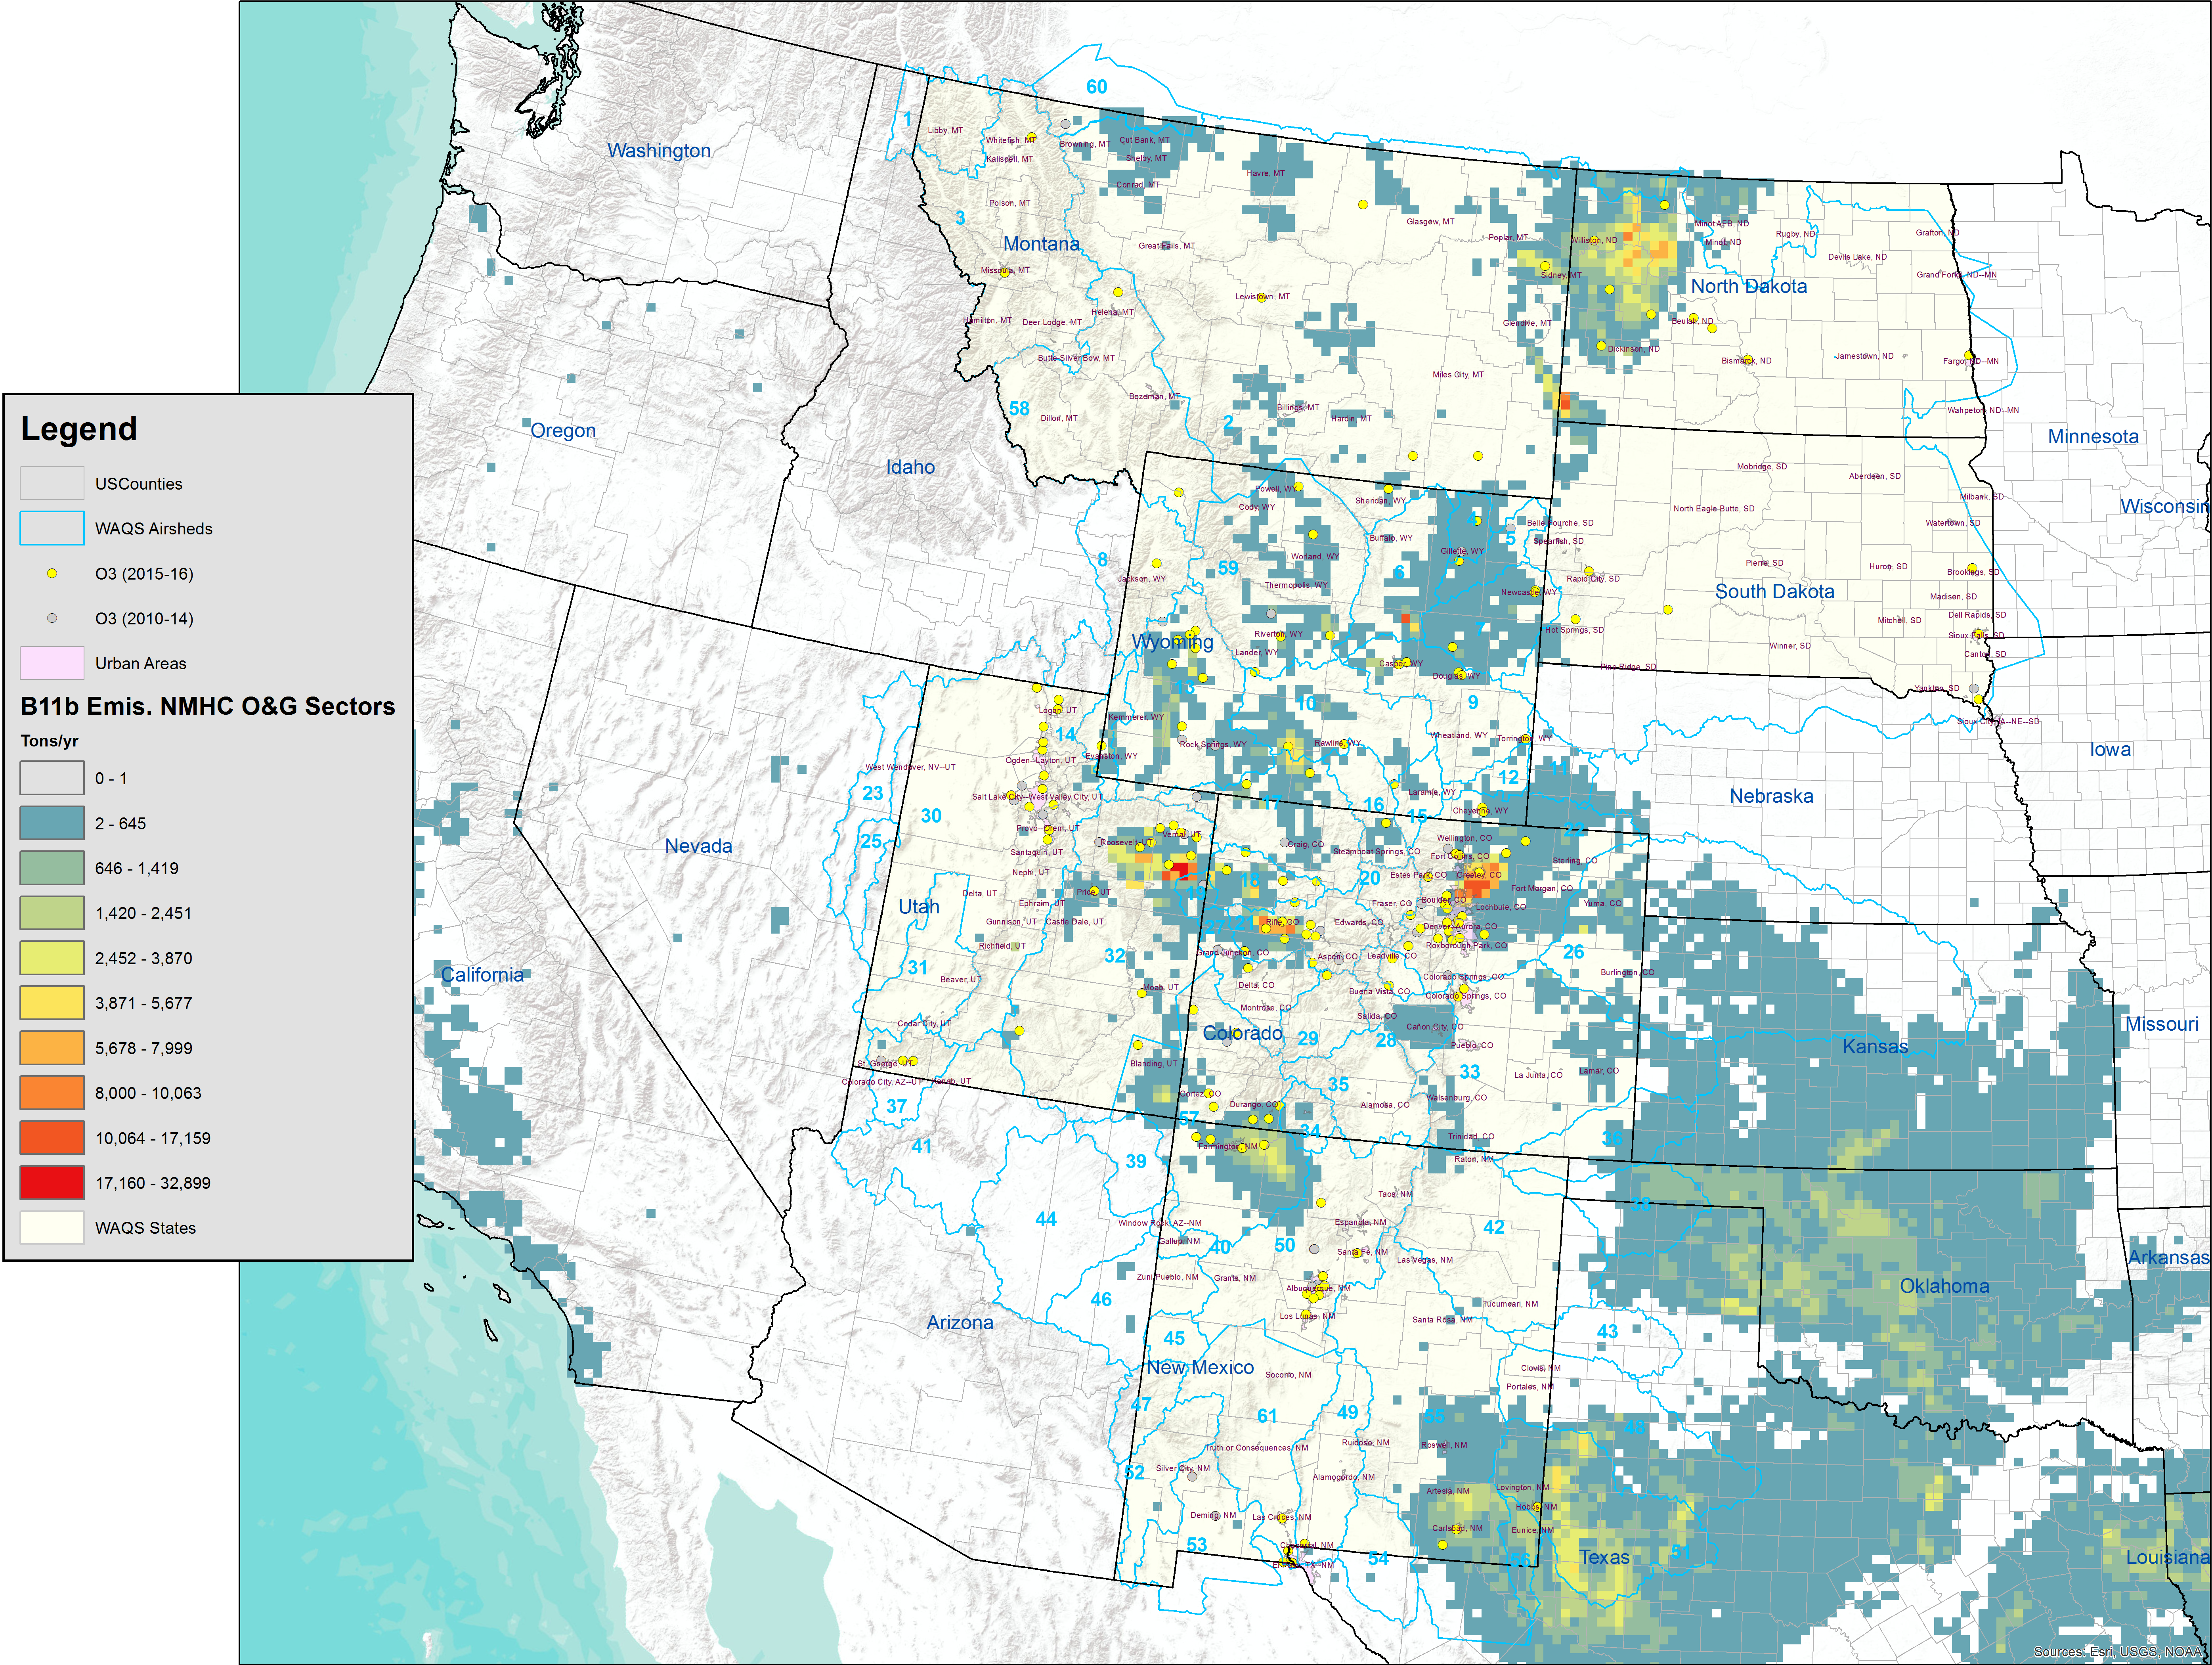
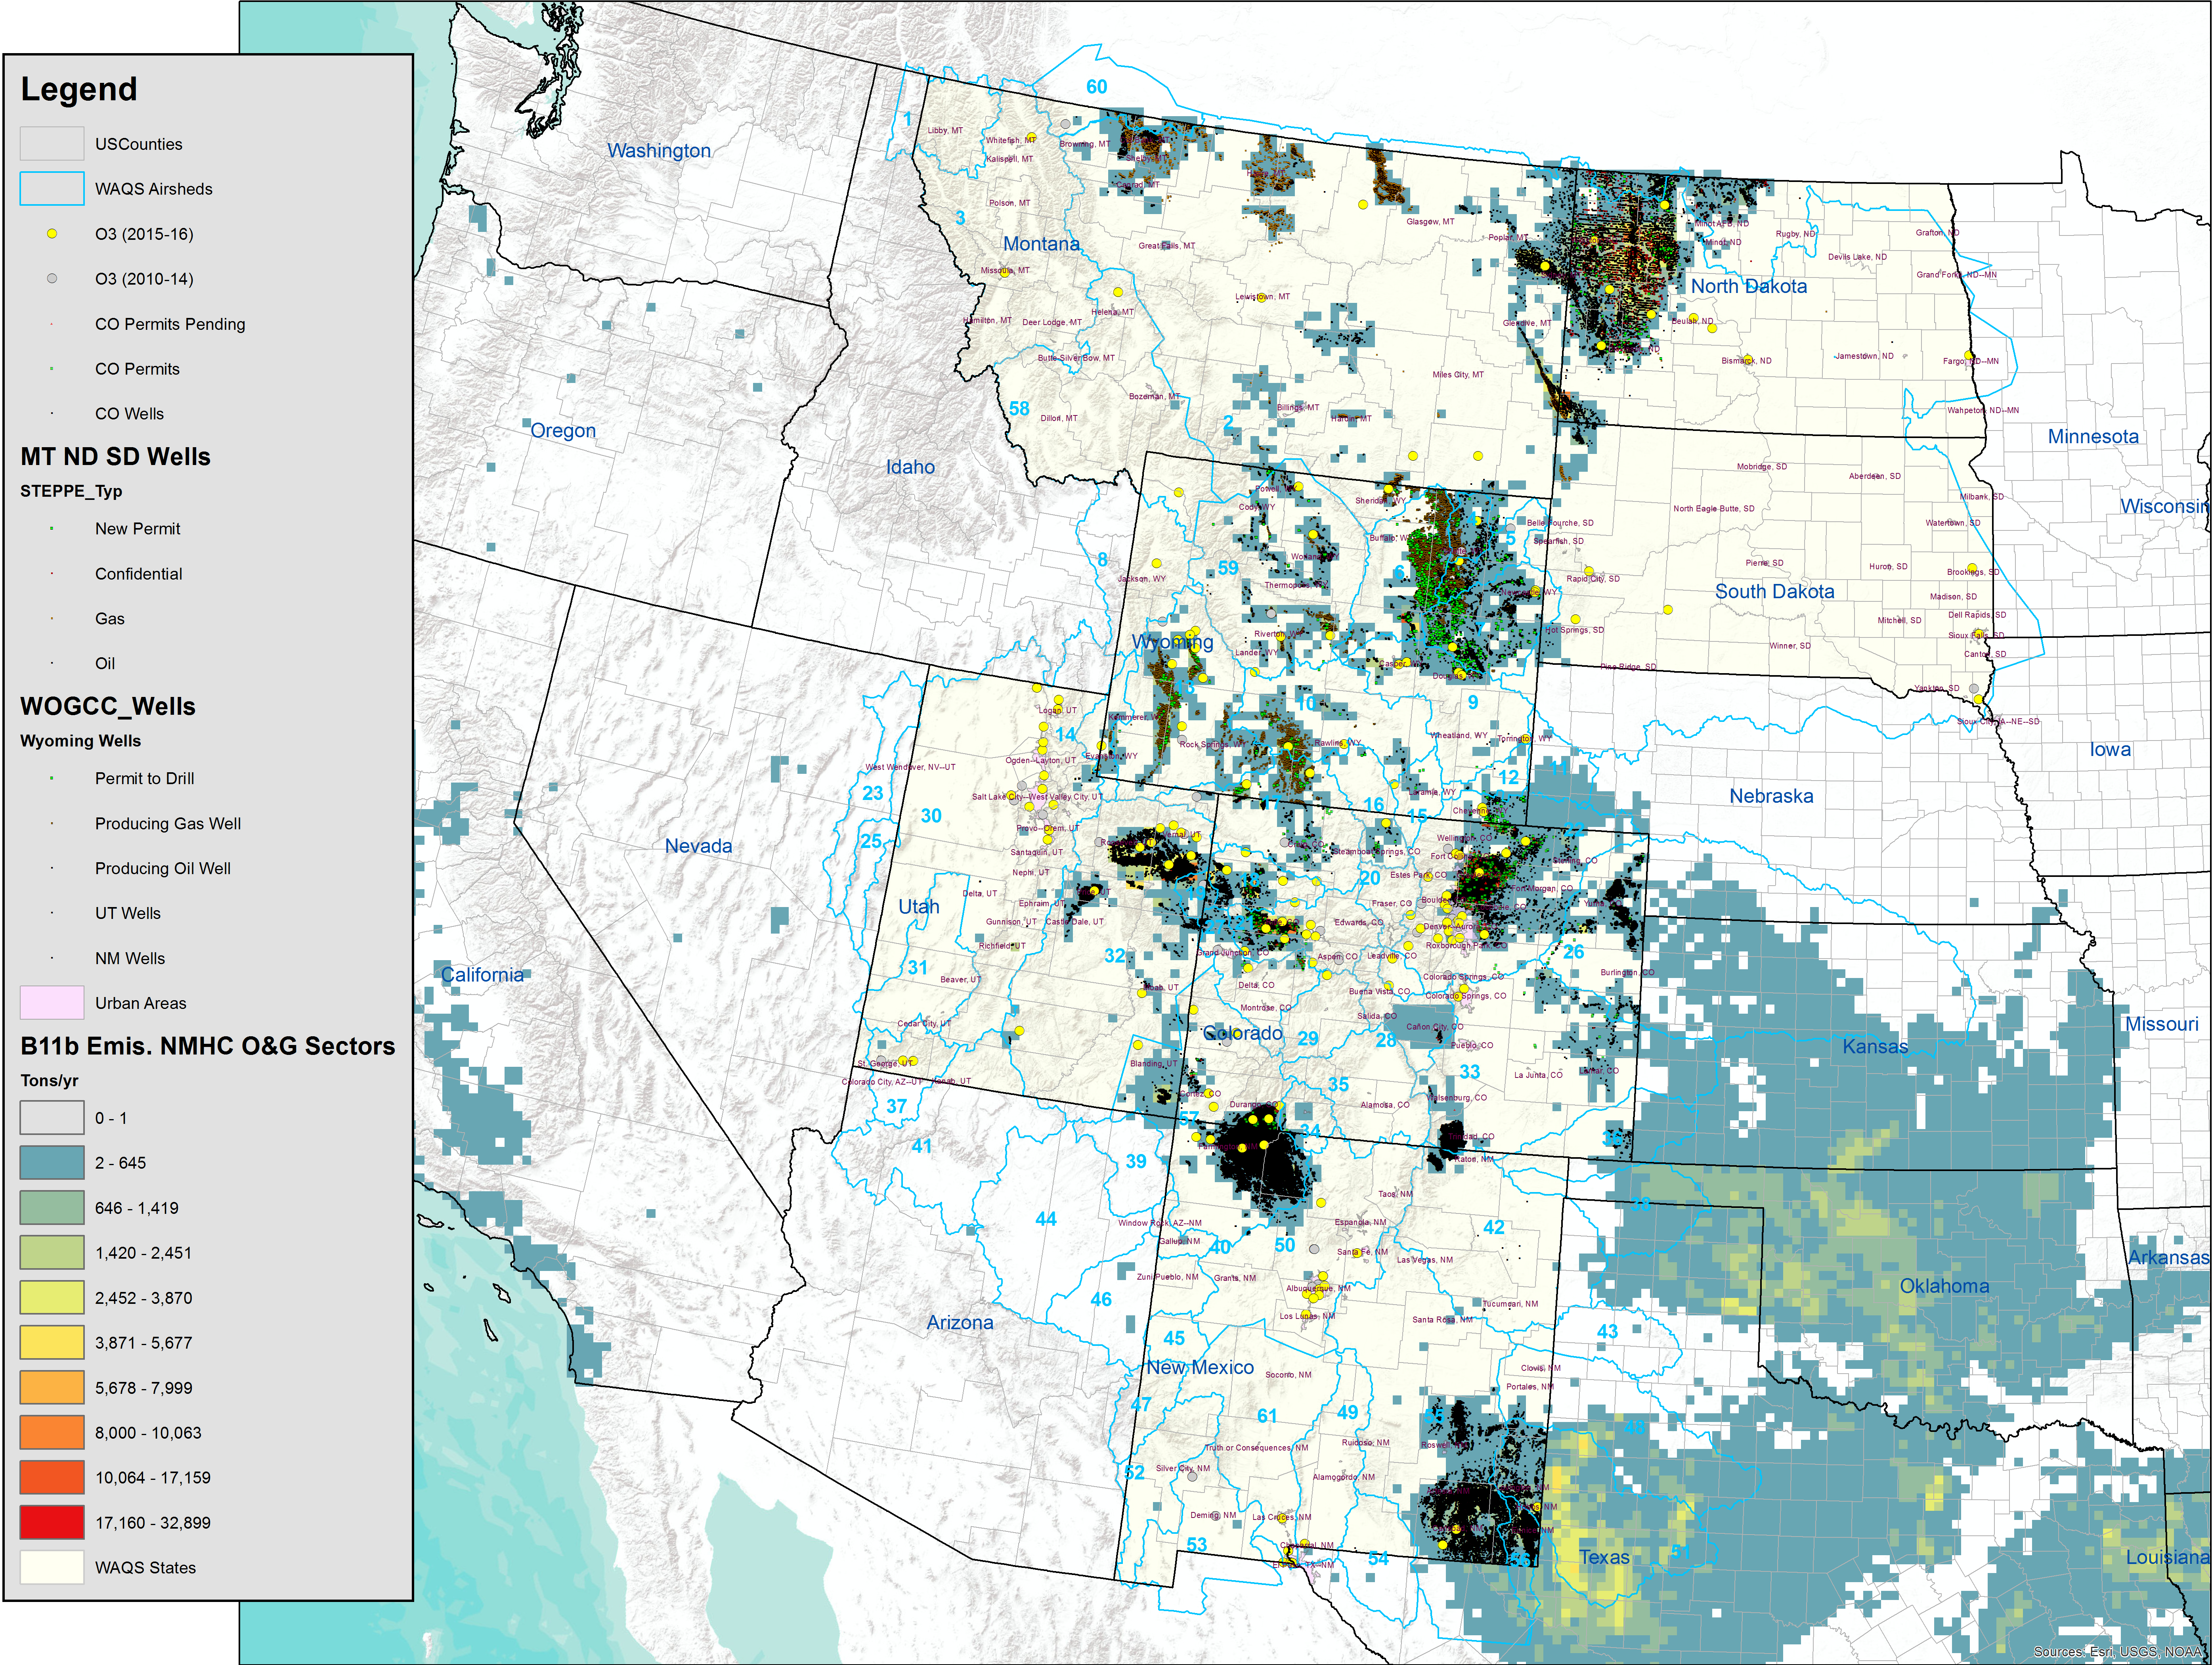
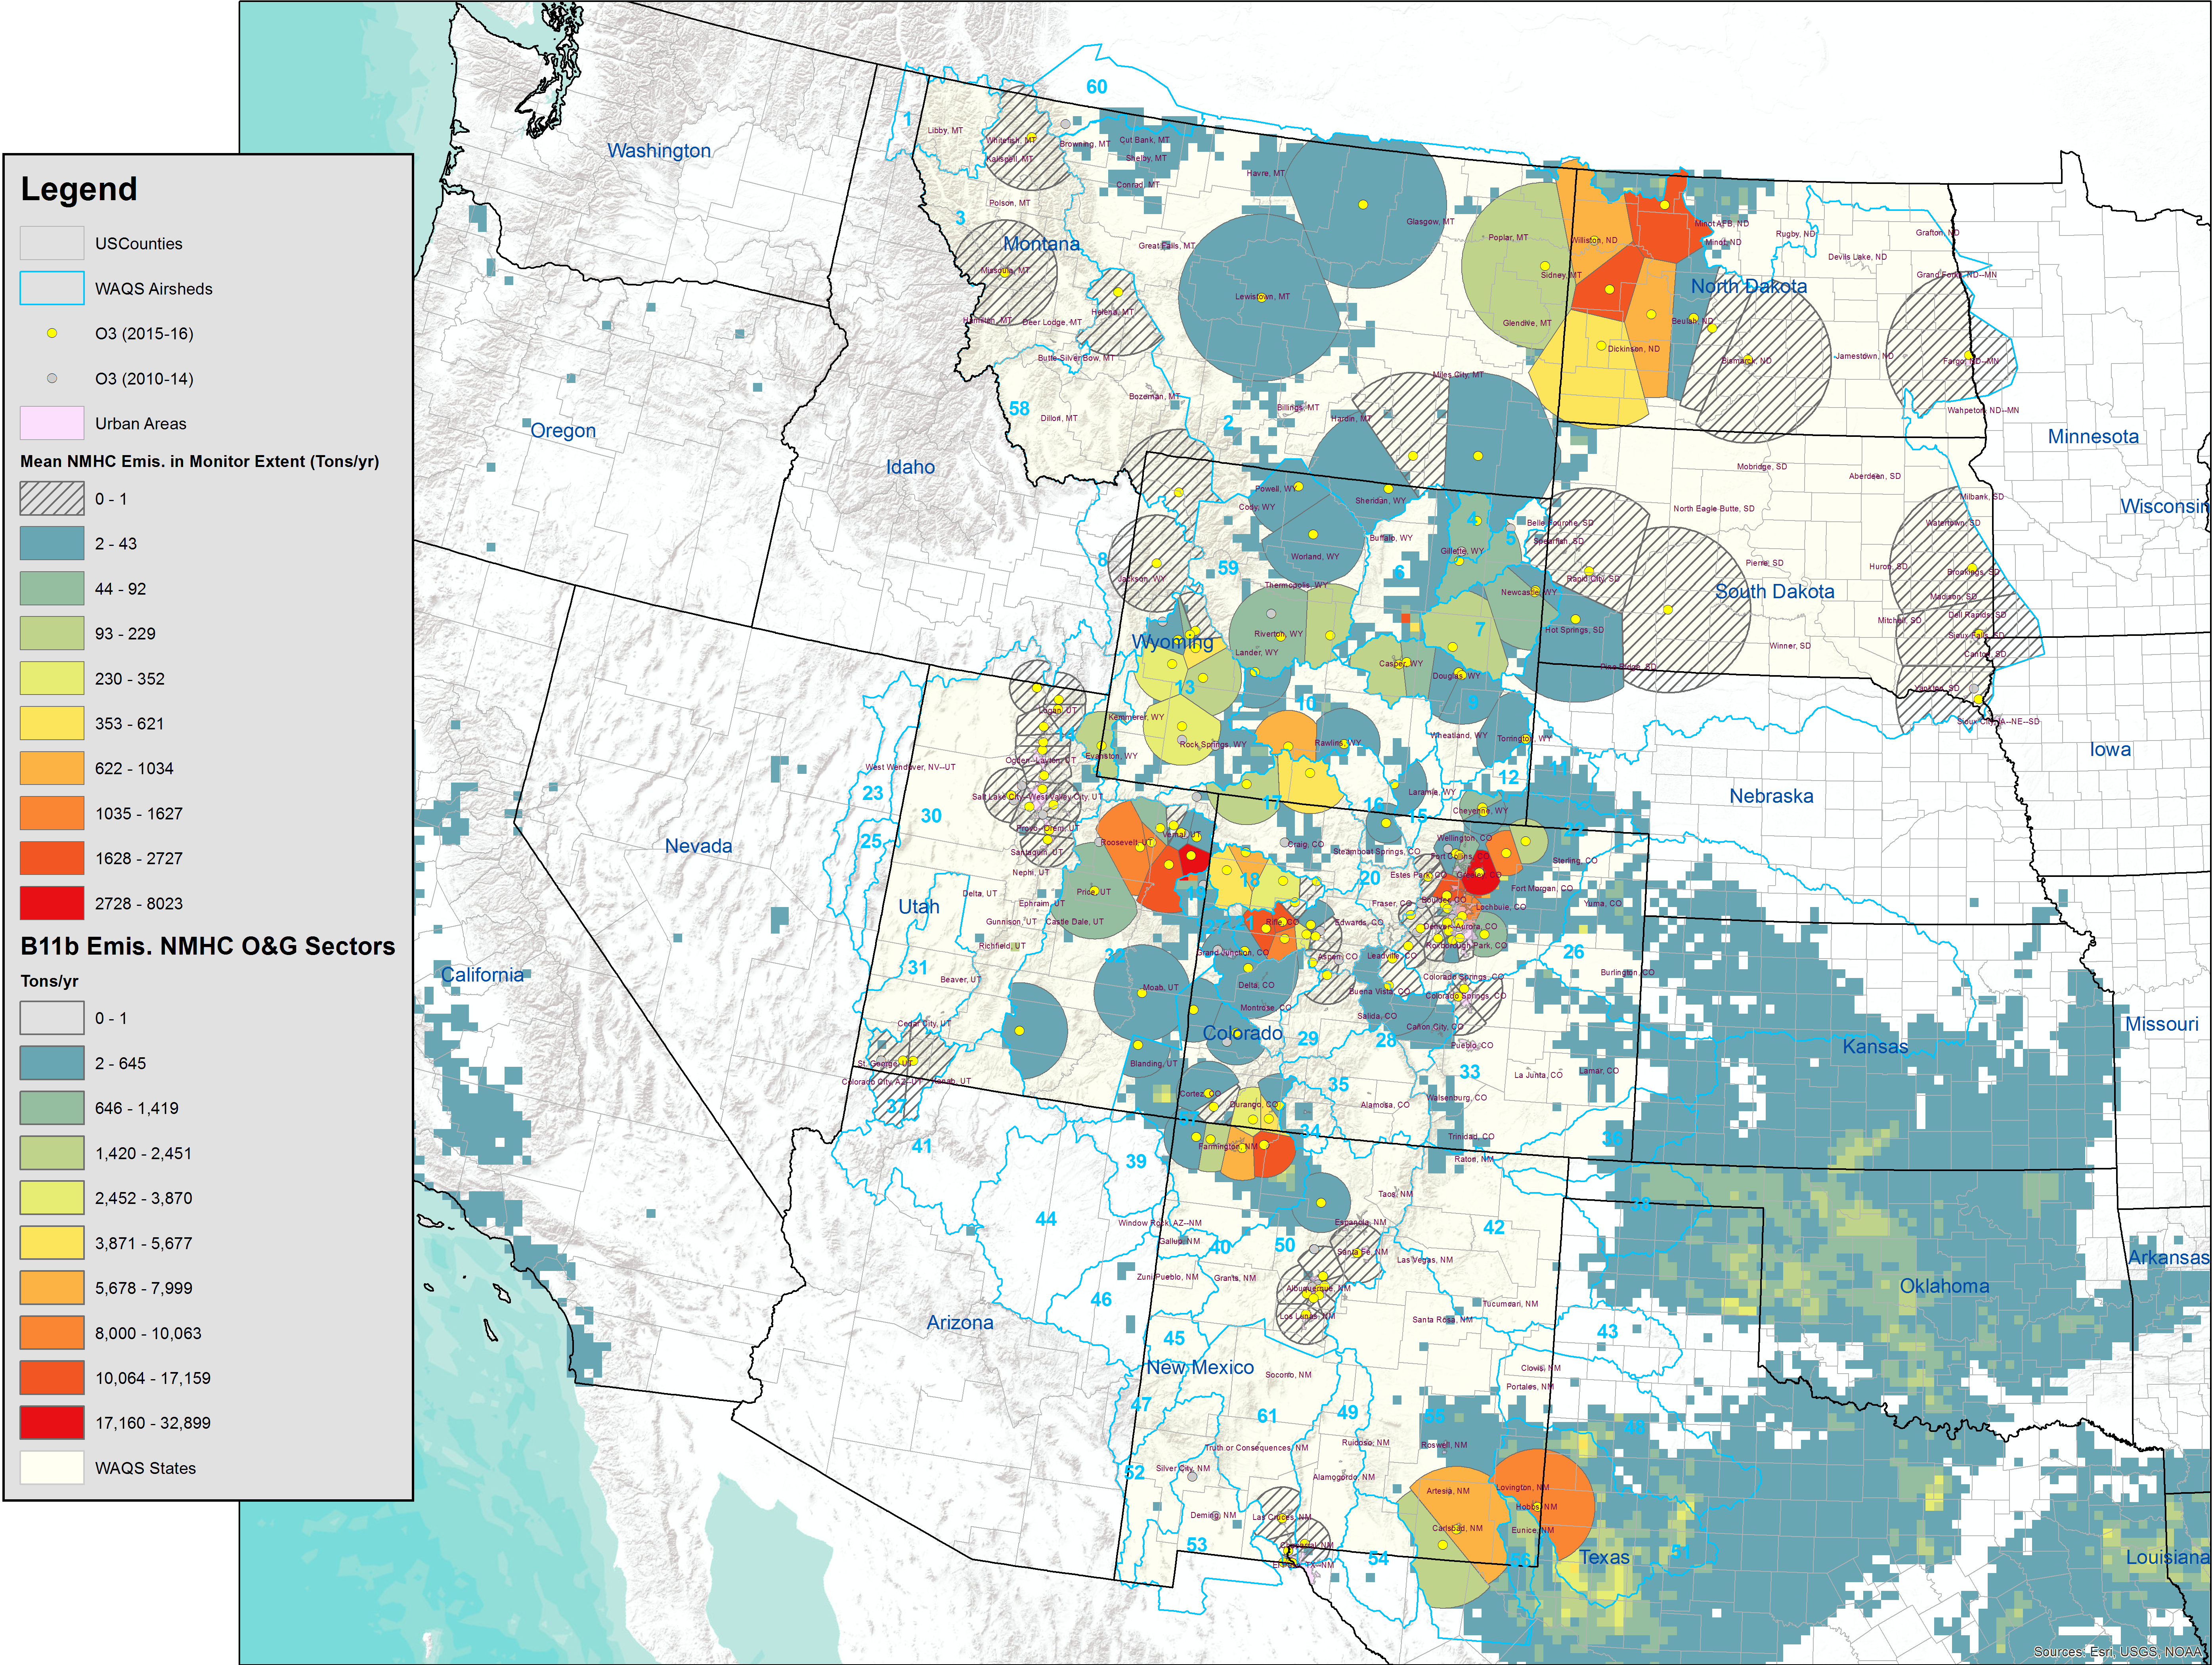
NOx Emissions Wells Monitor Rankings
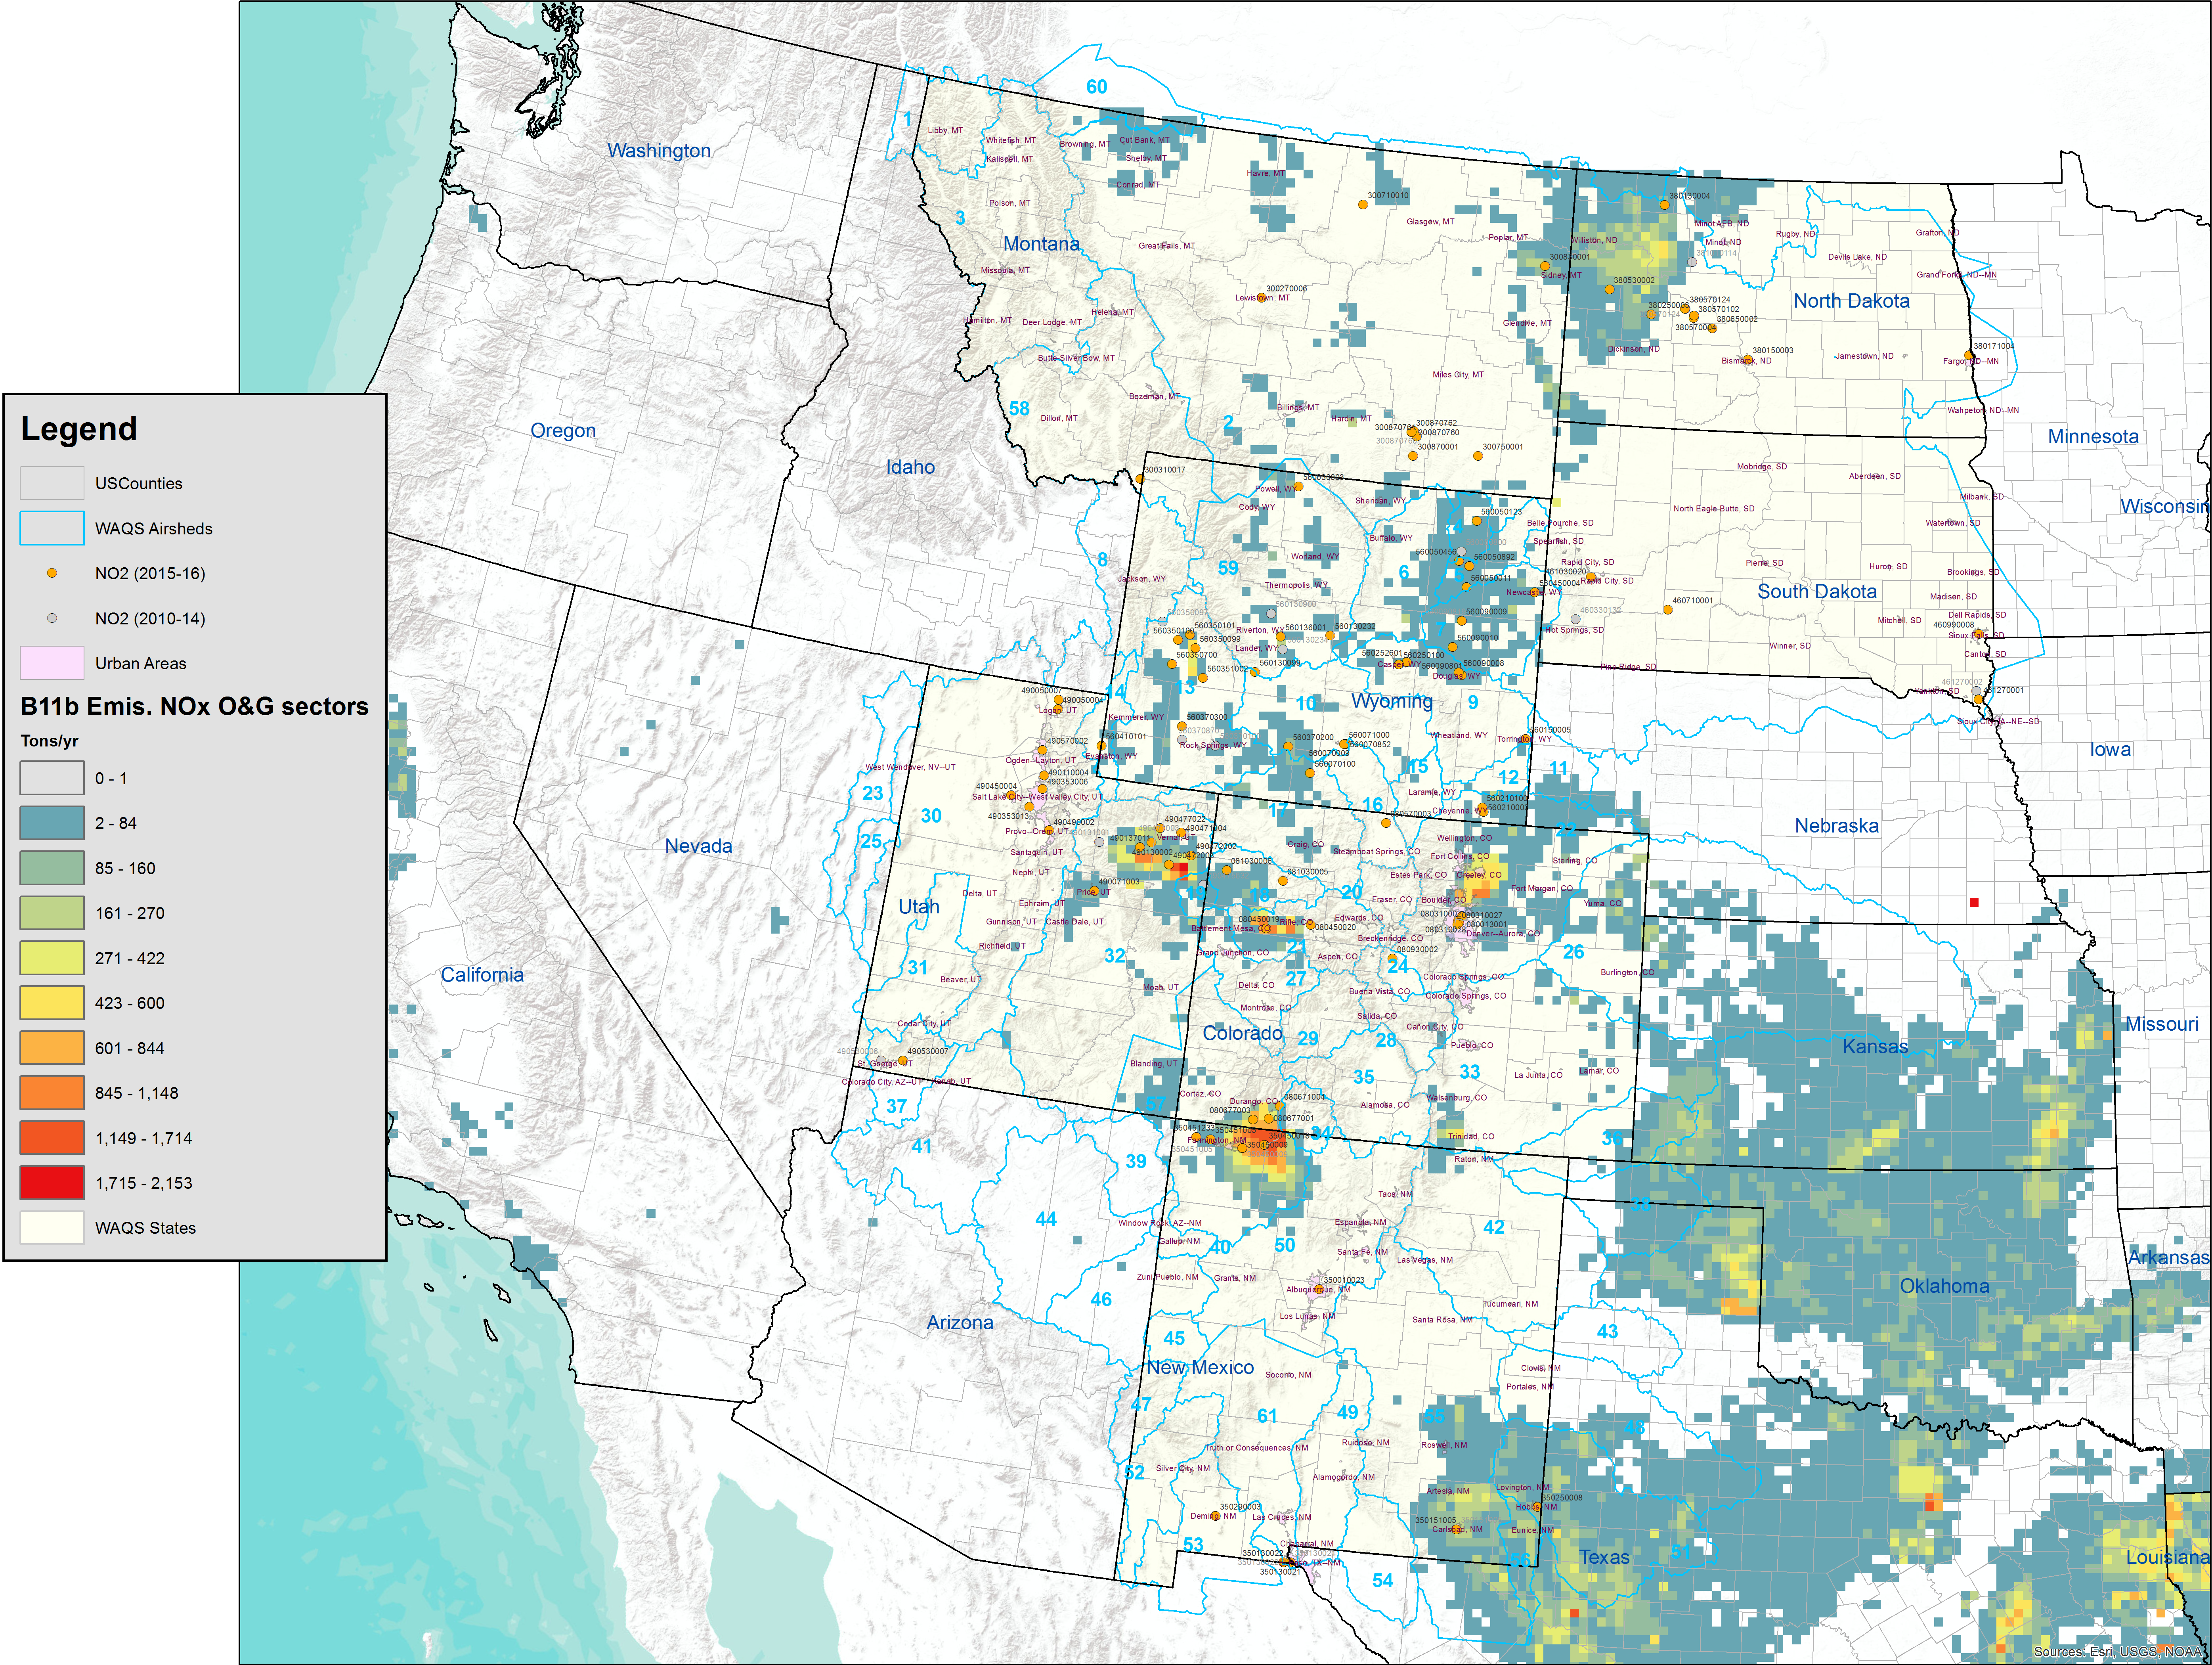
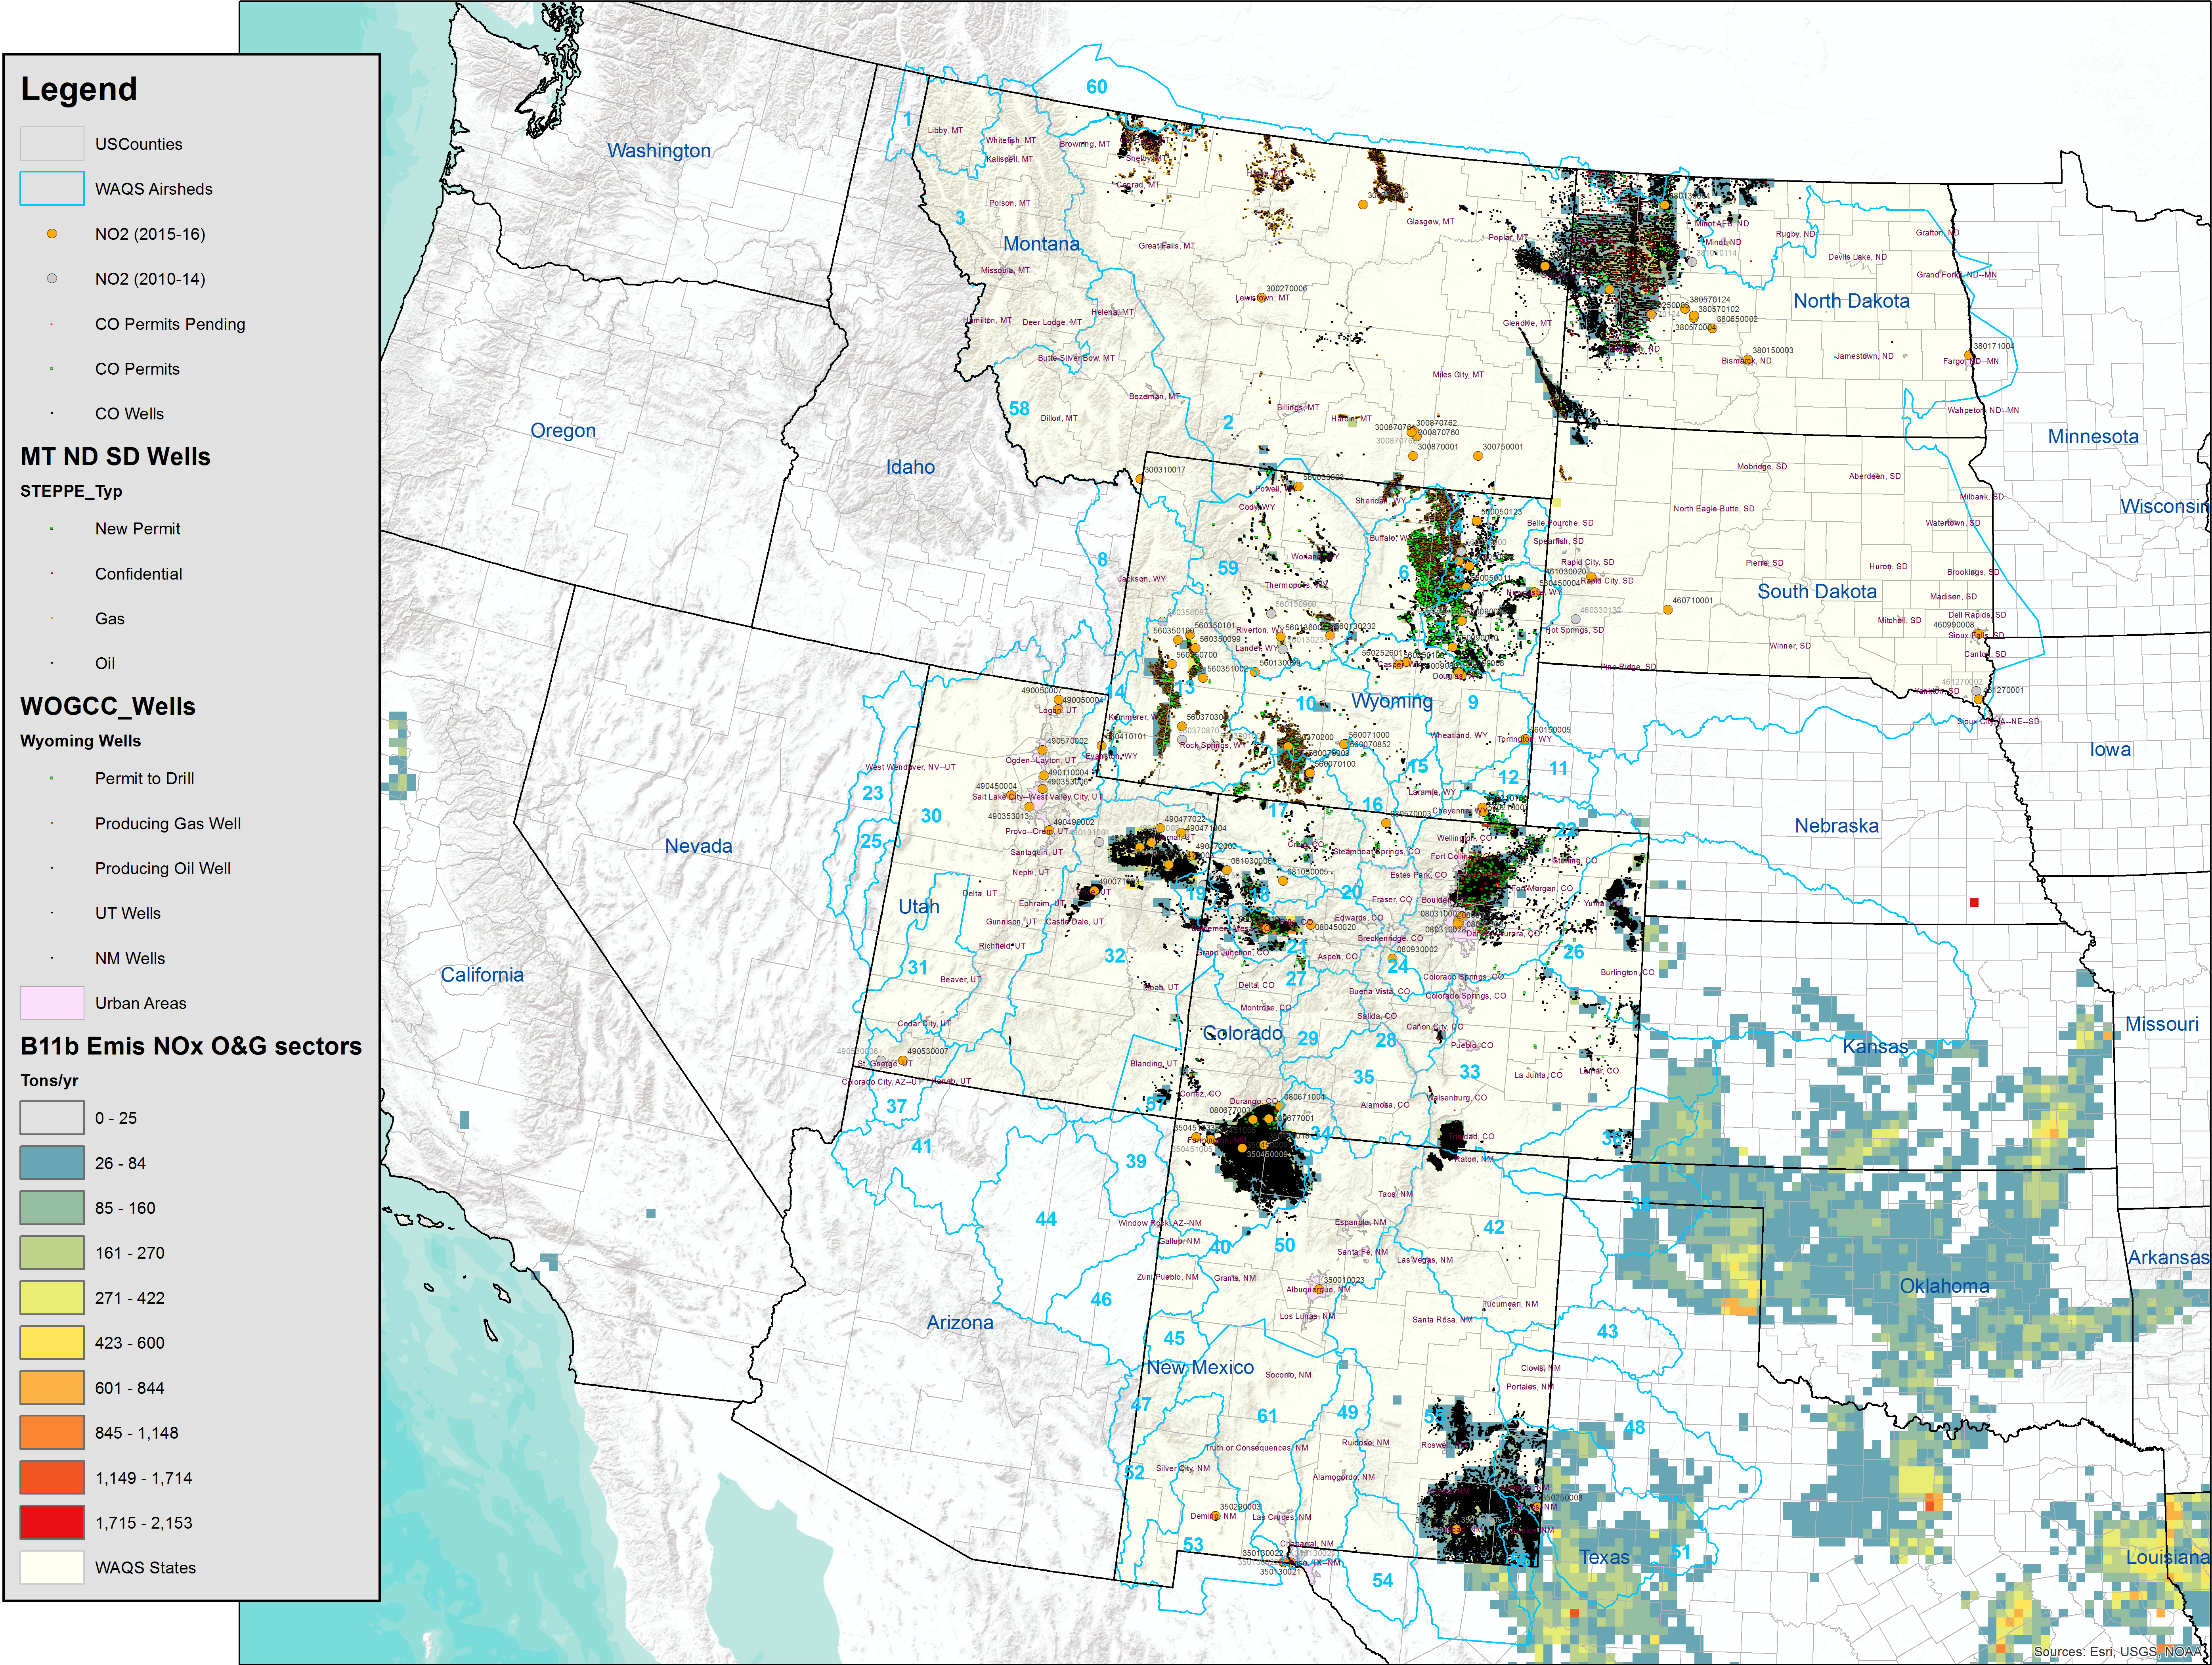
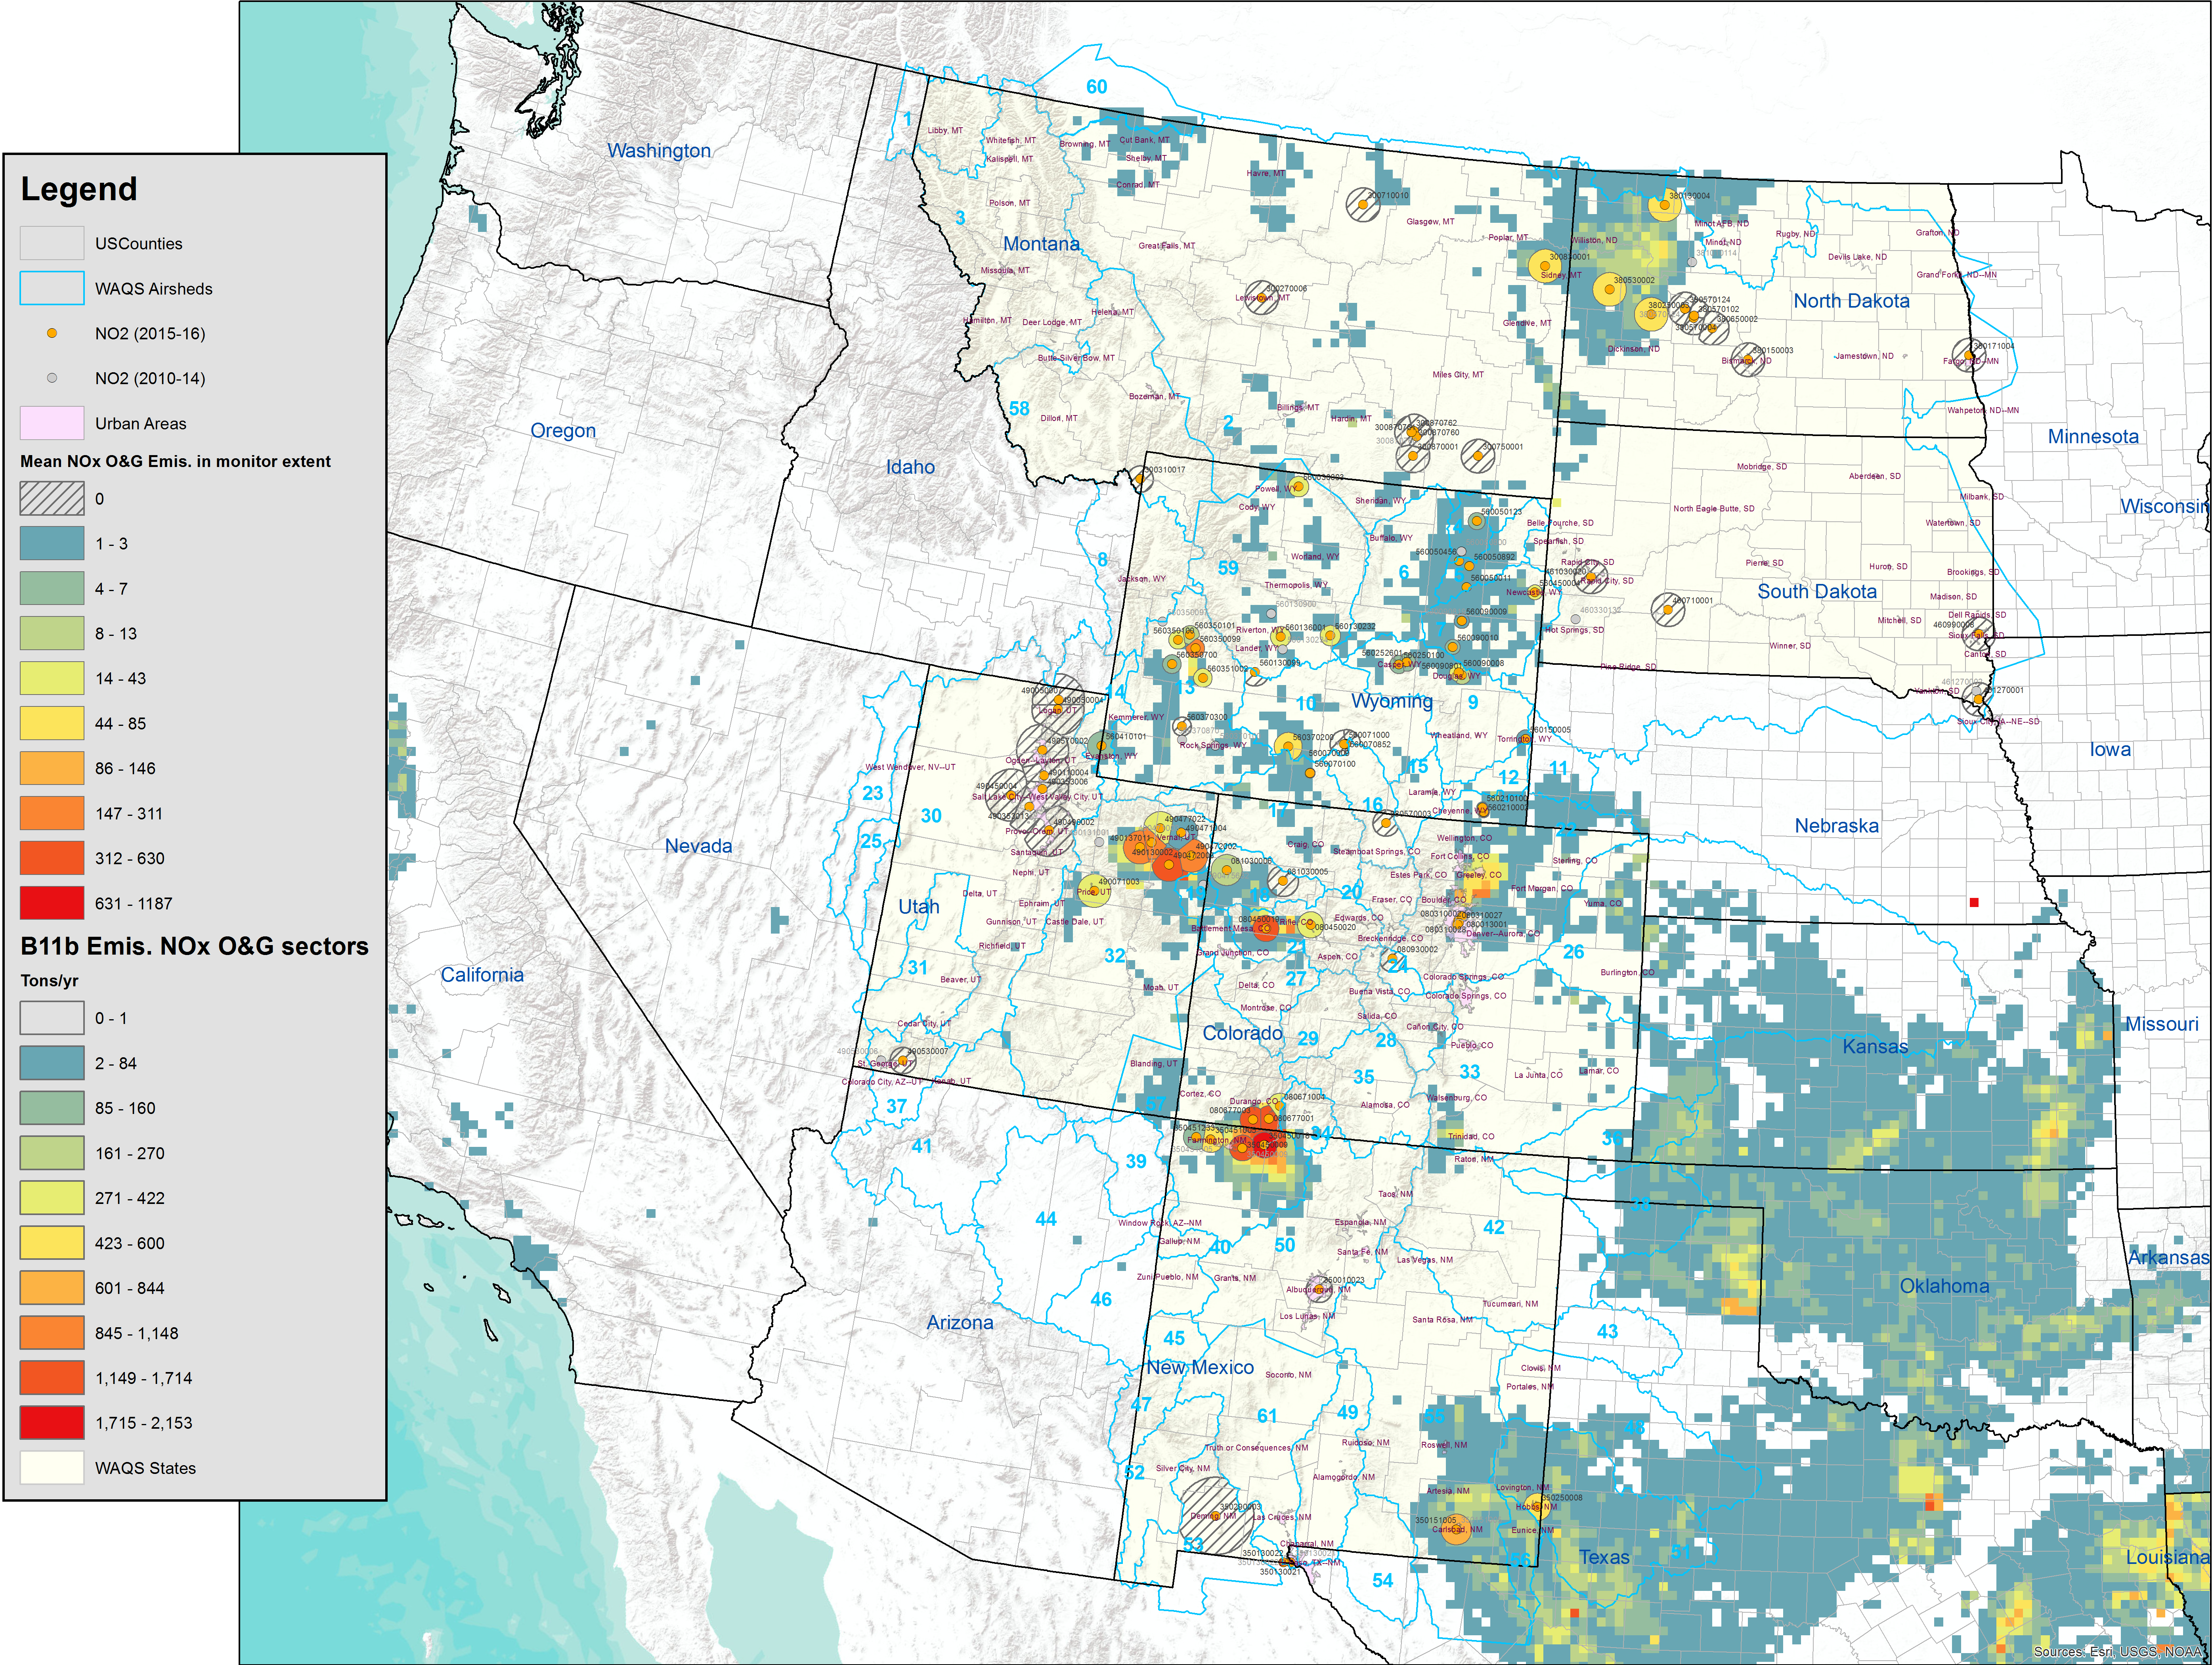
FP Emissions Wells Monitor Rankings
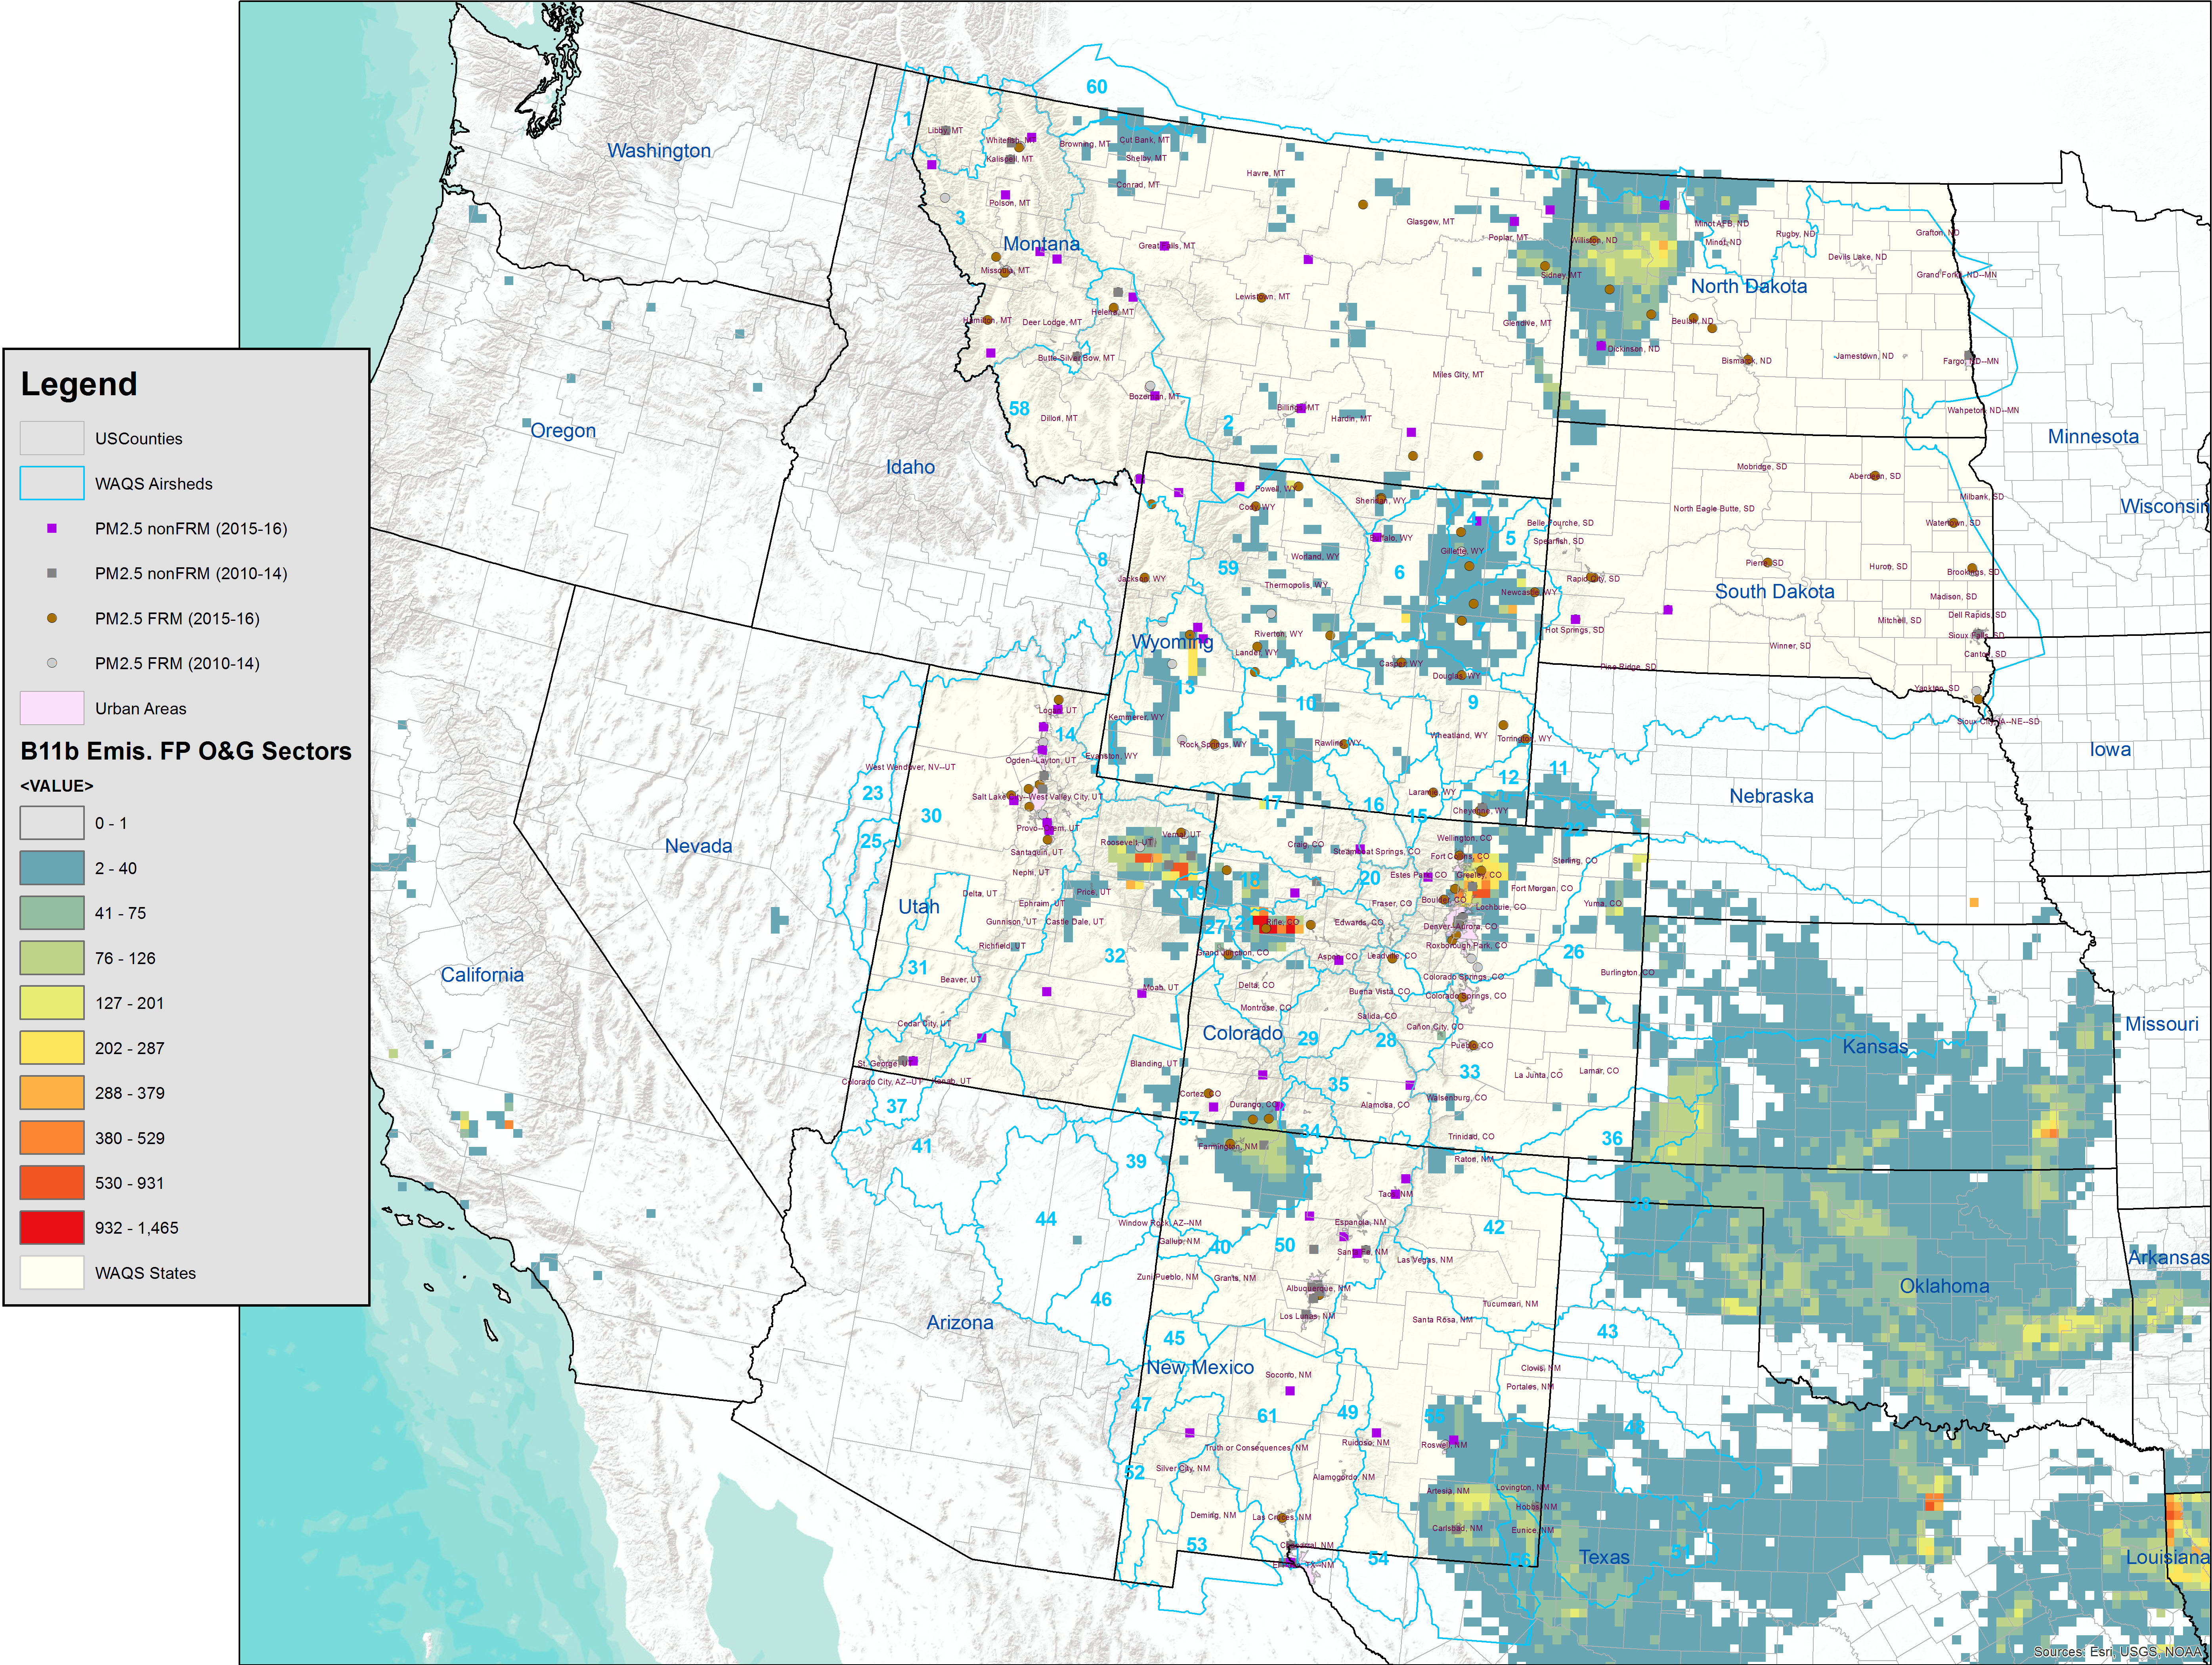
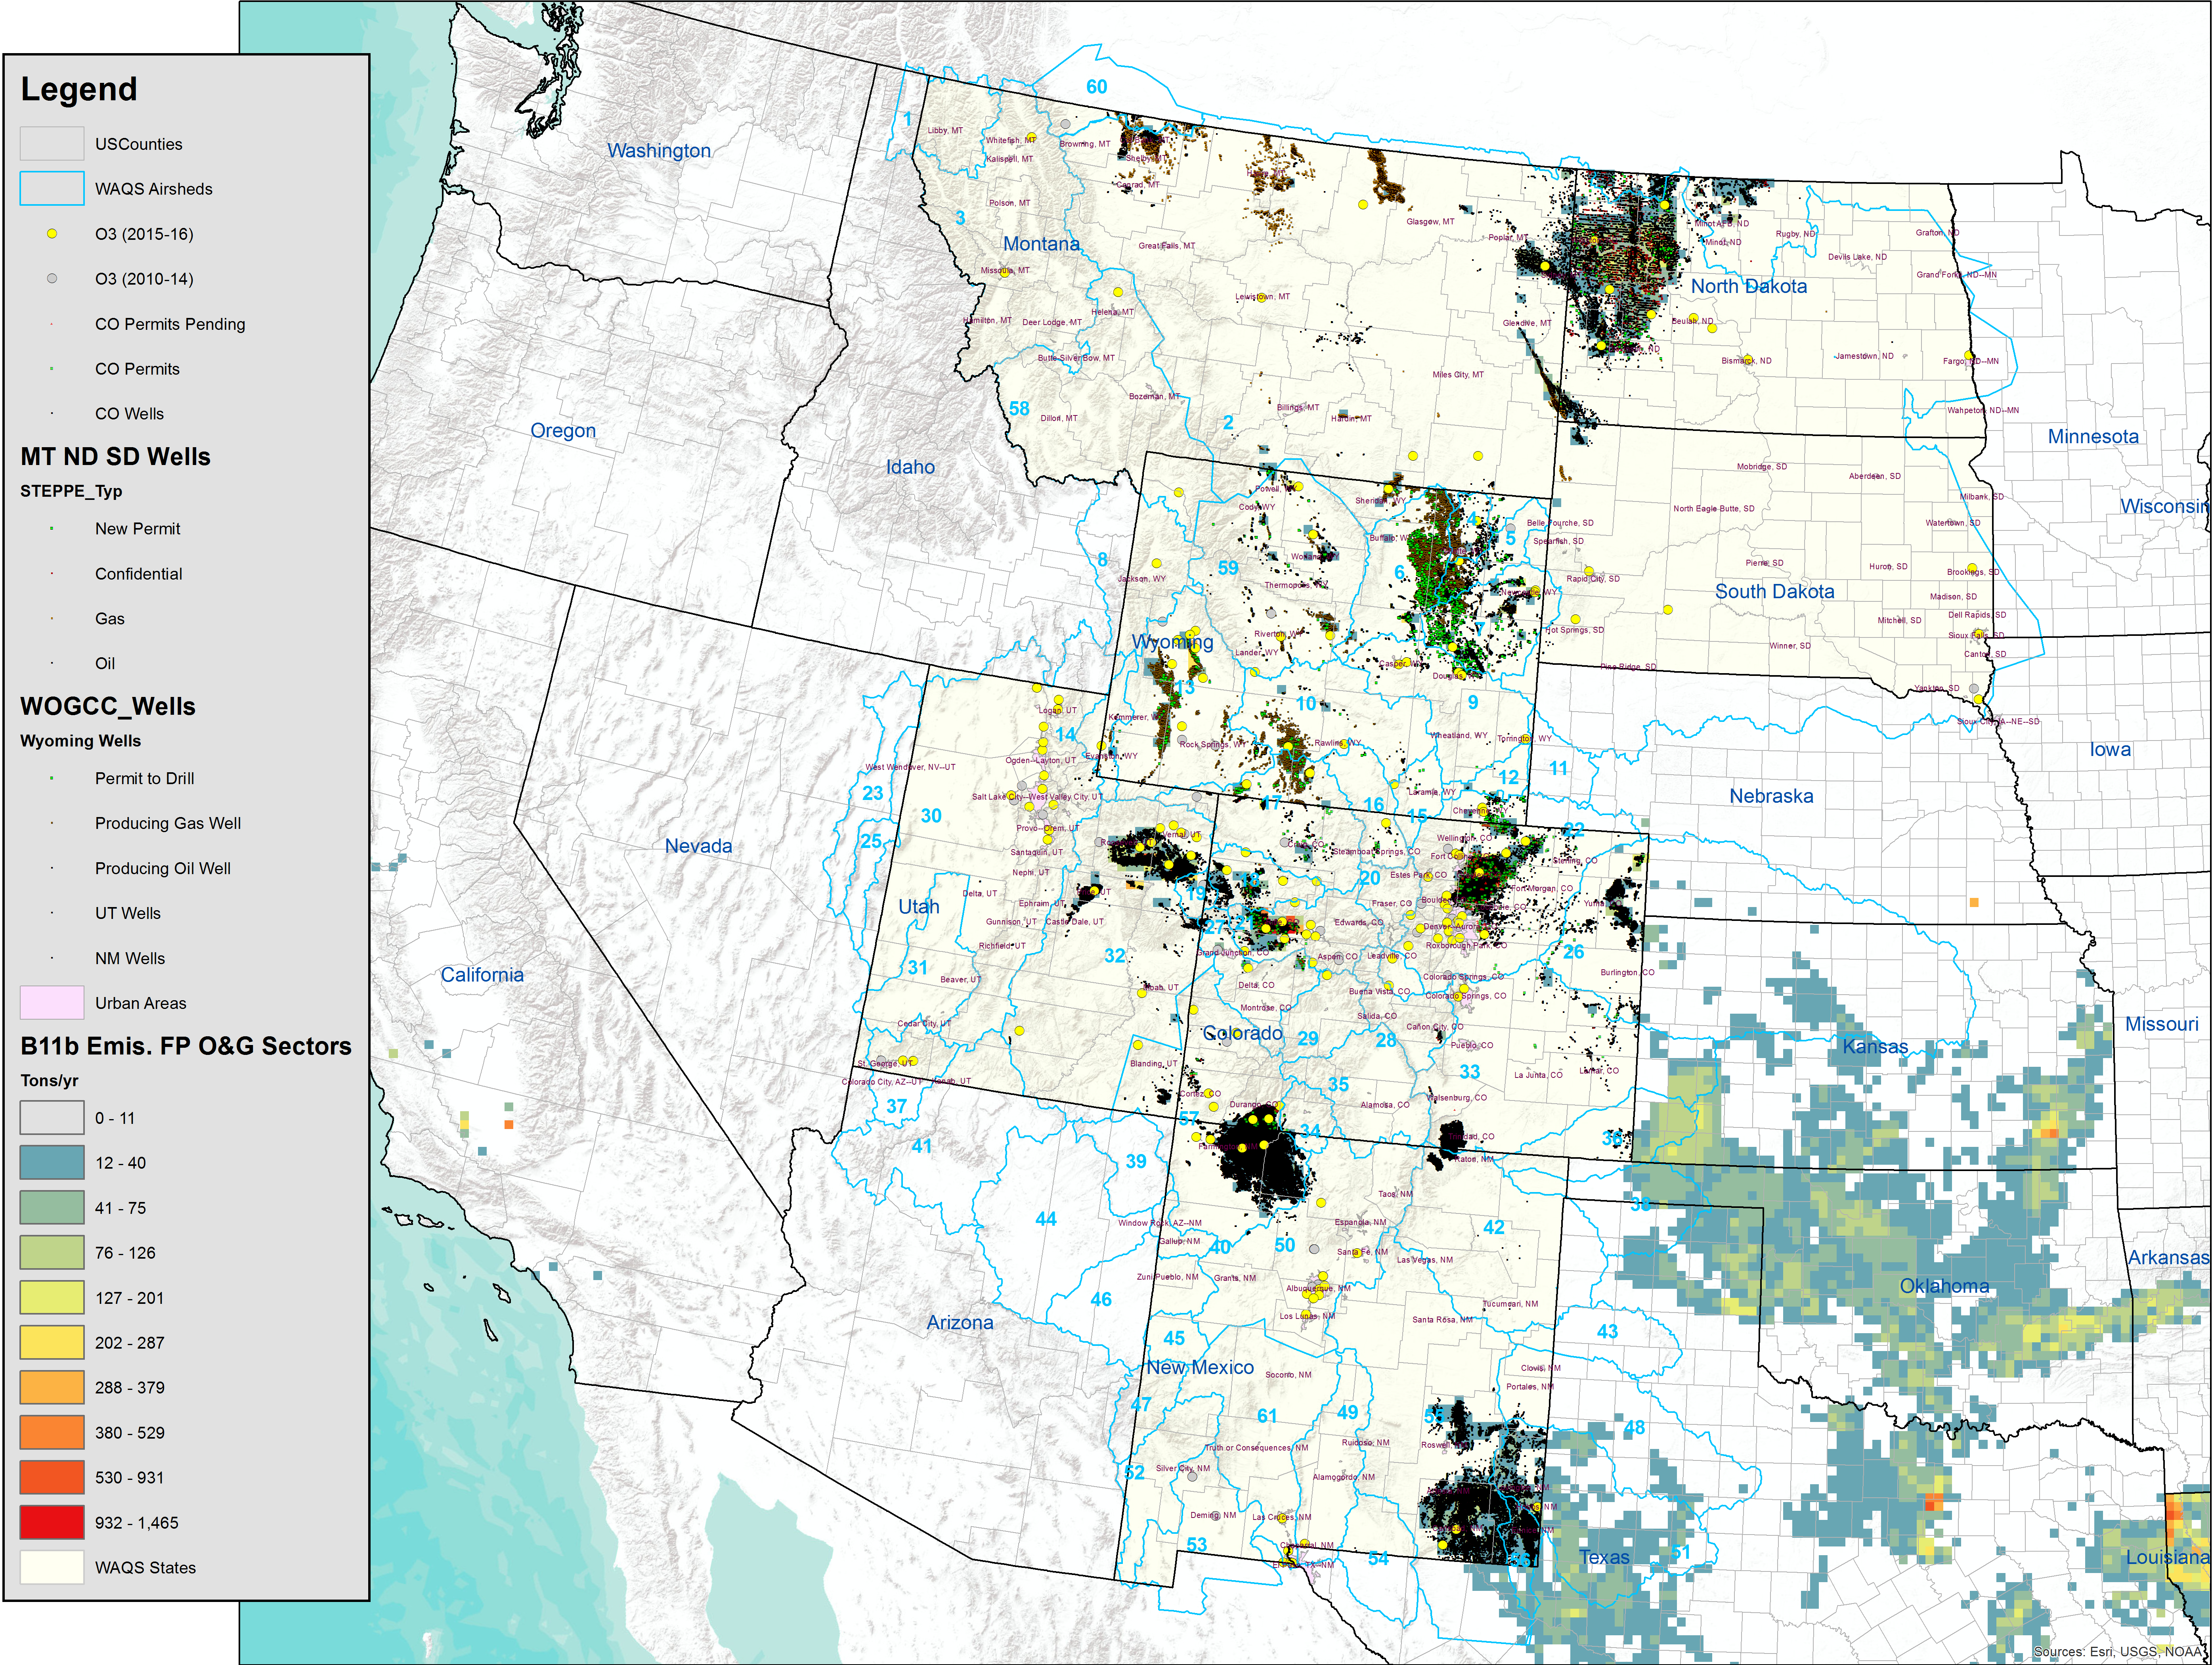
Additional Resources
State Agency 5-year Monitoring Network Assessments and/or recent State/Local Agency Network Plans
Colorado - CDPHE 2015 MNA 2017 Network PlanWyoming - WDEQ 2015 MNA 2016 Network Plan
Utah - UDEQ 2015 MNA 2016 Network Plan
New Mexico - NMED 2015 MNA 2017 Network Review Albuquerque 2017 Network Plan
SDDEP 2015 MNA 2017 Network Plan
NDDEQ 2017 Network Plan
MTDEQ 2016 Network Plan
O&G Well Locations
Colorado - COGCC GIS downloads see Well Surface Location DataLayers: Wells.shp, Permist.shp, Permits_pending.shp; Filters: Facil_stat = Producing; Downloaded 2017-4-11
Montana & Dakotas - USGS Energy Developmet - GIS Data
Layer: PetroleumWells_041113; Filters: Producing (MD, ND, SD), not DRY (ND); Published: 2013-11-19; Downloaded 2016-10-24
New Mexico - NMOCD ftp://164.64.106.6/Public/OCD
Layer: NM_Wells_State_Wide_UTM_NAD_83_Z13; Filters: Status=Active, Well Type = Gas, Oil, Injection, Gas Storage; Downloaded 2016-10-25
Utah - DOGM GIS Data ftp
Layers: DNROilGasWells; Filters: Status = Producing, Active, Well Type = Oil well, Gas well, Gas injection, Gas storage; Downloaded 2017-4-11
Wyoming - WDEQ (Cara Keslar, personal communication)
Layers: wogcc_wells; Filters: WellStatus = Permit to Drill, Producing Gas Well, Producing Oil Well; Received 2017-4-7
GIS Data
Arc GIS mdx files, scripts and geodatabases used for the 2017 WAQS MNA pending
Monitors
Airsheds
Design Values
Correlation Analysis
Gap Analysis
Emissions Analysis
______________________________________________
1. EPA 2017a, AQS Pre-generated data files, https://aqsdr1.epa.gov/aqsweb/aqstmp/airdata/download_files.html
2. ibid.
3. EPA 2017b, Map Service: USEPA Office of Environmental Information (OEI). Data: U.S. EPA Office of Air and Radiation (OAR) - Office of Air Quality, downloaded on Oct. 11, 2017 https://gispub.epa.gov/arcgis/rest/services/OAR_OAQPS/DesignValueServicesOAQPS/MapServer
4. 2014-2016 Design Value maps are overlaid with active monitoring locations, rather than site level MD8s, because data for 2016 O3 MD8s were not available at the time of this analysis.
5. EPA 2017b.
6. Highly correlated monitors are defined in the MNA as being correlated with another monitor with a regression coiefficient (R2) >0.8 and average concentration within 10%. The average concentration criteria was set to 15% for NO2. Regressions use all available matching (that is, days where both monitor report data) 24-hour average data.