Introduction
The 3SAQS modeling team used the EPA Modeled Attainment Test Software (
MATS) to conduct ozone and PM attainment tests for monitors in the 4-km modeling domain. As EPA distributes base year design values at monitors in the Federal network, the attainment test results do not include monitors deployed for special field campaigns in the three-state region (i.e. Upper-Green River or Uinta Basin). Included below are the MATS configuration used for the attainment tests and graphical results of design values (DVs) and relative reduction factors (RRFs).
8-Hour Ozone Attainment Test
MATS Configuration
- MATS version 2.6.1
- 5-year weighted average (2009-2011, 2010-2012, 2011-2013)
- Maximum concentration in a 3x3 array of model grid cells around the monitor using inverse distance weighting
- No spatial gradient adjustment
- A site needs to have a concentration of at least 60 ppb for 5 or more days in the year to be plotted
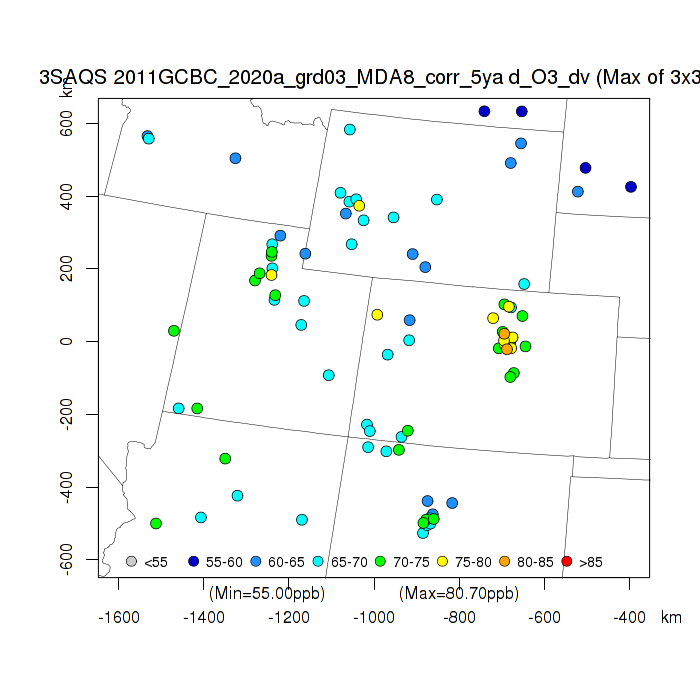
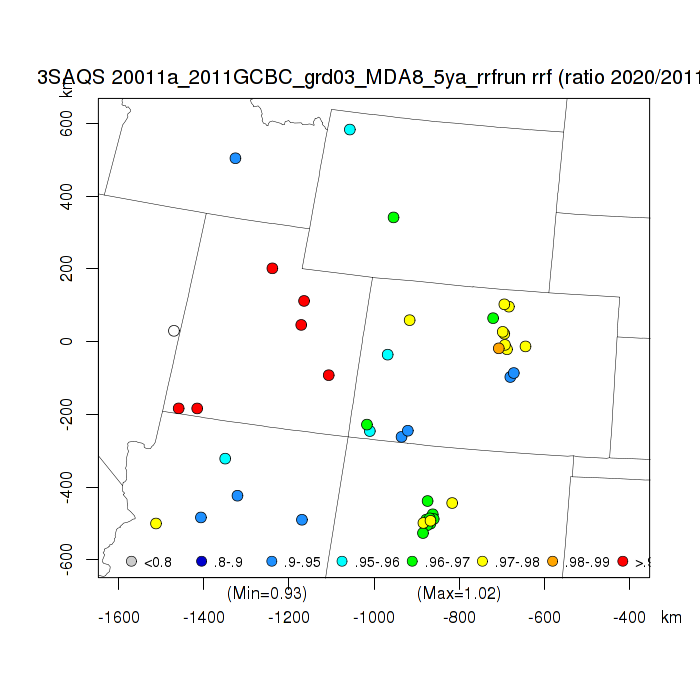
Results
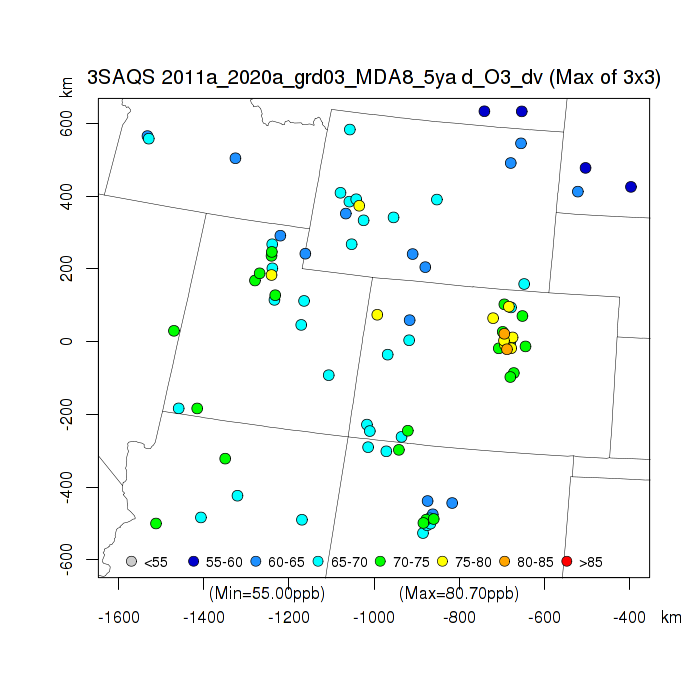
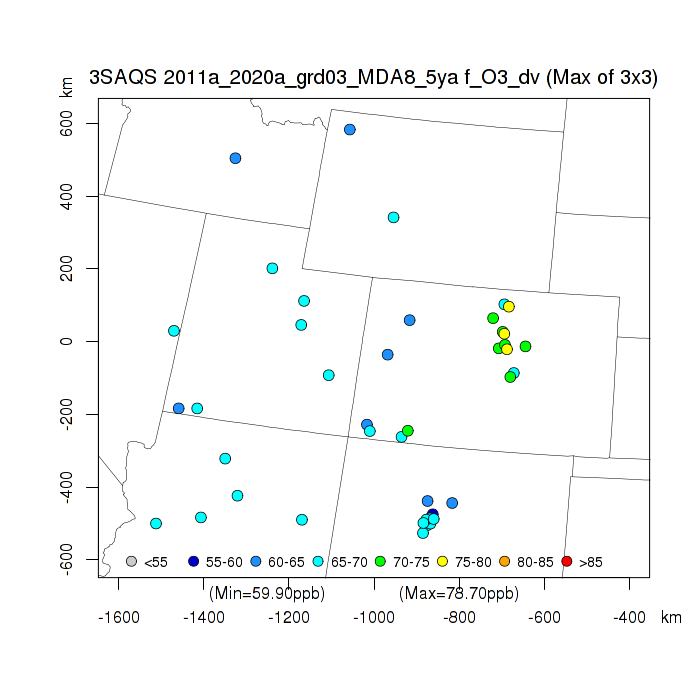
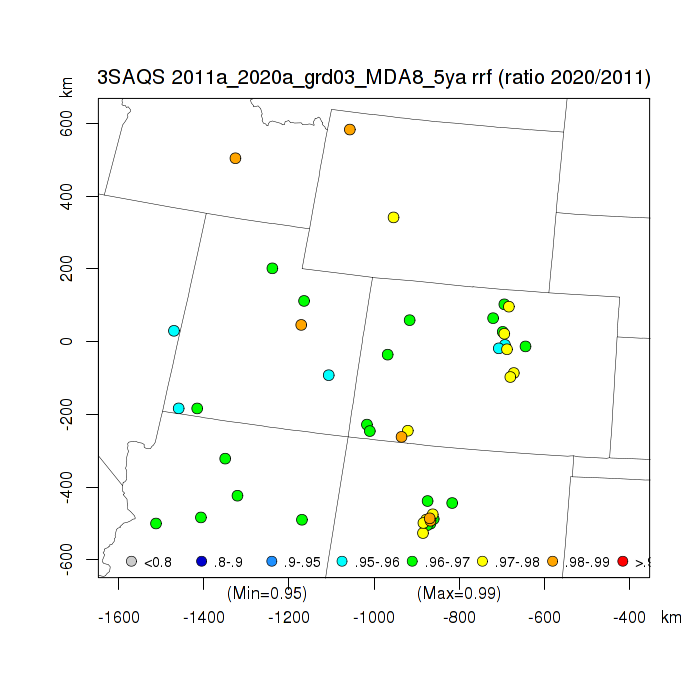
The first set of results shows the base year (CAMx 2011a) and future year (Base2020a_11) design values and relative reduction factors (RRF=future DV/base DV). The future year DV and RRF plots show fewer sites than the base year DV plot because in the future year several sites fall below the 60 ppb minimum threshold concentration.
| Base 2011a DVs | Future 2020_11a DVs | RRF (Future/Base) |
| | |
These next plots show the same thing as the previous plots except the scales have been adjusted to show all sites in the domain. The sites that fall below the 60 ppb threshold are now shown in grey.
| Base 2011a DVs | Future 2020_11a DVs | RRF (Future/Base) |
| add plot | add plot |
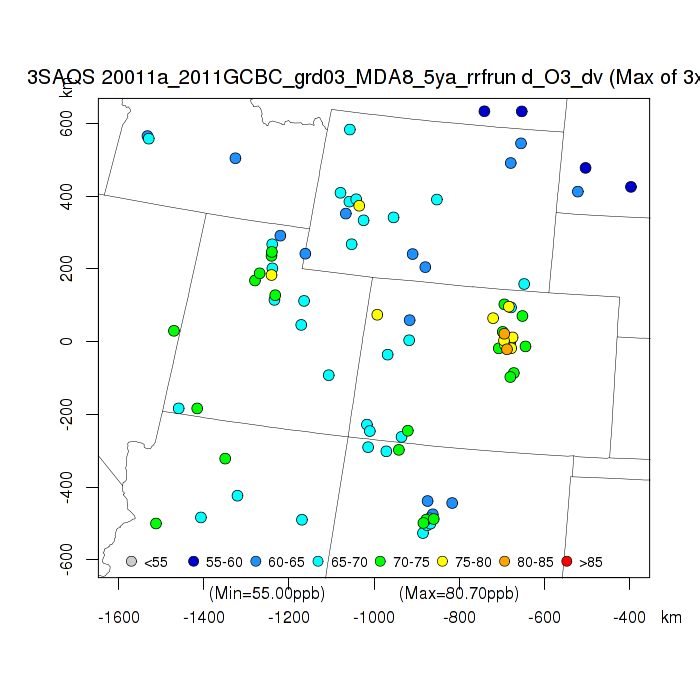
The plots below compare the Base2011a and Base2011a2 DVs. The RRF plot on the right shows the ratio of Base2011a2/Base2011a
| Base 2011a DVs | Base 2011a2 DVs | Ratio (Base2011a2/Base2011a) |
| | |
PM Attainment Test Results
Visibility Attainment Test Results