MATS Modeling Results
Introduction
MATS Configuration
- MATS version 2.6.1
- 5-year weighted average (2009-2011, 2010-2012, 2011-2013)
- 3x3 model grid cells
- Inverse distance weighting
- No spatial gradient adjustment
- A site needs to have a concentration of at least 60 ppb for 5 or more days in the year to be plotted
Results
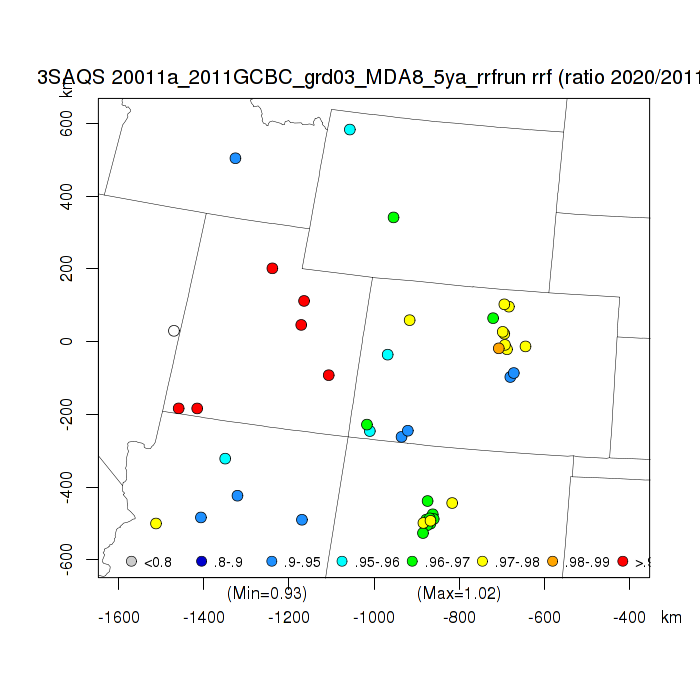
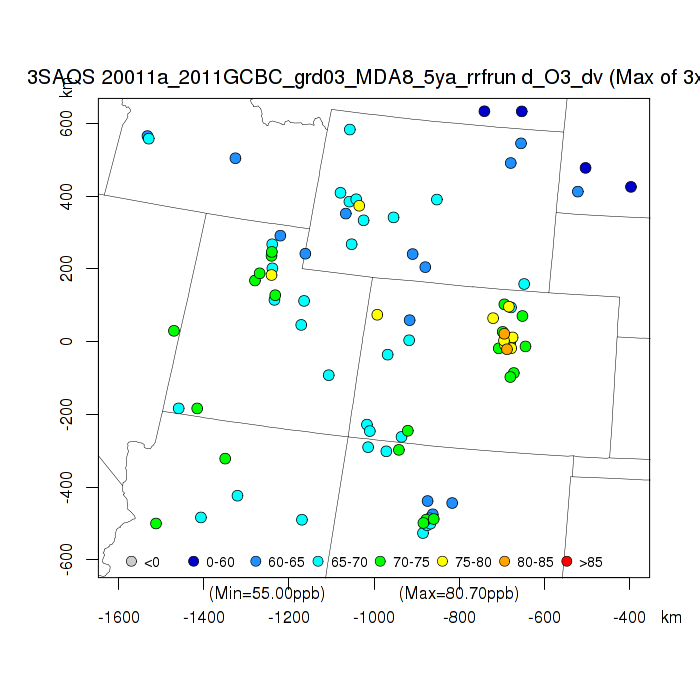
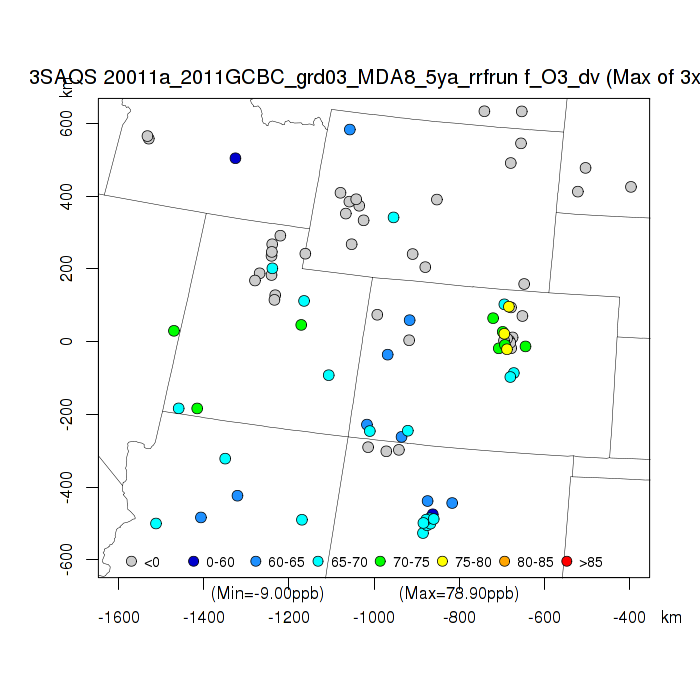
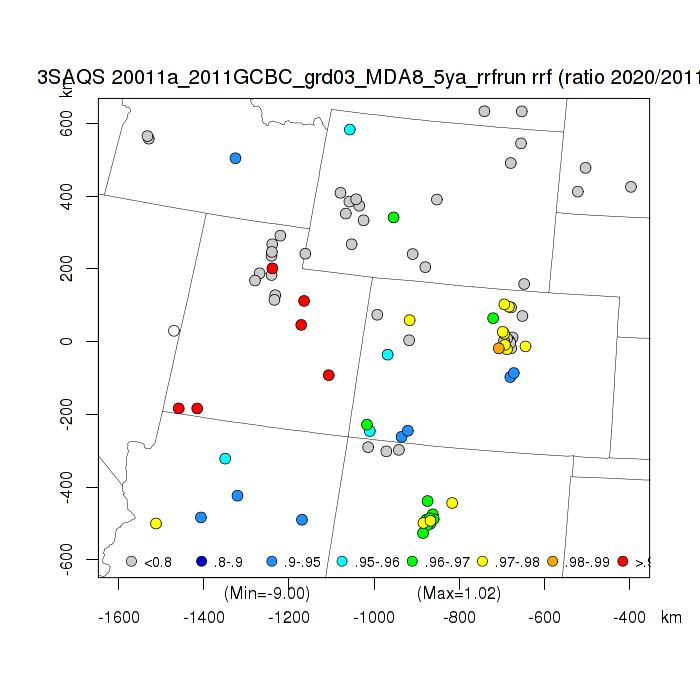
The first set of results shows the base year (CAMx 2011a) and future year (Base2020a_11) design values and relative reduction factors (RRF=future DV/base DV). The future year DV and RRF plots show fewer sites than the base year DV plot because in the future year several sites fall below the 60 ppb minimum threshold concentration.
| Base 2011a DVs | Future 2020_11a DVs | RRF (Future/Base) |
|---|---|---|
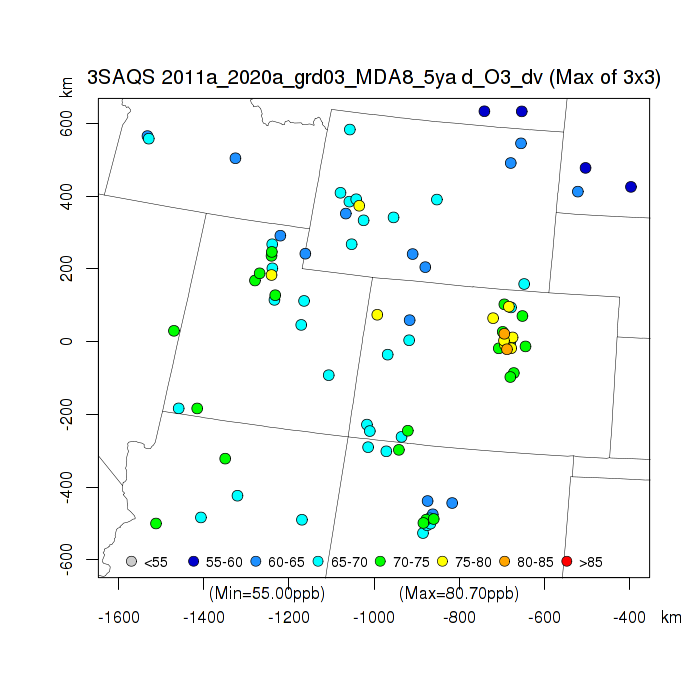 | 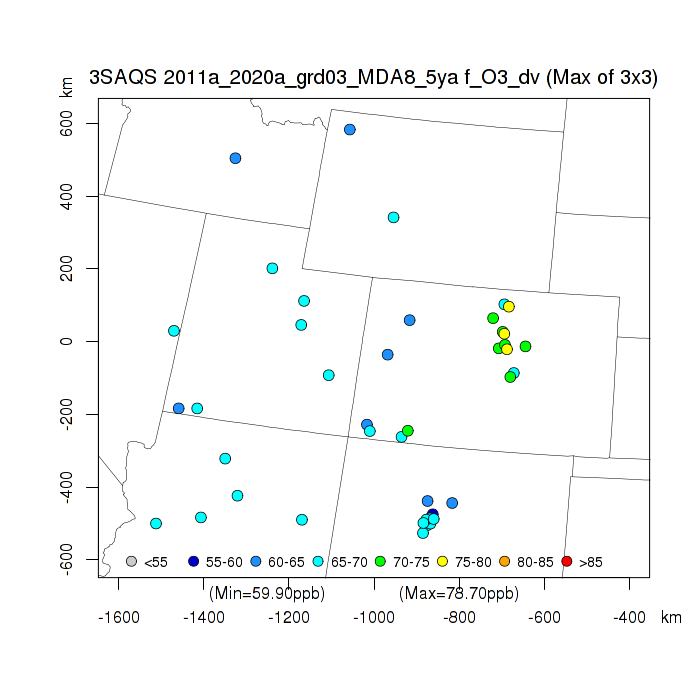 | 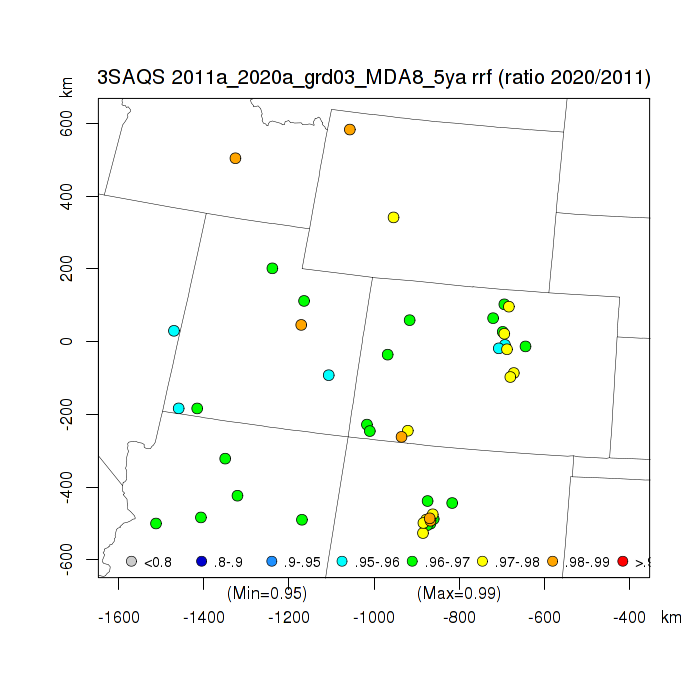 |
| Base 2011a DVs | Future 2020_11a DVs | RRF (Future/Base) |
|---|---|---|
 |  |  |